

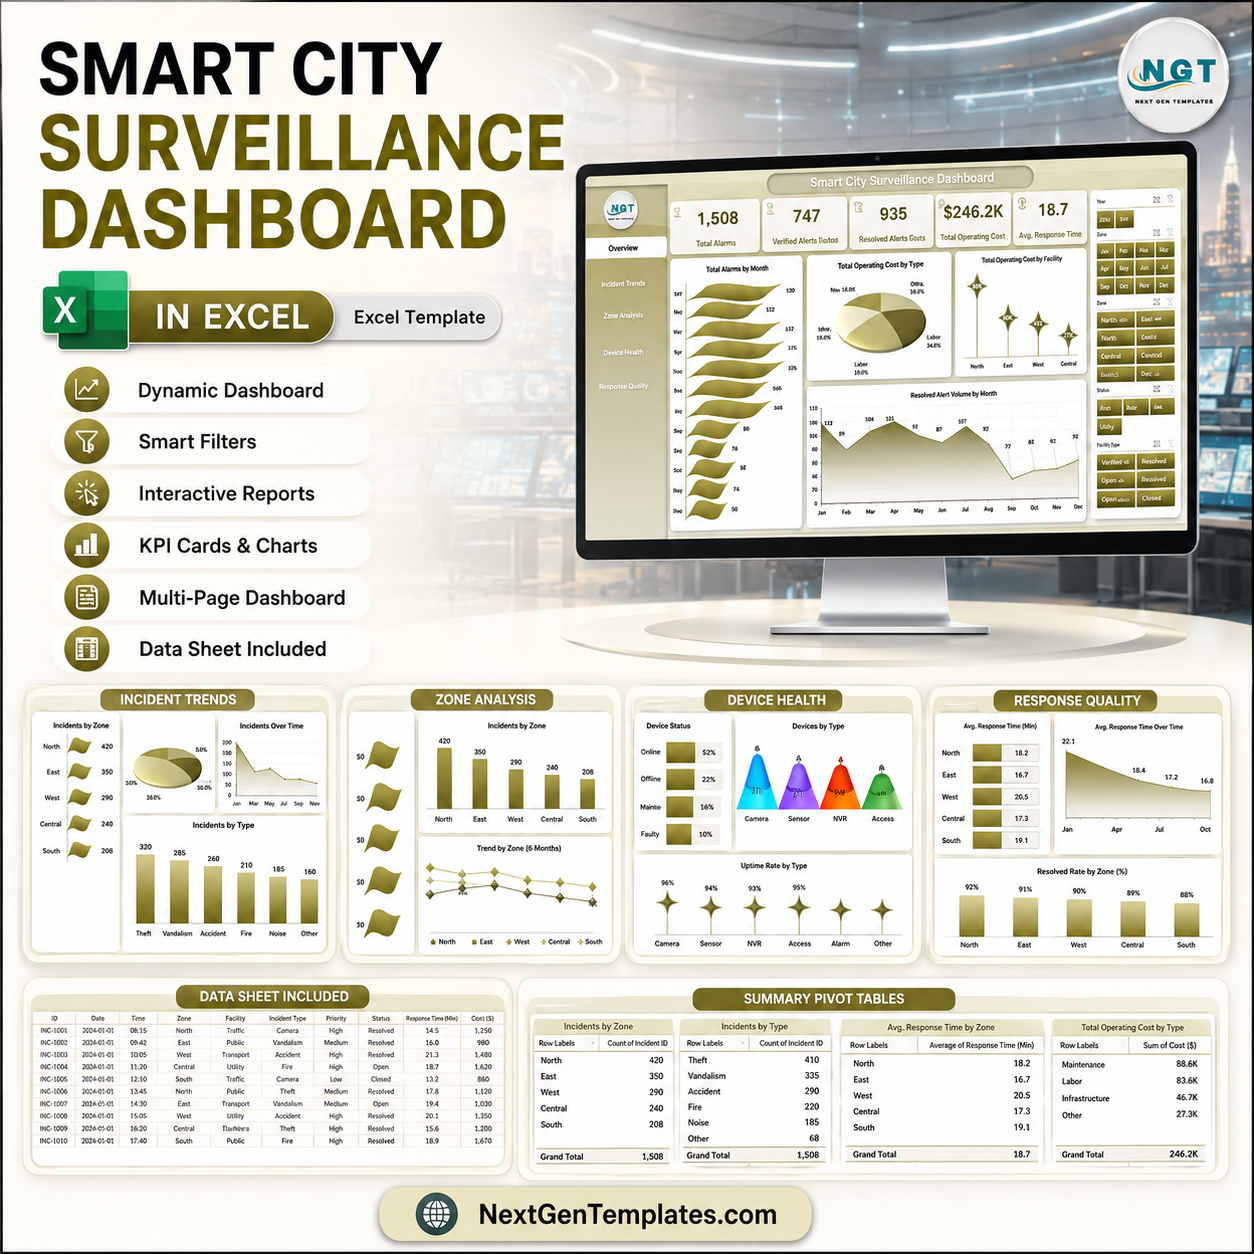


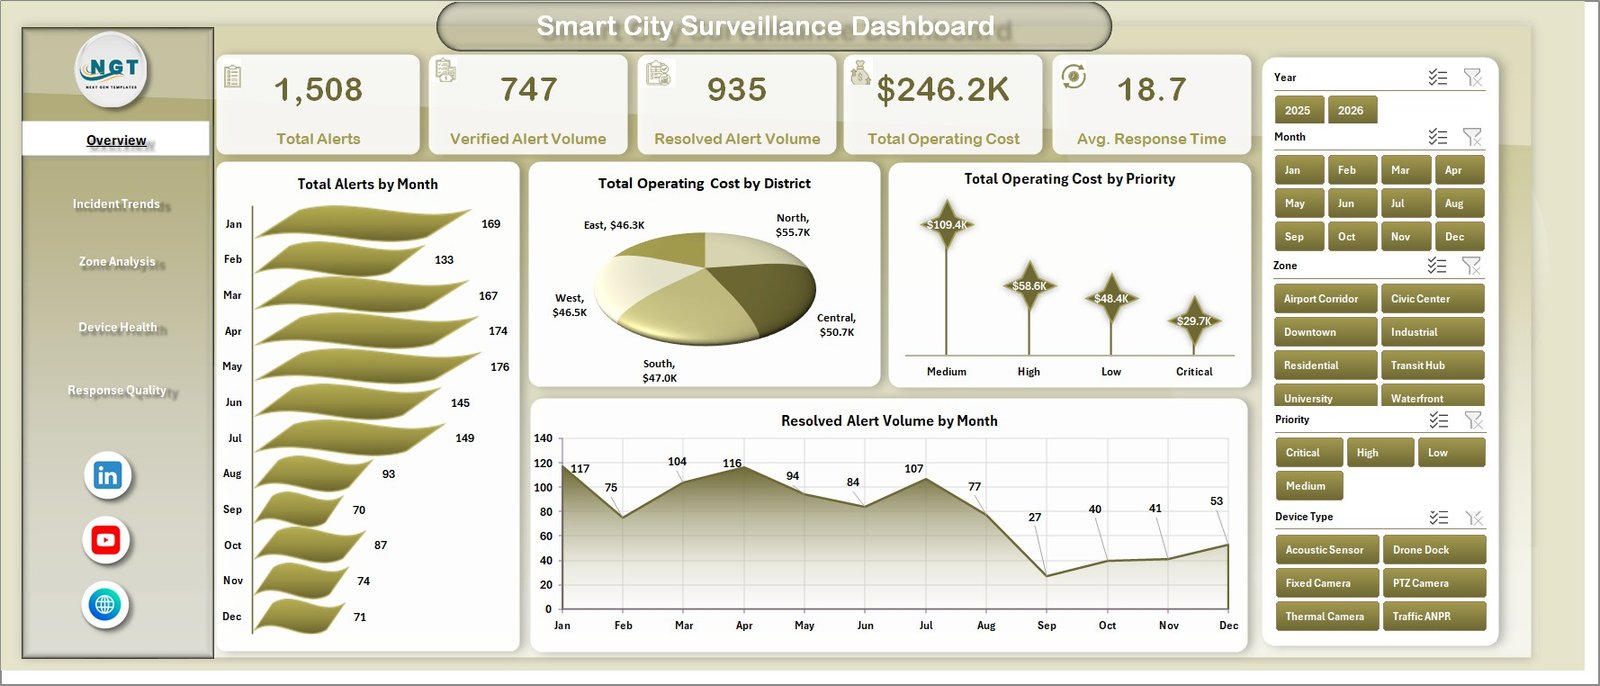
Smart City Surveillance Dashboard in Excel is a ready-to-use reporting template for surveillance operations, public safety monitoring, CCTV teams, security vendors, and smart city command centers. Surveillance teams often manage thousands of alert records across districts, zones, vendors, shifts, incident types, statuses, and device categories. This Excel dashboard gives you a structured way to review Total Alerts, Verified Alert Volume, Resolved Alert Volume, Total Operating Cost, Avg. Response Time, verification quality, resolution performance, and device health in one workbook. It is a one-time purchase, works in Microsoft Excel, and includes a clear data sheet so you can replace the sample data and refresh the dashboard.
Smart City Surveillance Dashboard in Excel
Key Features of Smart City Surveillance Dashboard in Excel
This dashboard includes KPI cards, charts, slicers, data input, and pivot-table support sheets designed for surveillance alert reporting. It helps users move from raw incident records to visual analysis without building charts and pivots manually.
- Overview cards for Total Alerts, Verified Alert Volume, Resolved Alert Volume, Total Operating Cost, and Avg. Response Time.
- Monthly alert, cost, verification, and resolution trend analysis.
- District, zone, vendor, priority, status, shift, incident type, and device type reporting views.
- Dynamic slicers for quick filtering and review.
- Editable data sheet for adding your own surveillance records.
- Support sheet with pivot tables used to refresh dashboard charts.
What’s Inside the Smart City Surveillance Dashboard in Excel
Overview Page
The Overview page shows the main operational cards and high-level charts. Total Alerts by Month shows alert movement over time. Total Operating Cost by District compares district-level spending. Total Operating Cost by Priority shows where cost is concentrated by alert priority. Resolved Alert Volume by Month tracks how many alerts are closed across the year.
Incident Trends
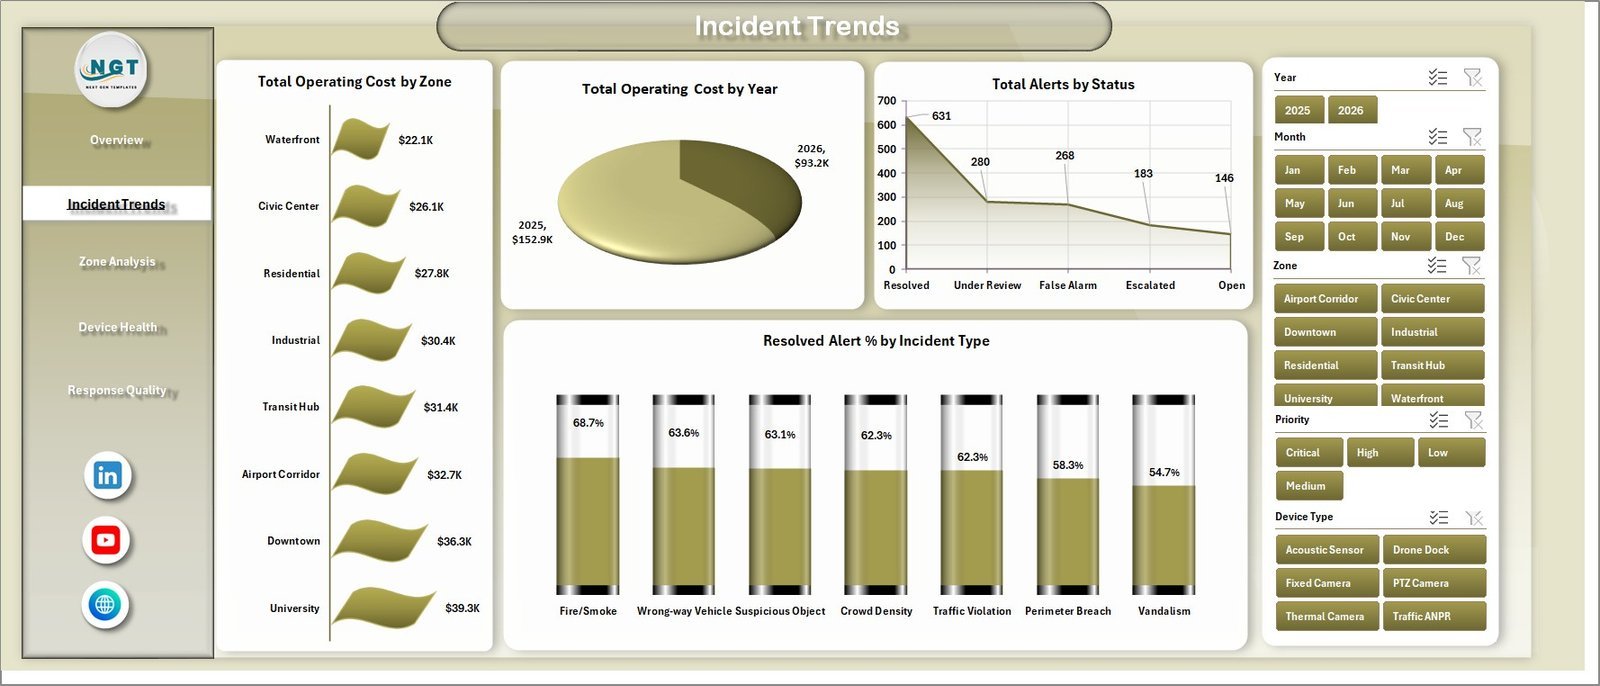
This page includes Total Operating Cost by Zone, Total Operating Cost by Year, Total Alerts by Status, and Resolved Alert % by Incident Type. These visuals help teams review long-term cost trends, alert status distribution, and which incident types are being resolved more effectively.
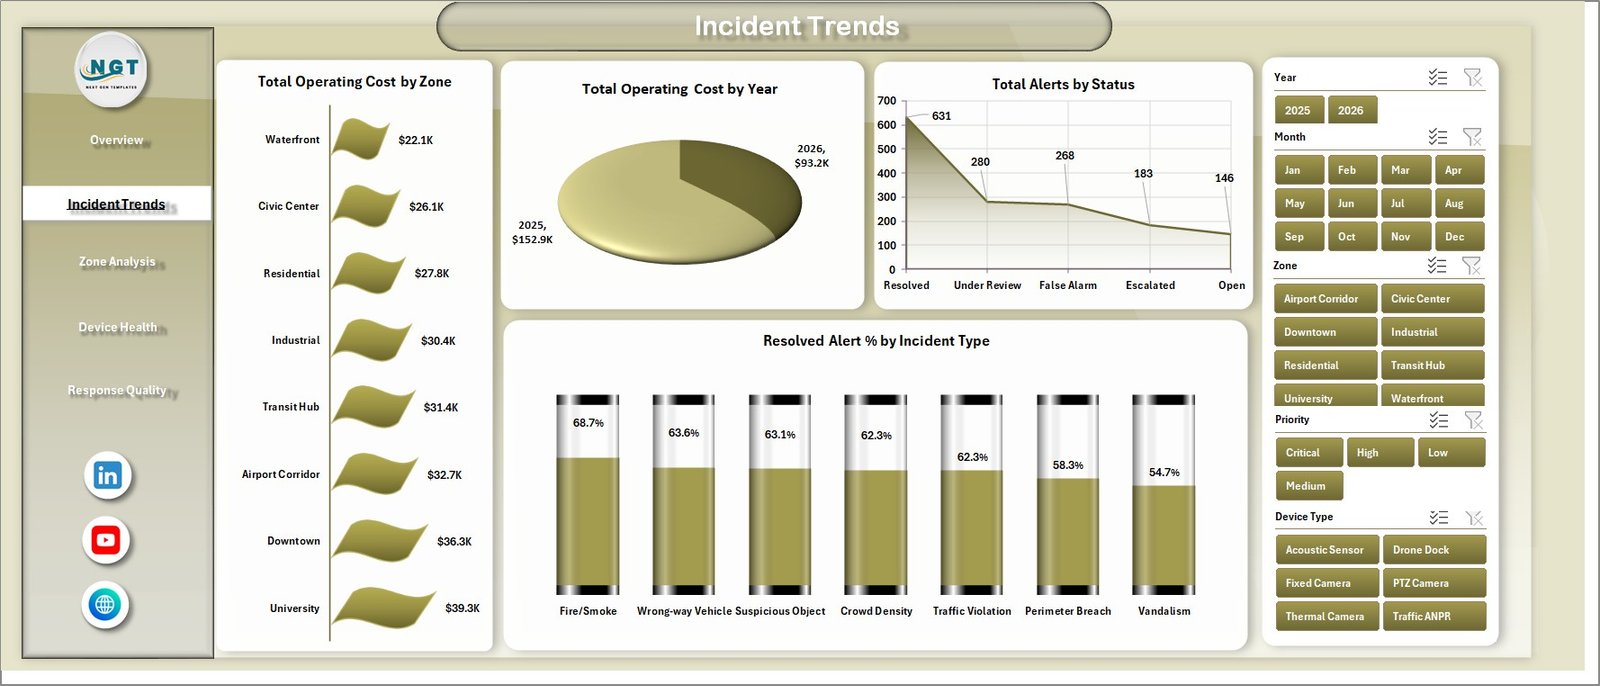
Incident Trends
Zone Analysis
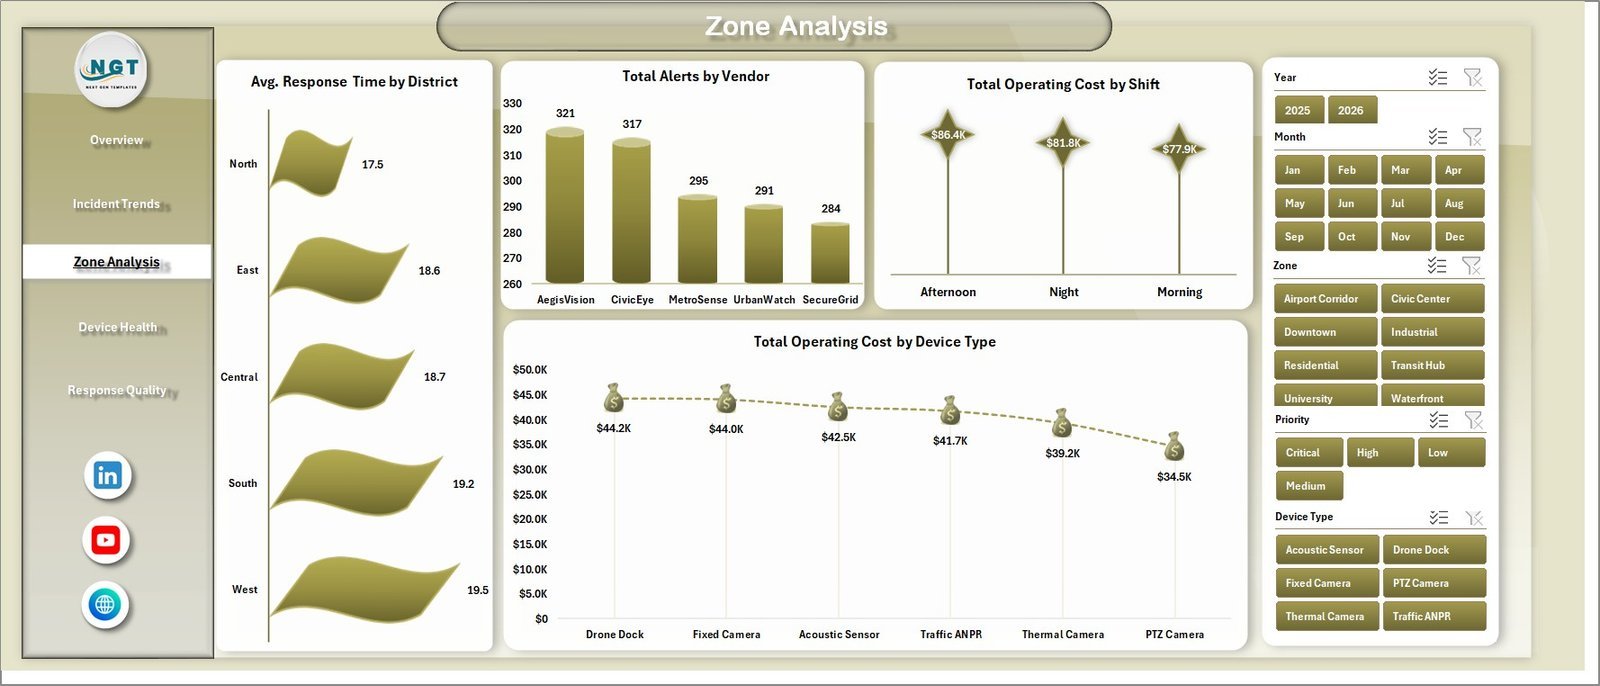
The Zone Analysis page compares Avg. Response Time by District, Total Alerts by Vendor, Total Operating Cost by Shift, and Total Operating Cost by Device Type. It is useful for identifying high-cost shifts, slow-response districts, vendor-related alert volume, and device groups that require more attention.
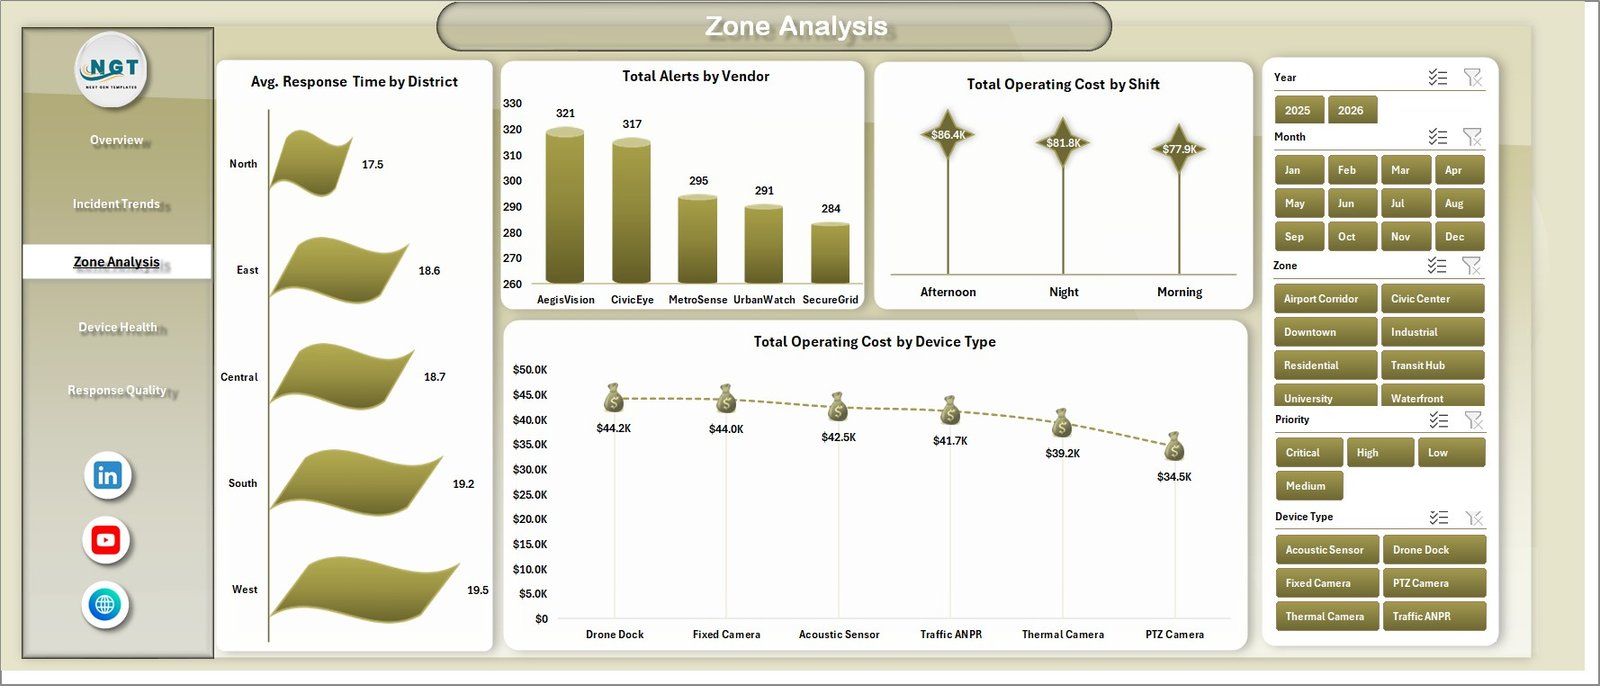
Zone Analysis
Device Health
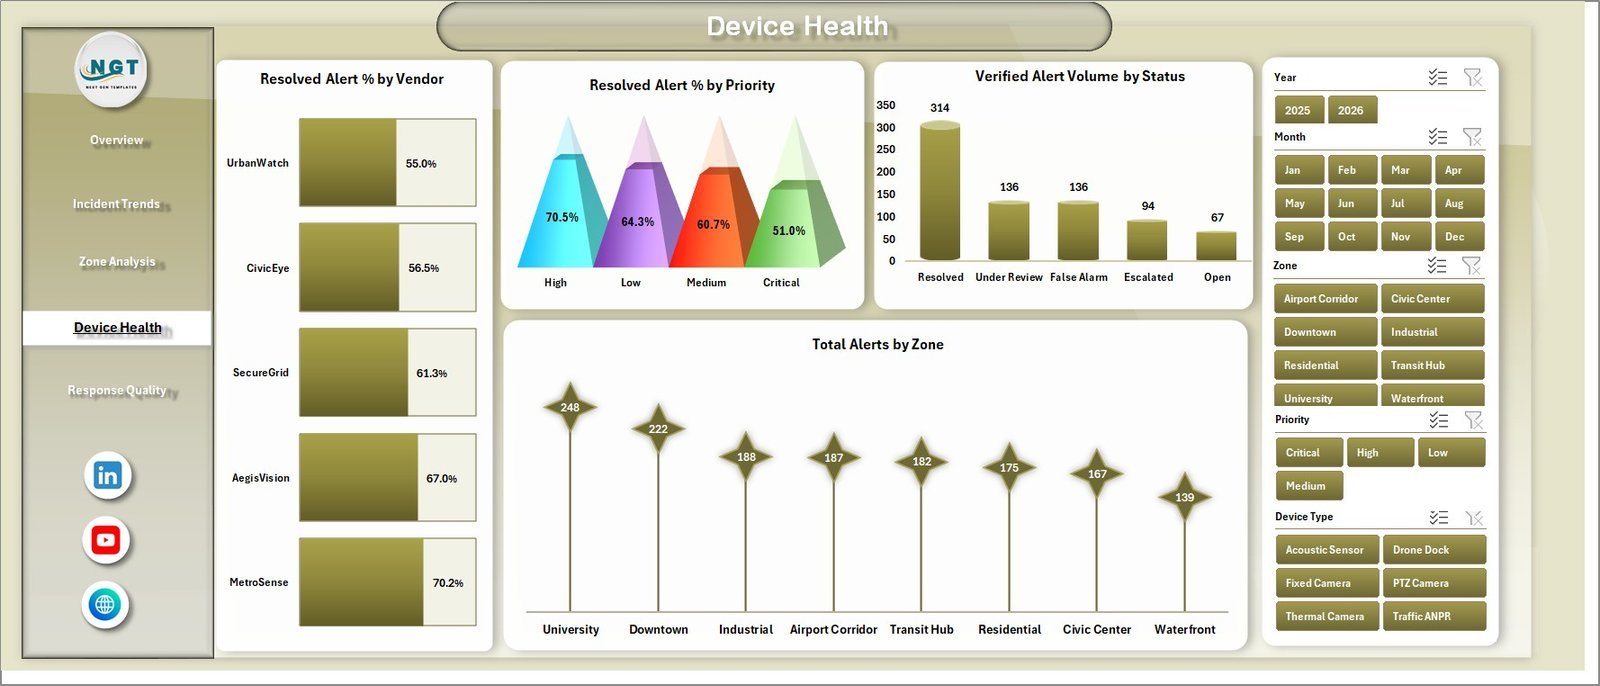
The Device Health page includes Resolved Alert % by Vendor, Resolved Alert % by Priority, Verified Alert Volume by Status, and Total Alerts by Zone. It helps users evaluate whether surveillance infrastructure, vendor operations, and priority handling are performing as expected.
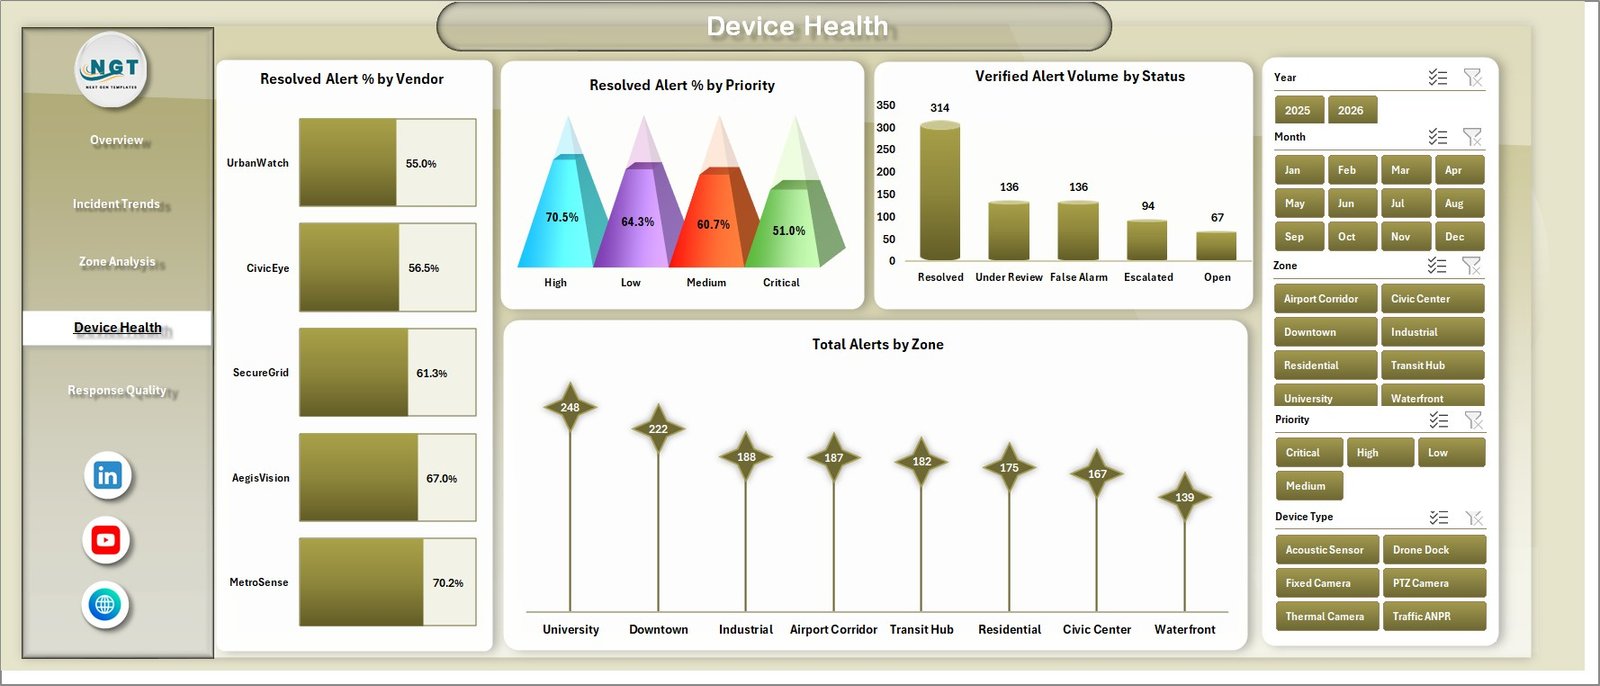
Device Health
Response Quality
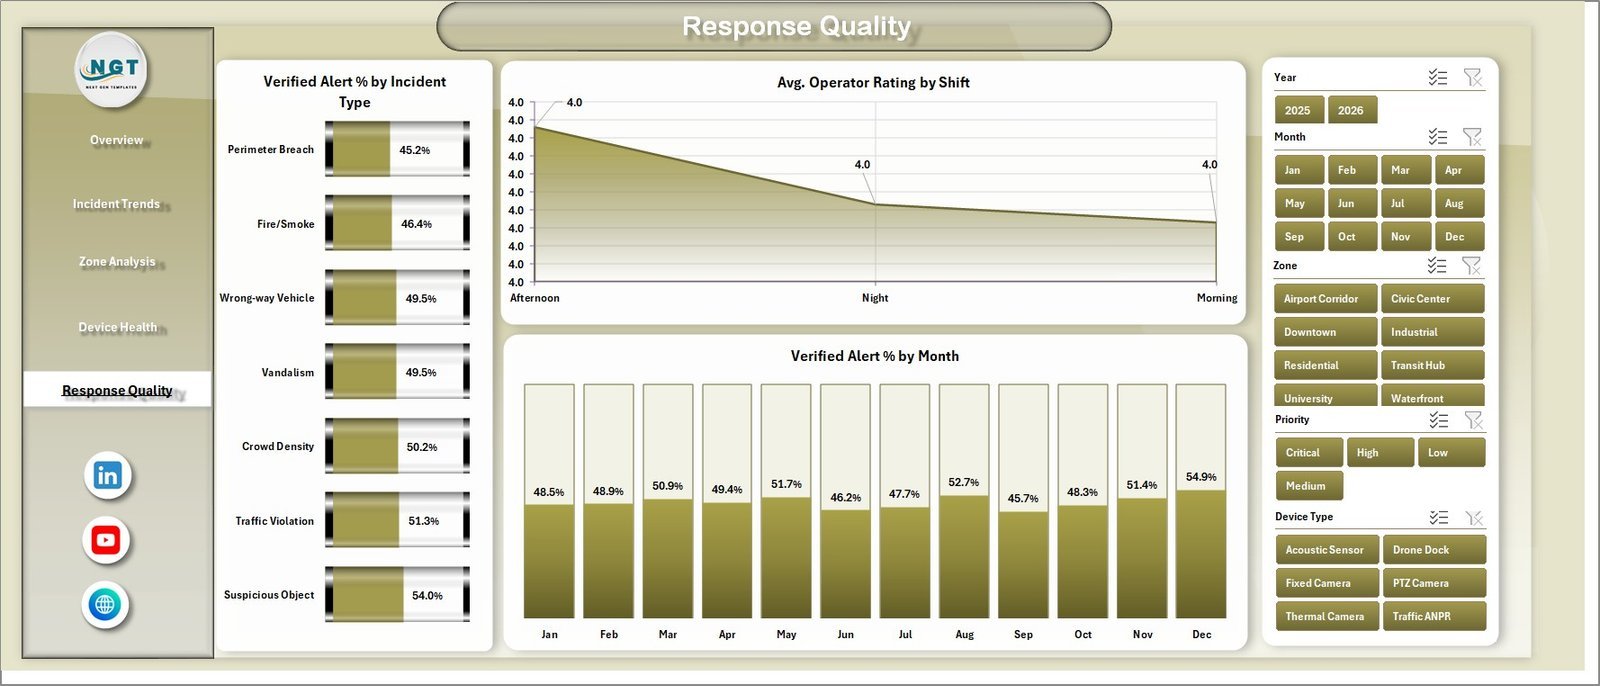
The Response Quality page focuses on Verified Alert % by Incident Type, Avg. Operator Rating by Shift, and Verified Alert % by Month. It is useful for monitoring operator quality, false-alert patterns, verification consistency, and monthly process improvement.
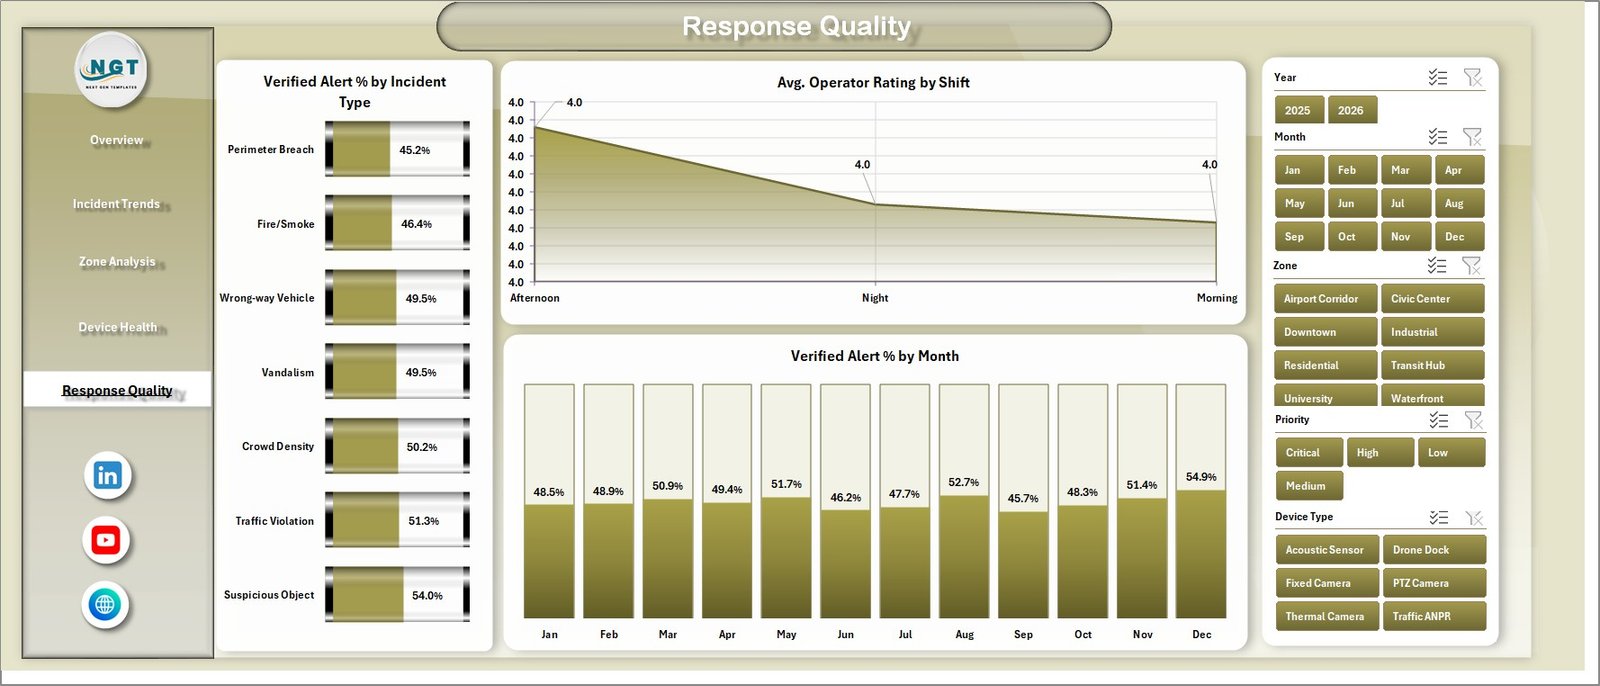
Response Quality
Data Sheet Tab
The Data sheet is where you add the data in the same format as the sample file. Keep the same column structure, enter your surveillance alert records, and refresh the workbook after updating.

Data Sheet tab
Support Sheet
The Support sheet contains multiple pivot tables used to create the dashboard dynamically. Go to the Data tab in the Excel Ribbon and click Refresh All after updating the Data sheet. You can keep this sheet hidden for normal users.

Support sheet tab
Smart City Surveillance Dashboard in Excel vs. Google Sheets vs. Paid CRM/SaaS – Where This Fits
| Feature | This Excel Template | Google Sheets Alternative | Paid SaaS Alternative |
|---|---|---|---|
| Cost | One-time purchase | Low cost if already using Google Workspace | Subscription fees |
| Setup time | Replace data and refresh | May need dashboard rebuilding | Needs onboarding and configuration |
| Customization | High for Excel users | High for Sheets users | Depends on vendor settings |
| Live surveillance feed | No | No | Possible in specialized systems |
| Local file control | Strong | Cloud-first | Vendor platform |
Who This Template Is For – and Who It’s Not For
This template is for smart city teams, public safety analysts, CCTV monitoring units, security operations managers, municipal reporting teams, and consultants who need Excel-based surveillance reporting. It is not for teams that need live camera streaming, automated dispatch, real-time alert routing, or a full case management platform.
How to Use the Smart City Surveillance Dashboard in Excel
- Download and open the workbook in Microsoft Excel.
- Go to the Data sheet and replace the sample rows with your own records.
- Keep the same data structure so the pivots and charts continue to work.
- Click Data > Refresh All in Excel.
- Use the dashboard pages and slicers to analyze alerts, cost, response time, vendors, zones, devices, and response quality.
Real-World Use Cases
Municipal operations manager: reviews alert volume, cost, and response time before weekly city operations meetings.
Public safety analyst: compares zones, districts, and incident types to find where surveillance events require more attention.
Security vendor supervisor: reviews vendor, shift, and device type performance for monthly service reporting.
Frequently Asked Questions
Can I use my own data?
Yes. Replace the sample records in the Data sheet using the same format, then refresh the workbook.
Does it require macros?
No macro requirement is mentioned. The workbook uses dashboard sheets, charts, slicers, and pivot tables.
Can I filter the dashboard?
Yes. Slicers are included so you can quickly review filtered dashboard views.
What sheets are included?
Overview, Incident Trends, Zone Analysis, Device Health, Response Quality, Data Sheet, and Support Sheet.
Can I hide the Support sheet?
Yes. The Support sheet powers the dashboard and can be hidden during normal use.
Is this a live CCTV system?
No. It is an Excel reporting dashboard for analyzing surveillance alert data.
About the Author
Built by PK – Microsoft Certified Professional with 15+ years of Excel, Google Sheets, and Power BI experience. Founder of NextGenTemplates, reaching 300K+ subscribers across YouTube channels. Every template is hand-built and tested before release.
Explore Related Templates
Explore more Excel Dashboard templates and other Microsoft Excel templates on NextGenTemplates.
Download the Smart City Surveillance Dashboard in Excel today and start reviewing alert volume, response quality, operating cost, vendor performance, and device health in a ready-to-use workbook.
Last updated: August 12, 2026.






























Reviews
There are no reviews yet.