

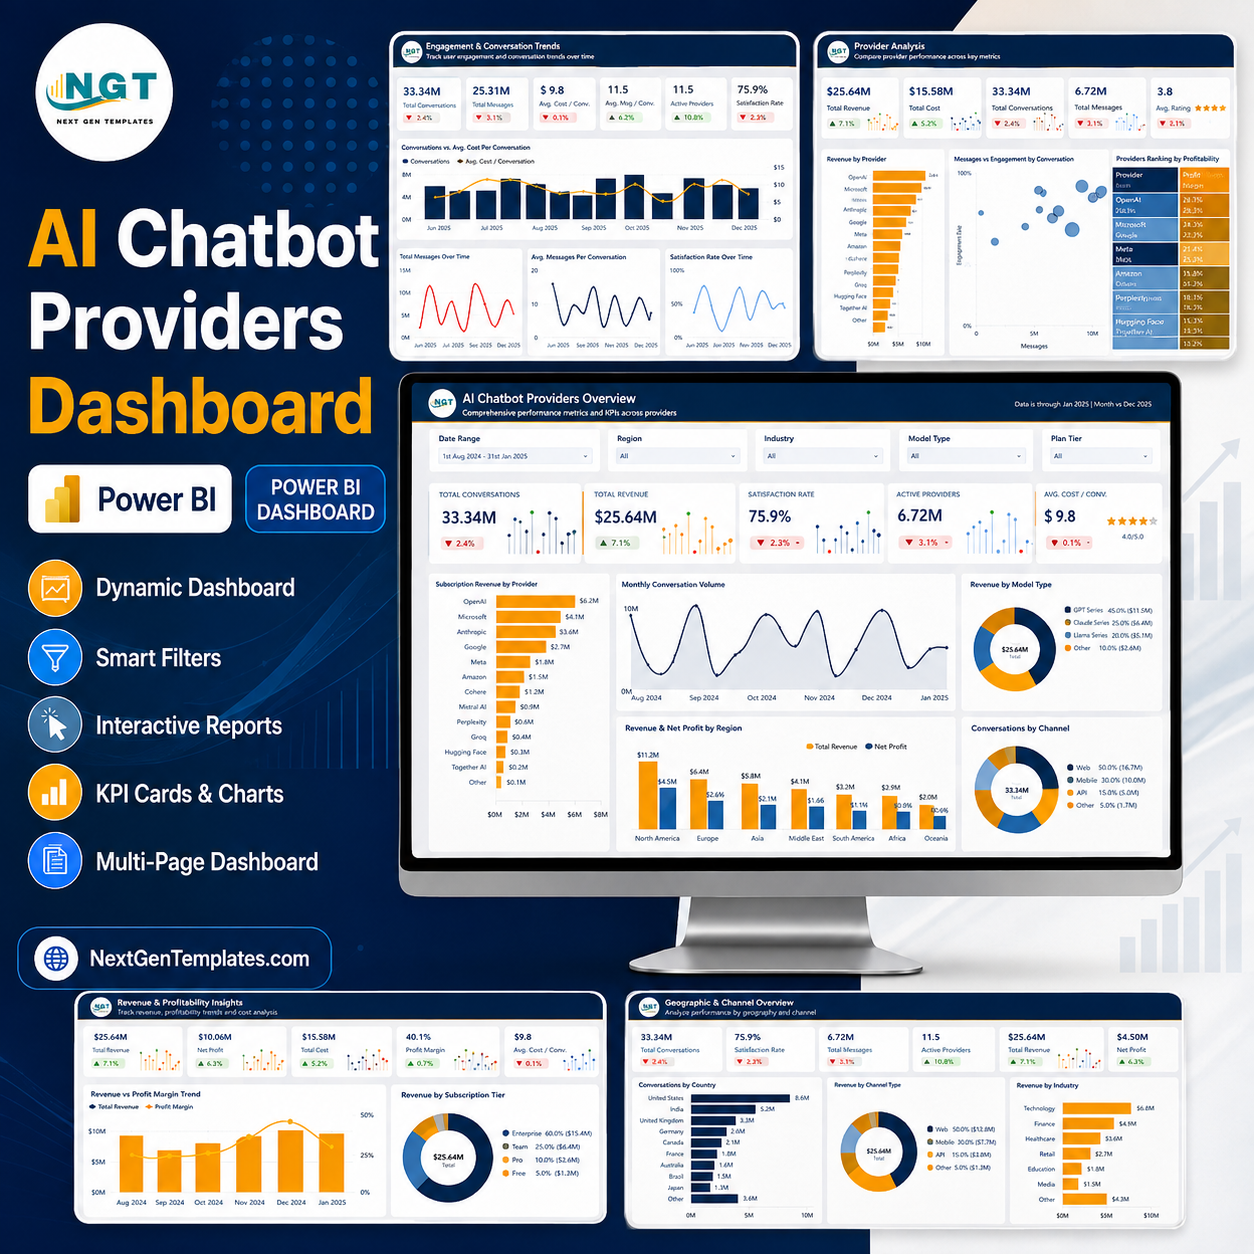
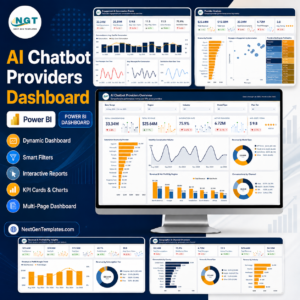
AI Chatbot Providers Dashboard in Power BI helps AI product teams, SaaS leaders, support managers, and consultants review chatbot performance across 5 report pages, 5 KPI cards, and 20+ analysis visuals. Instead of checking separate exports for conversations, subscription revenue, support cost, active users, resolution rate, escalations, average response time, CSAT, plan tiers, channels, model types, and regions, this PBIX dashboard brings the core metrics into one editable Power BI report. Built by PK, a Microsoft Certified Professional with 15+ years of Excel, Google Sheets, and Power BI experience and 300K+ YouTube subscribers, it gives teams a practical reporting layer for a $17.99 one-time sale price.
Key Features of AI Chatbot Providers Dashboard in Power BI
- 5 Power BI report pages: Overview, Engagement and Conversation Trends, Provider Analysis, Revenue and Profitability Insights, and Operations and Channels.
- Executive KPI cards: Track total conversations, subscription revenue, resolution rate, active users, satisfaction, total cost, net profit, profit margin, ARPU, response time, and support cost.
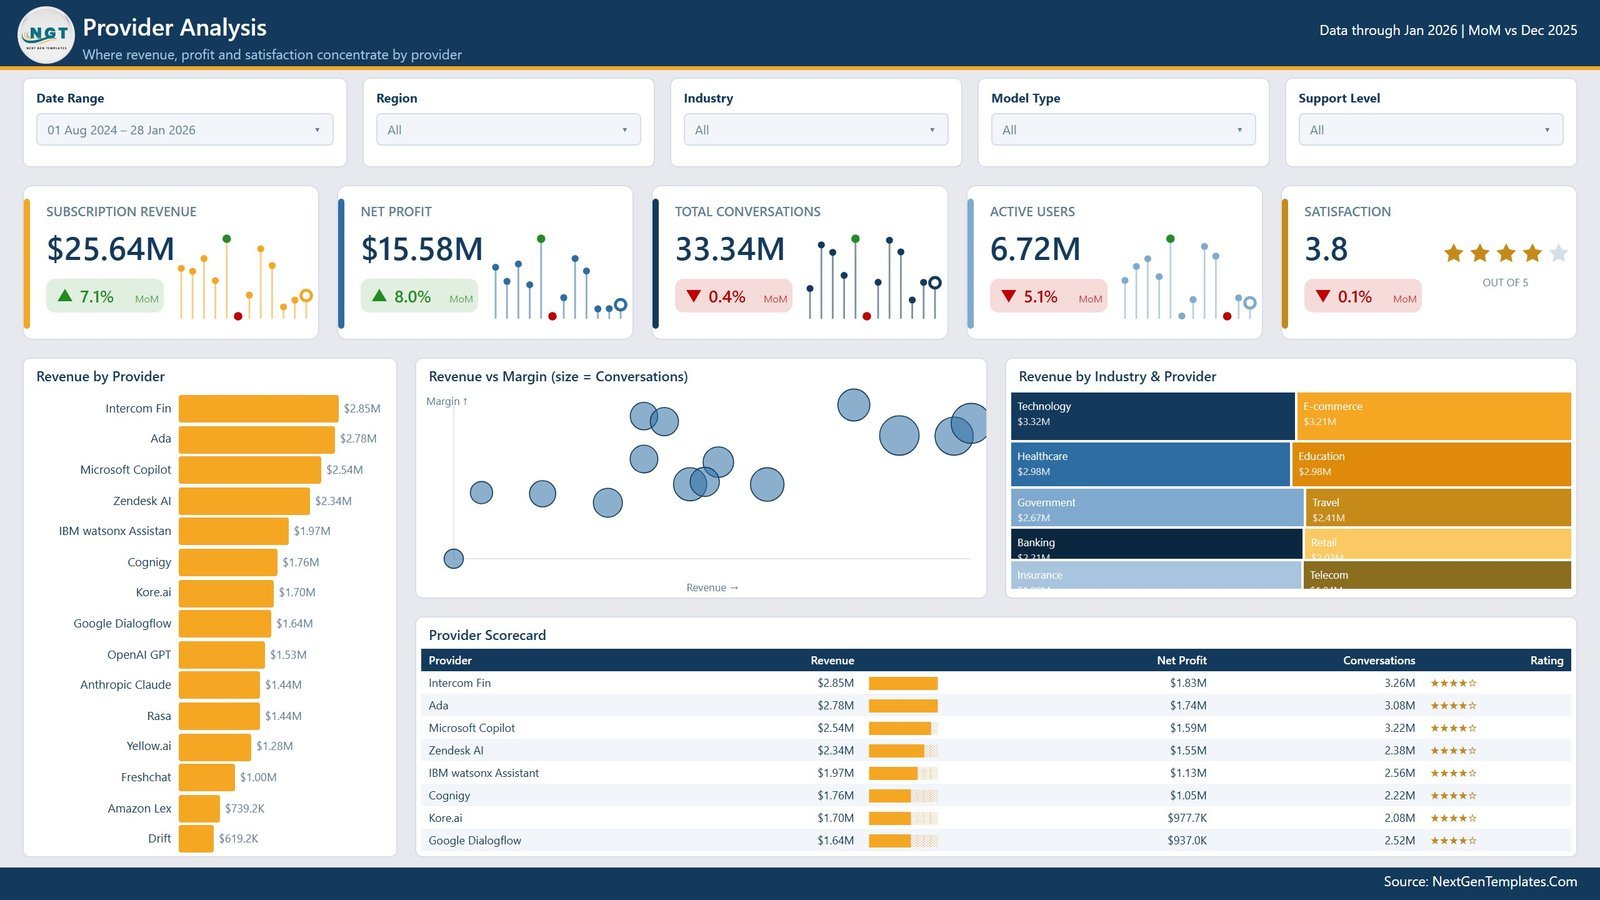
- Provider analysis: Compare revenue, margin, net profit, conversations, active users, and satisfaction by chatbot provider.
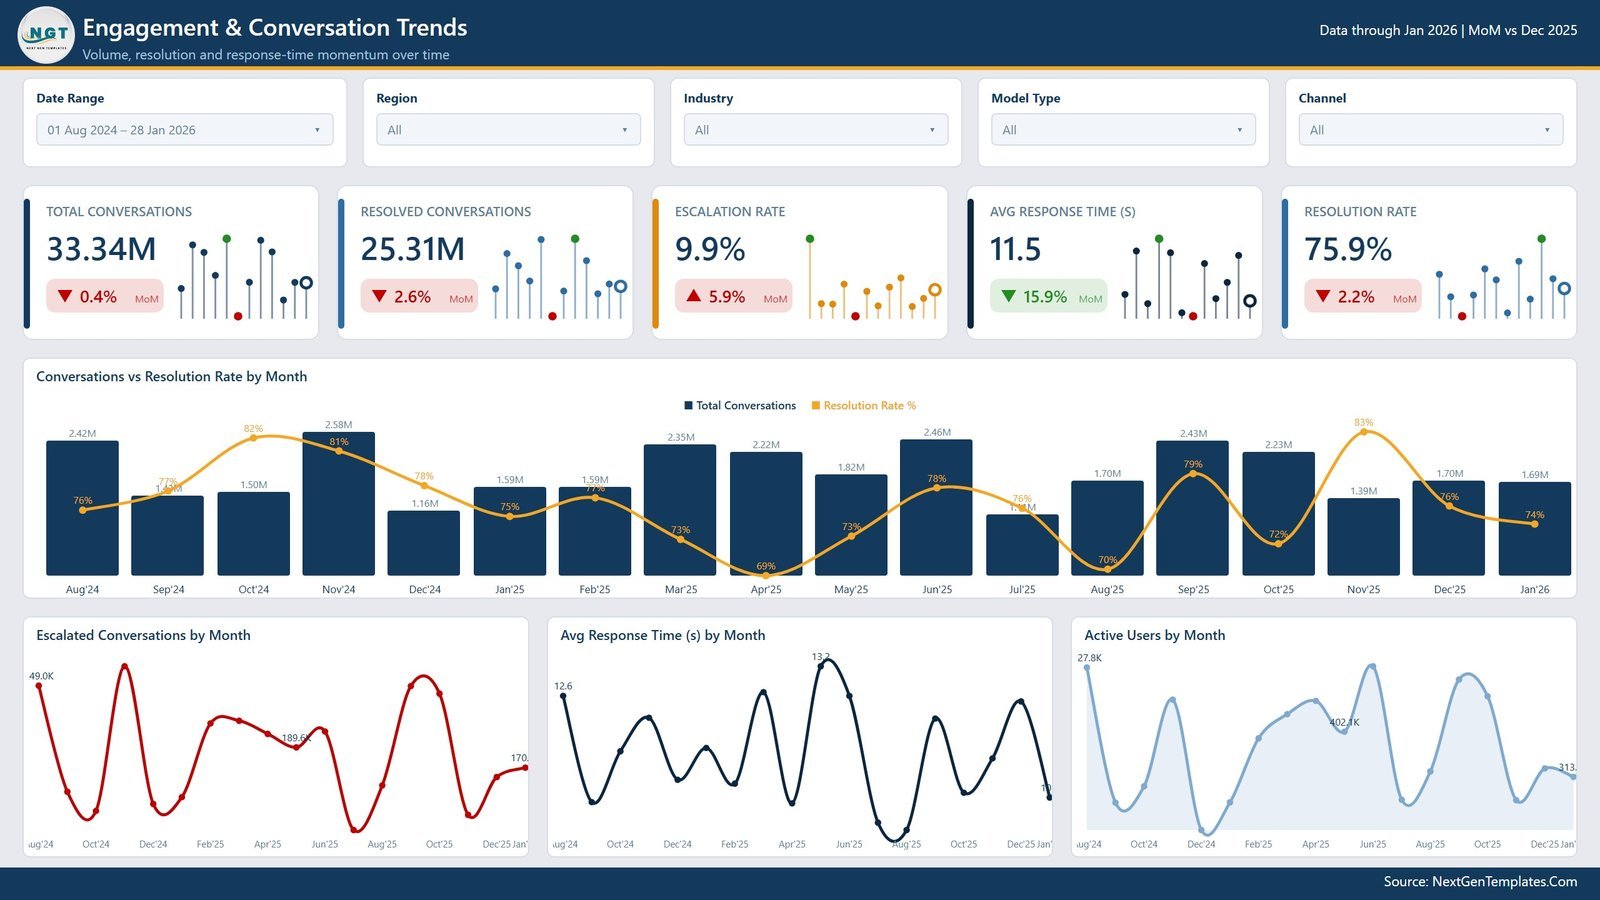
- Engagement reporting: Review monthly conversation volume, resolved conversations, escalation rate, response time, and user momentum.
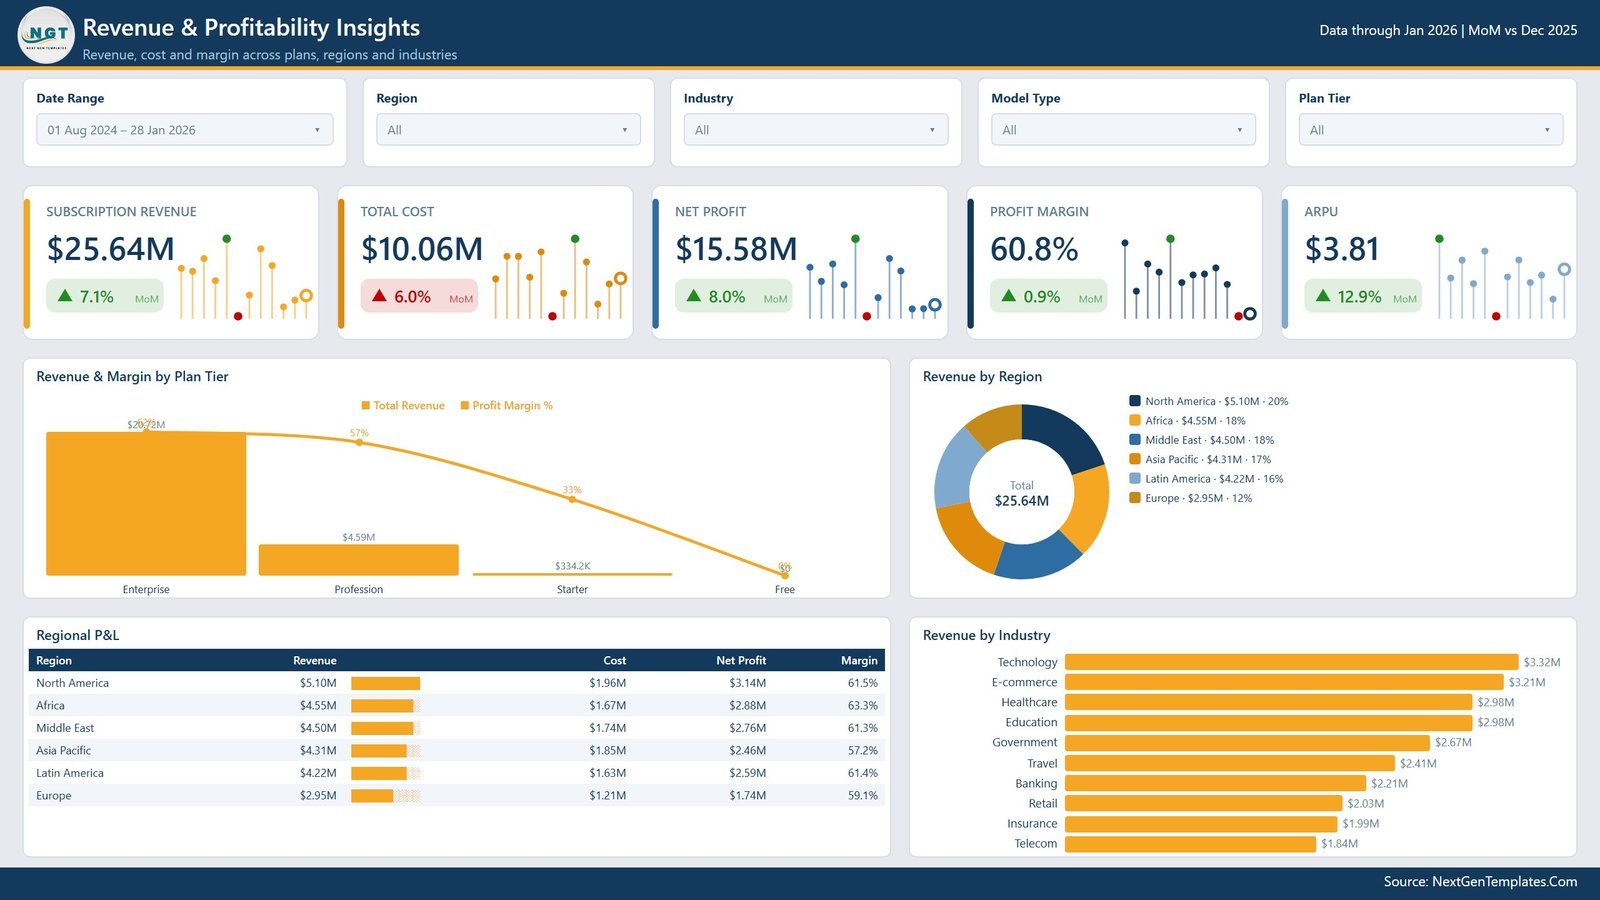
- Financial insight: Break down revenue and profitability by plan tier, region, model type, industry, and provider.
- Operational views: Monitor conversations by country, channel, model type, deployment type, and support level.
- Interactive filters: Use date range, region, industry, model type, and plan tier slicers for focused analysis.
What’s Inside the AI Chatbot Providers Dashboard in Power BI
1. Overview Page
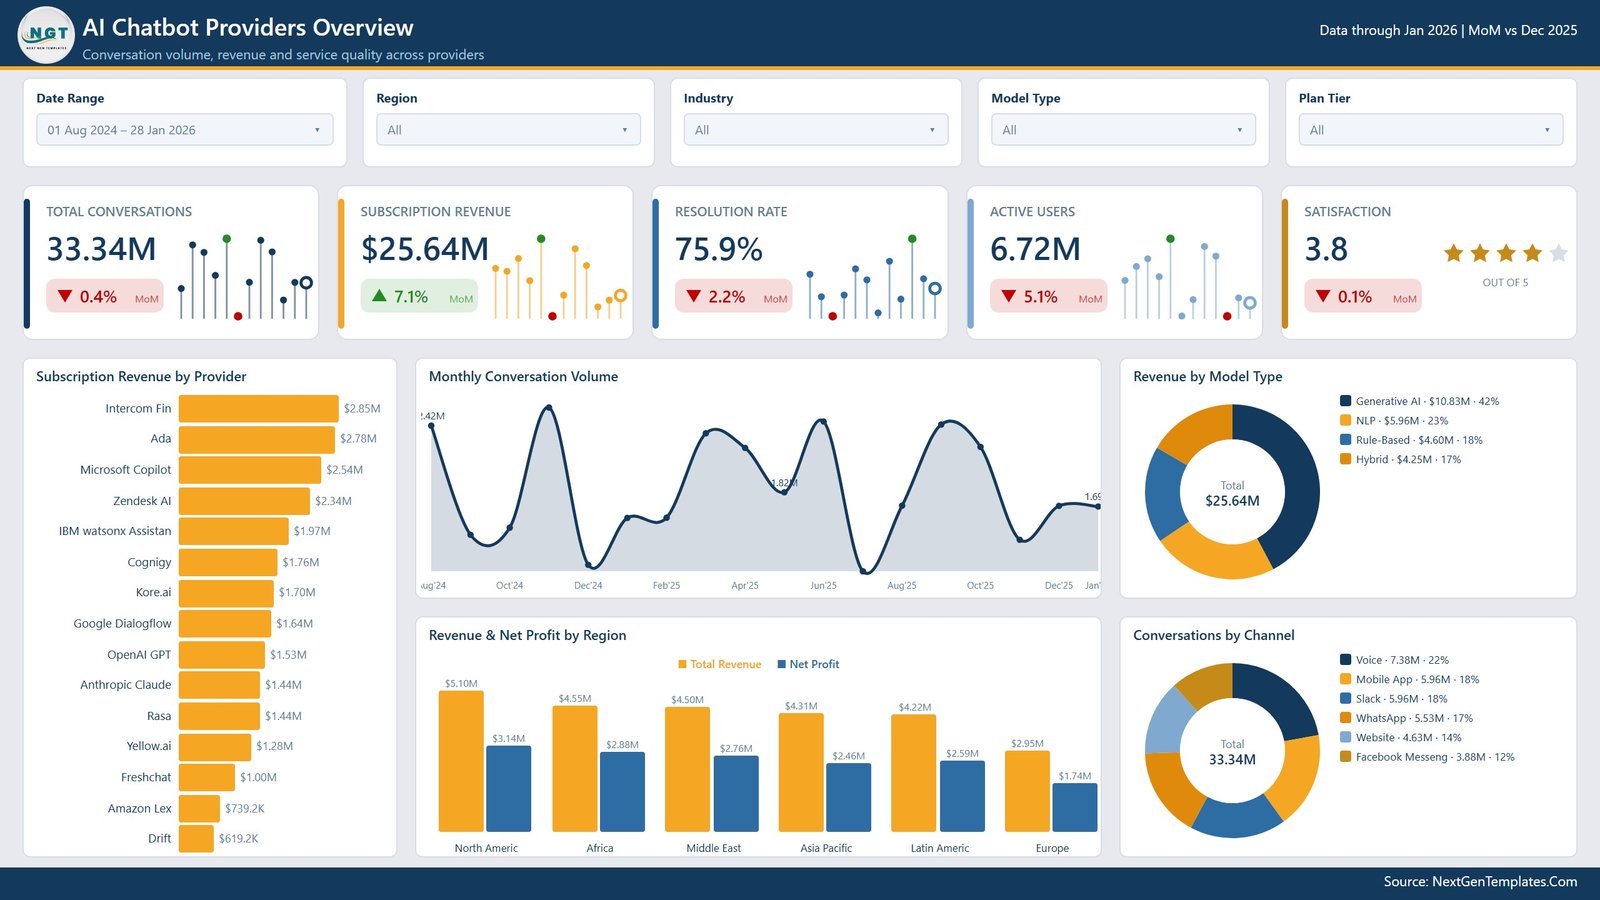
The Overview page gives leadership a high-level view of chatbot business performance. Filters at the top let users narrow the report by date range, region, industry, model type, and plan tier. KPI cards summarize total conversations, subscription revenue, resolution rate, active users, and satisfaction. The supporting visuals compare subscription revenue by provider, monthly conversation volume, revenue by model type, revenue and net profit by region, and conversations by channel.
2. Engagement and Conversation Trends
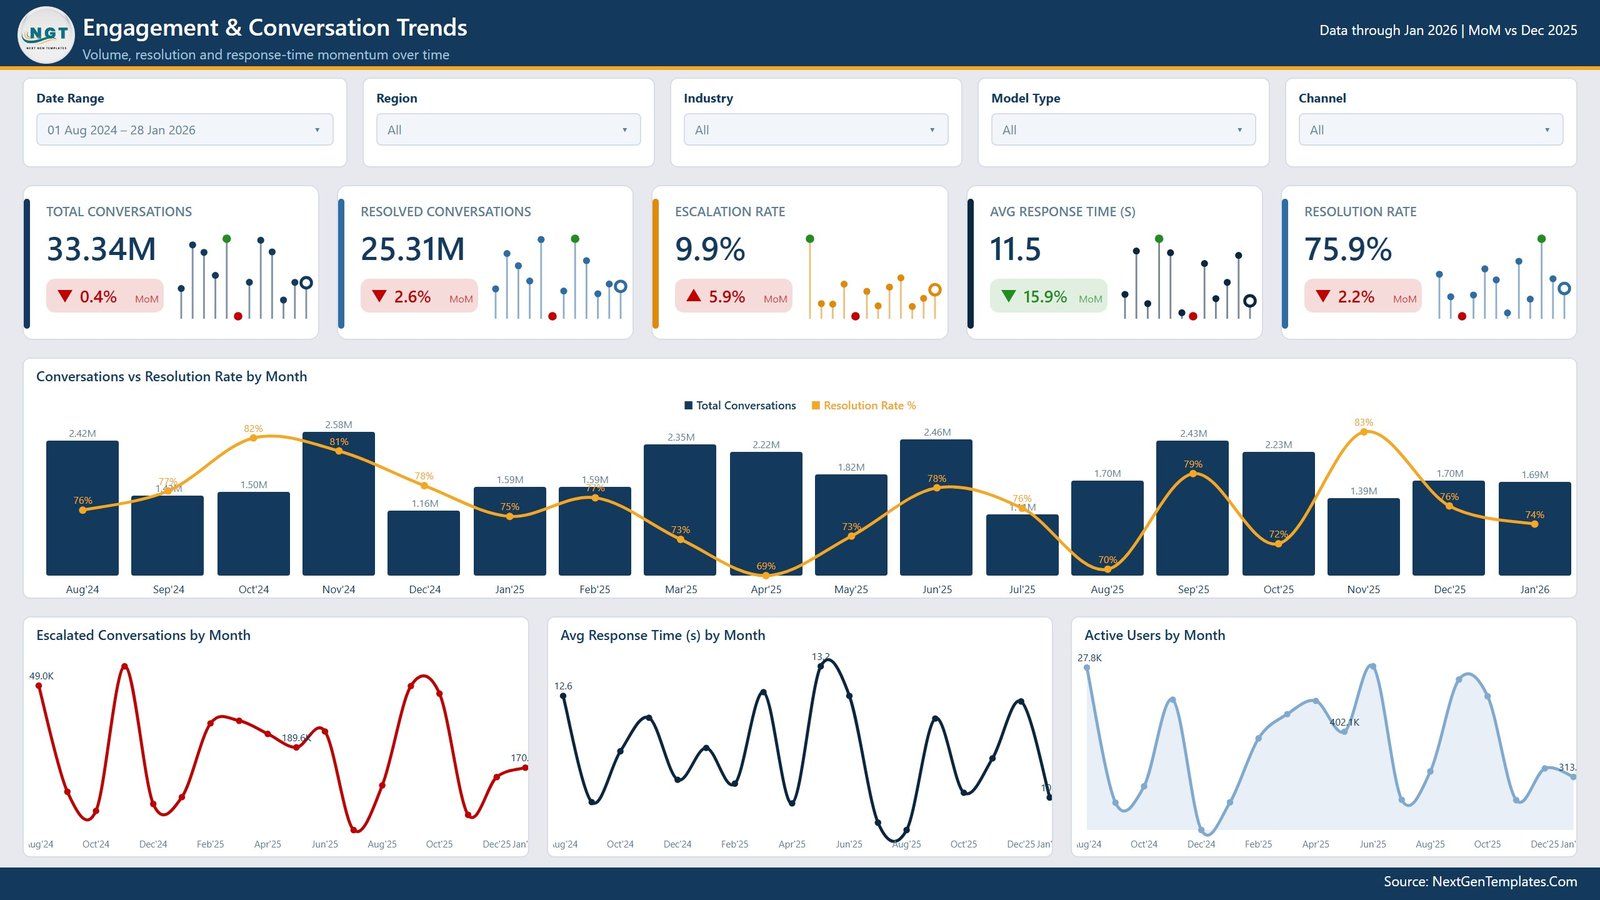
This page focuses on volume, resolution quality, escalation pressure, response time, and active user momentum. Cards show total conversations, resolved conversations, escalation rate, average response time, and resolution rate. The main chart compares conversations with resolution rate by month, while the lower visuals show escalated conversations, average response time, and active users month by month.
3. Provider Analysis
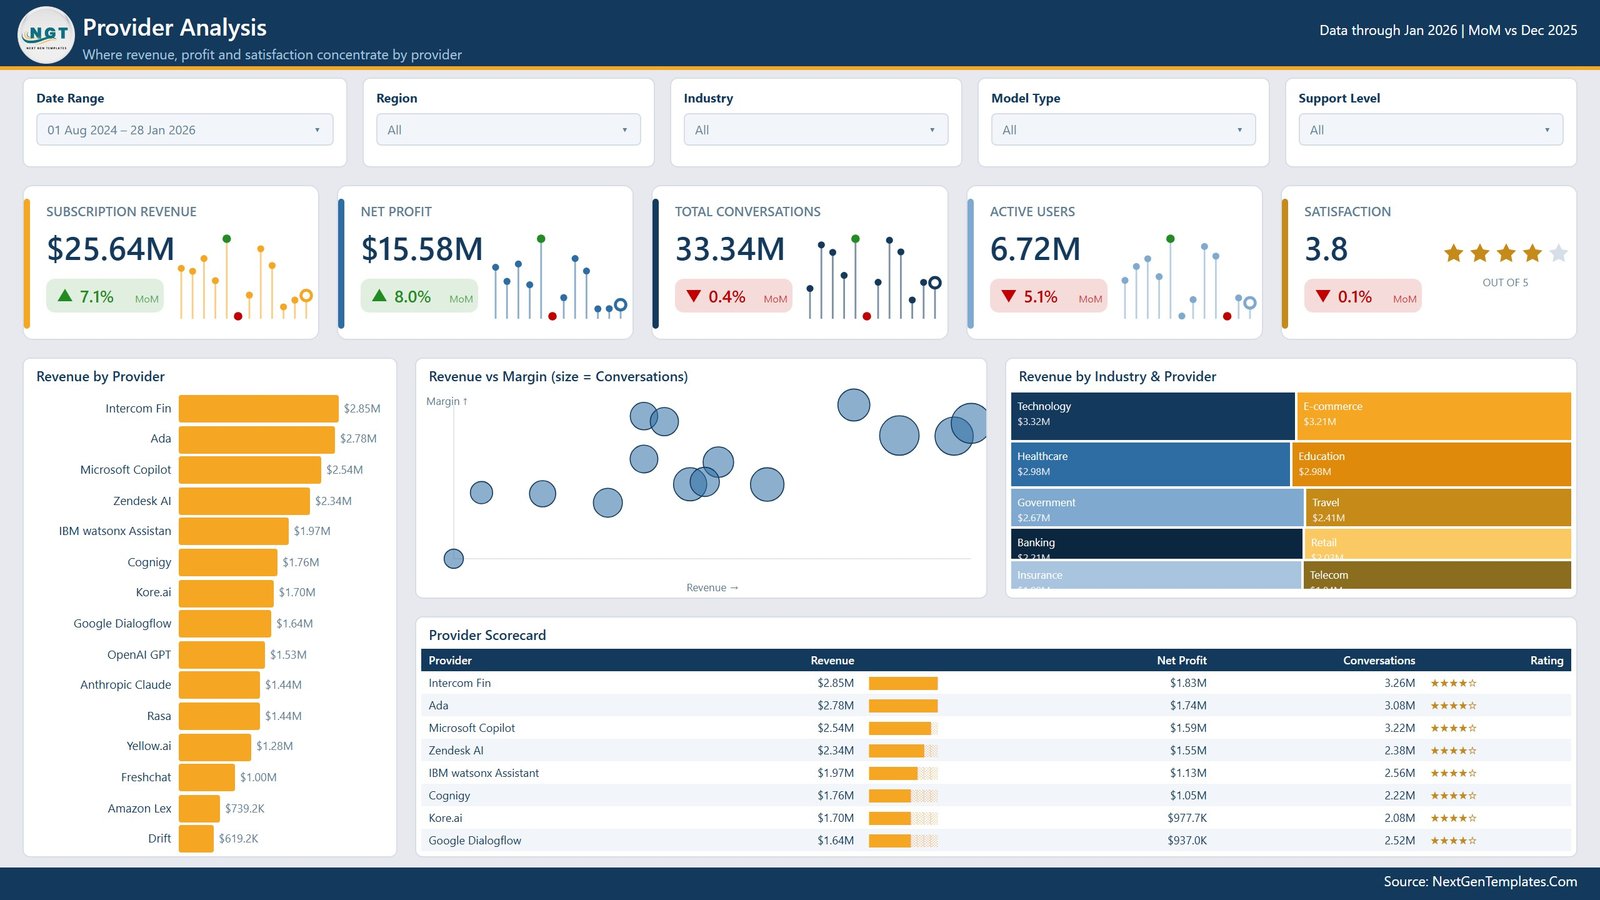
The Provider Analysis page shows where revenue, profit, active users, total conversations, and satisfaction are concentrated by chatbot provider. It compares revenue by provider, revenue against margin with conversation size, revenue by industry and provider, and a provider scorecard combining subscription revenue, net profit, conversations, and rating.
4. Revenue and Profitability Insights
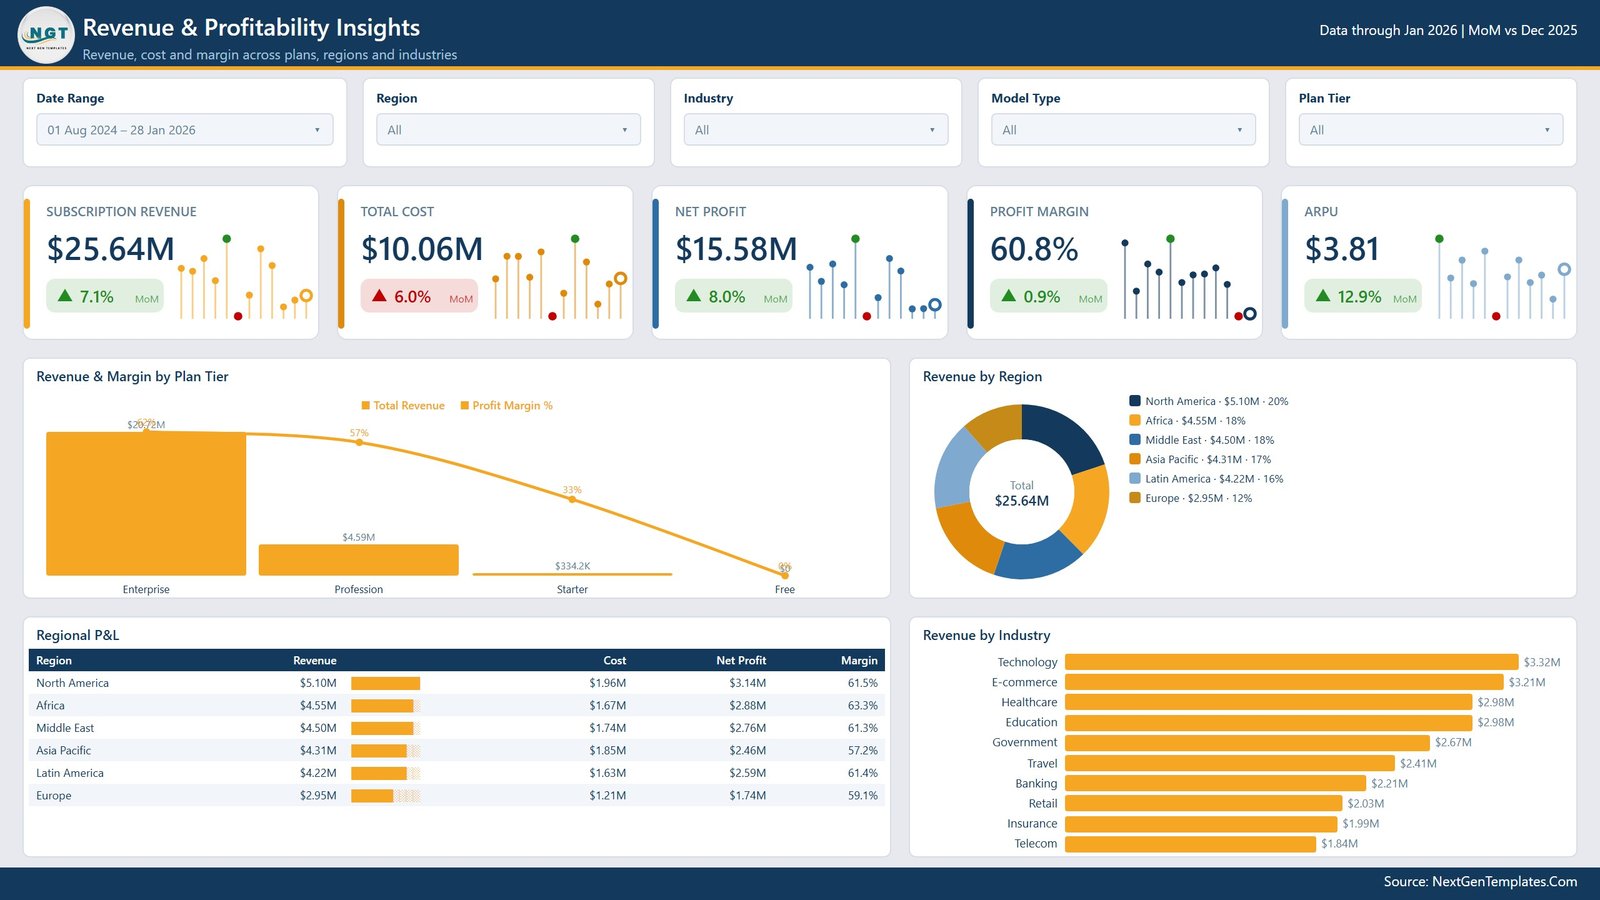
The Revenue and Profitability Insights page is built for finance, RevOps, and management review. Cards show subscription revenue, total cost, net profit, profit margin, and ARPU. The page breaks down revenue and margin by plan tier, revenue by region, regional profit and loss, and revenue by industry, helping users identify stronger and weaker profitability segments.
5. Operations and Channels
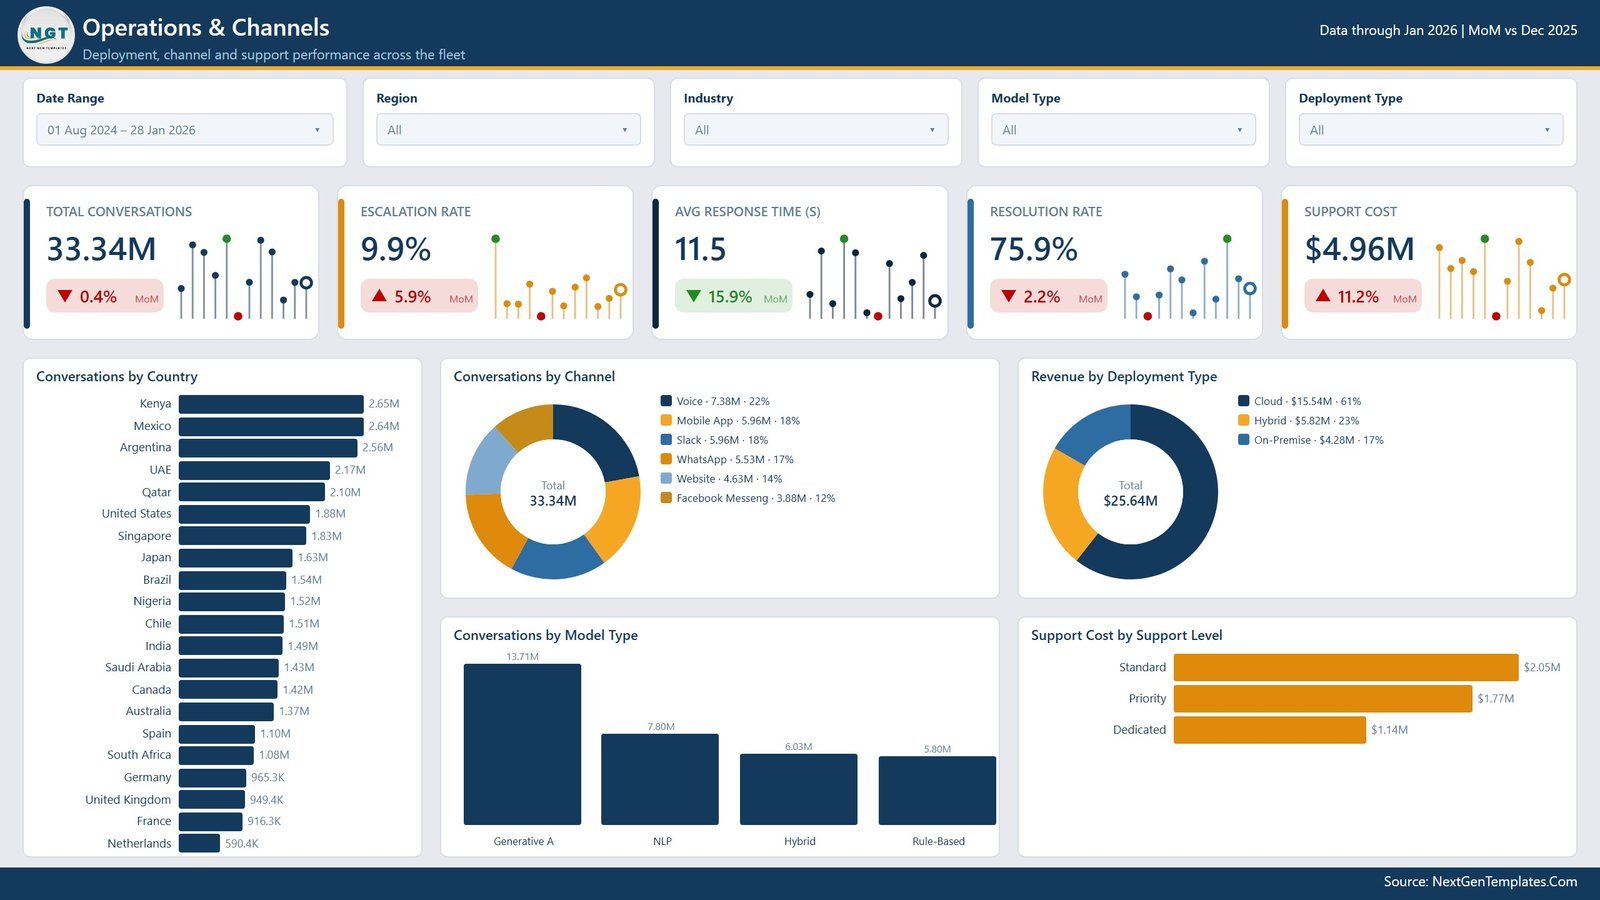
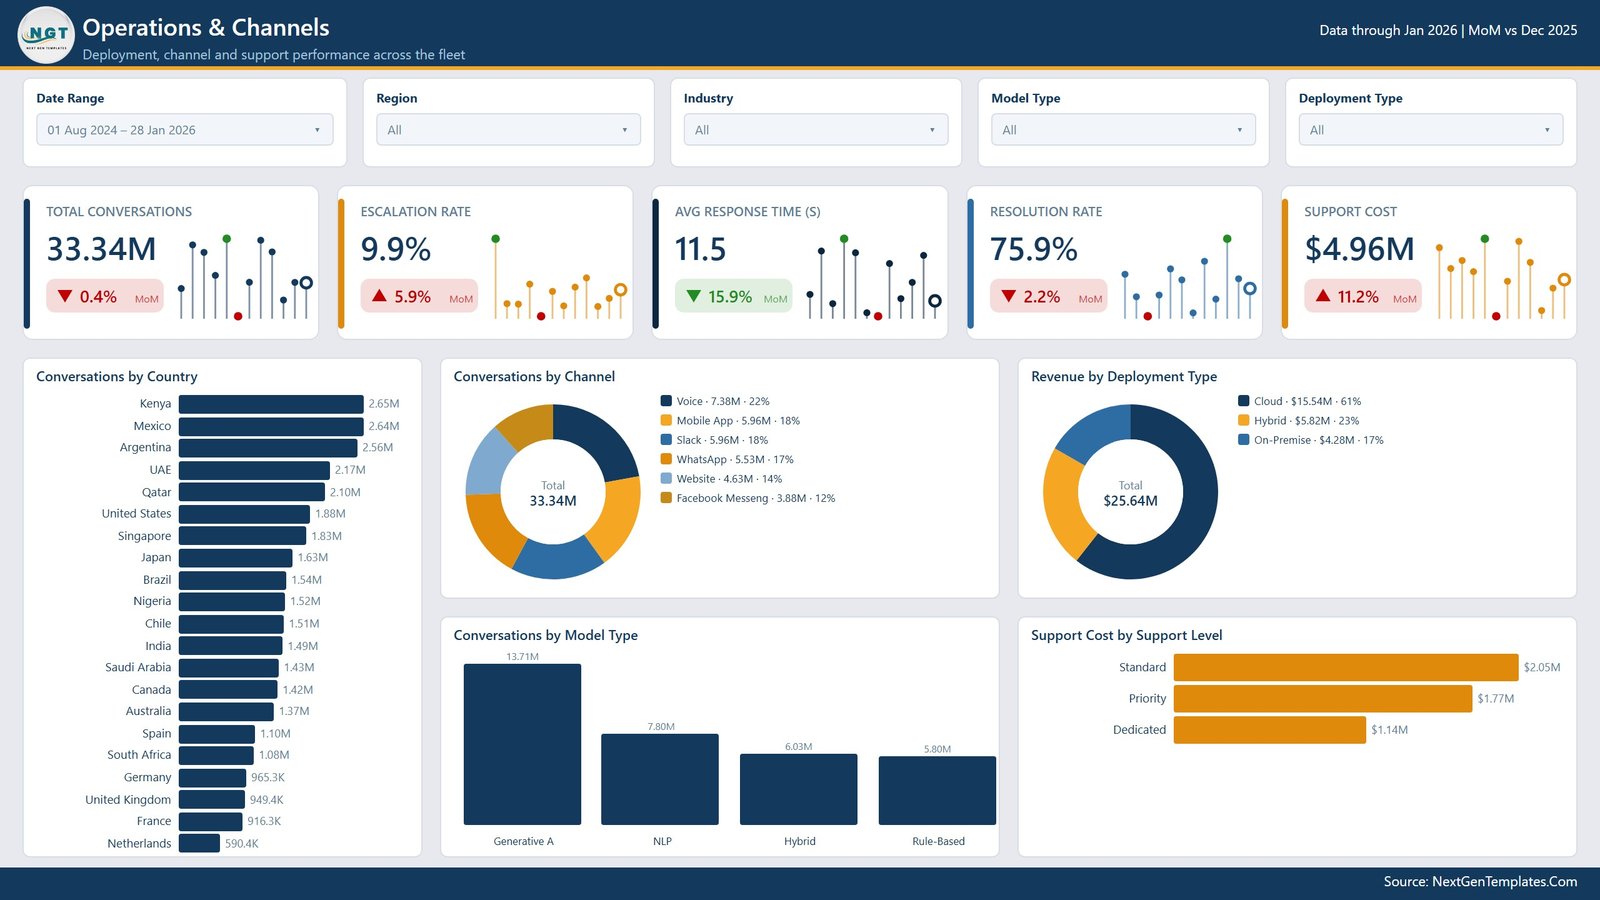
The Operations and Channels page monitors deployment, channel, and support performance across the chatbot fleet. KPI cards cover total conversations, escalation rate, average response time, resolution rate, and support cost. Visuals show conversations by country, channel, and model type, plus revenue by deployment type and support cost by support level.
AI Chatbot Providers Dashboard in Power BI vs. Tableau vs. Paid CRM/SaaS – Where This Fits
| Feature | This Power BI dashboard | Tableau alternative | Paid CRM/SaaS alternative |
|---|---|---|---|
| Cost | $17.99 one-time sale price | Requires Tableau licensing and build time | Recurring subscription or per-seat pricing |
| Platform | Microsoft Power BI Desktop | Tableau Desktop or Cloud | Vendor-hosted CRM, support, or chatbot platform |
| Setup time | Open PBIX, replace source data, and refresh | Manual dashboard design and modeling | Implementation, integration, and onboarding |
| Customizable fields | Editable visuals, model, measures, and pages | Editable if you build and own the workbook | Depends on vendor permissions |
| Year-1 cost at 5 users | Low template cost plus Microsoft licensing if published | Higher license and development cost | Often much higher due to subscriptions |
| Chatbot analytics | Revenue, conversations, resolution, escalation, CSAT, users, providers, industries, channels, model types, regions, and support cost | Must be built manually | Depends on reporting module depth |
Who This Template Is For – and Who It’s Not For
Best for: AI chatbot providers, SaaS teams, product managers, customer support leaders, RevOps analysts, implementation consultants, and BI analysts preparing recurring chatbot performance reviews.
Not for: teams needing a live chatbot engine, ticketing system, billing platform, CRM workflow, API monitoring platform, or model-training tool. This is a reporting dashboard for structured data, not an operational system.
How to Use the AI Chatbot Providers Dashboard in Power BI
- Download and unzip the product file.
- Open the PBIX file in Microsoft Power BI Desktop.
- Replace or map the sample source with your own chatbot provider data.
- Refresh the report and validate the cards, filters, and visuals.
- Use the 5 pages to review conversations, revenue, providers, profitability, channels, operations, and support quality.
- Publish to Power BI Service only after checking licensing, privacy, and sharing permissions.
Real-World Use Cases
Ananya, SaaS operations manager: compares subscription revenue, active users, and monthly conversations across chatbot providers before a leadership review.
Michael, support director: monitors escalation rate, response time, resolution rate, channel volume, and support cost to find where automation needs tuning.
Priya, AI consulting analyst: uses provider, region, plan tier, industry, and model type views to prepare client-facing chatbot performance reports.
Frequently Asked Questions
What software do I need?
You need Microsoft Power BI Desktop to open and edit the PBIX file.
What does this dashboard track?
It tracks conversations, subscription revenue, resolution rate, active users, satisfaction, escalation rate, response time, total cost, net profit, profit margin, ARPU, providers, regions, industries, channels, model types, plan tiers, countries, deployment types, and support levels.
Can I use my own chatbot provider data?
Yes. Replace the sample source with your own structured data and refresh the report.
Can I customize the report?
Yes. You can edit pages, visuals, fields, measures, filters, colors, and the data model in Power BI Desktop.
Is this a chatbot platform?
No. It is a Power BI reporting dashboard, not a chatbot engine, help desk, CRM, or billing system.
Can I publish it to Power BI Service?
Yes, if you have the required Microsoft licensing and have reviewed source data privacy and sharing permissions.
About the Author
Built by PK – Microsoft Certified Professional with 15+ years of Excel, Google Sheets, and Power BI experience. Founder of NextGenTemplates, reaching 300K+ subscribers across YouTube channels. Every template is hand-built and tested before release.
Explore Related Templates
Pair this dashboard with AI Chatbot Providers Dashboard in Excel, Cloud Hosting Dashboard in Power BI, and DevOps Dashboard in Power BI. Browse more Power BI dashboard templates and Power BI templates.
Read the full blog post for the AI Chatbot Providers Dashboard in Power BI.
Download the AI Chatbot Providers Dashboard in Power BI to review chatbot conversations, revenue, providers, profitability, channels, operations, and support quality in one editable PBIX report.
Last updated: August 11, 2026.





























Reviews
There are no reviews yet.