

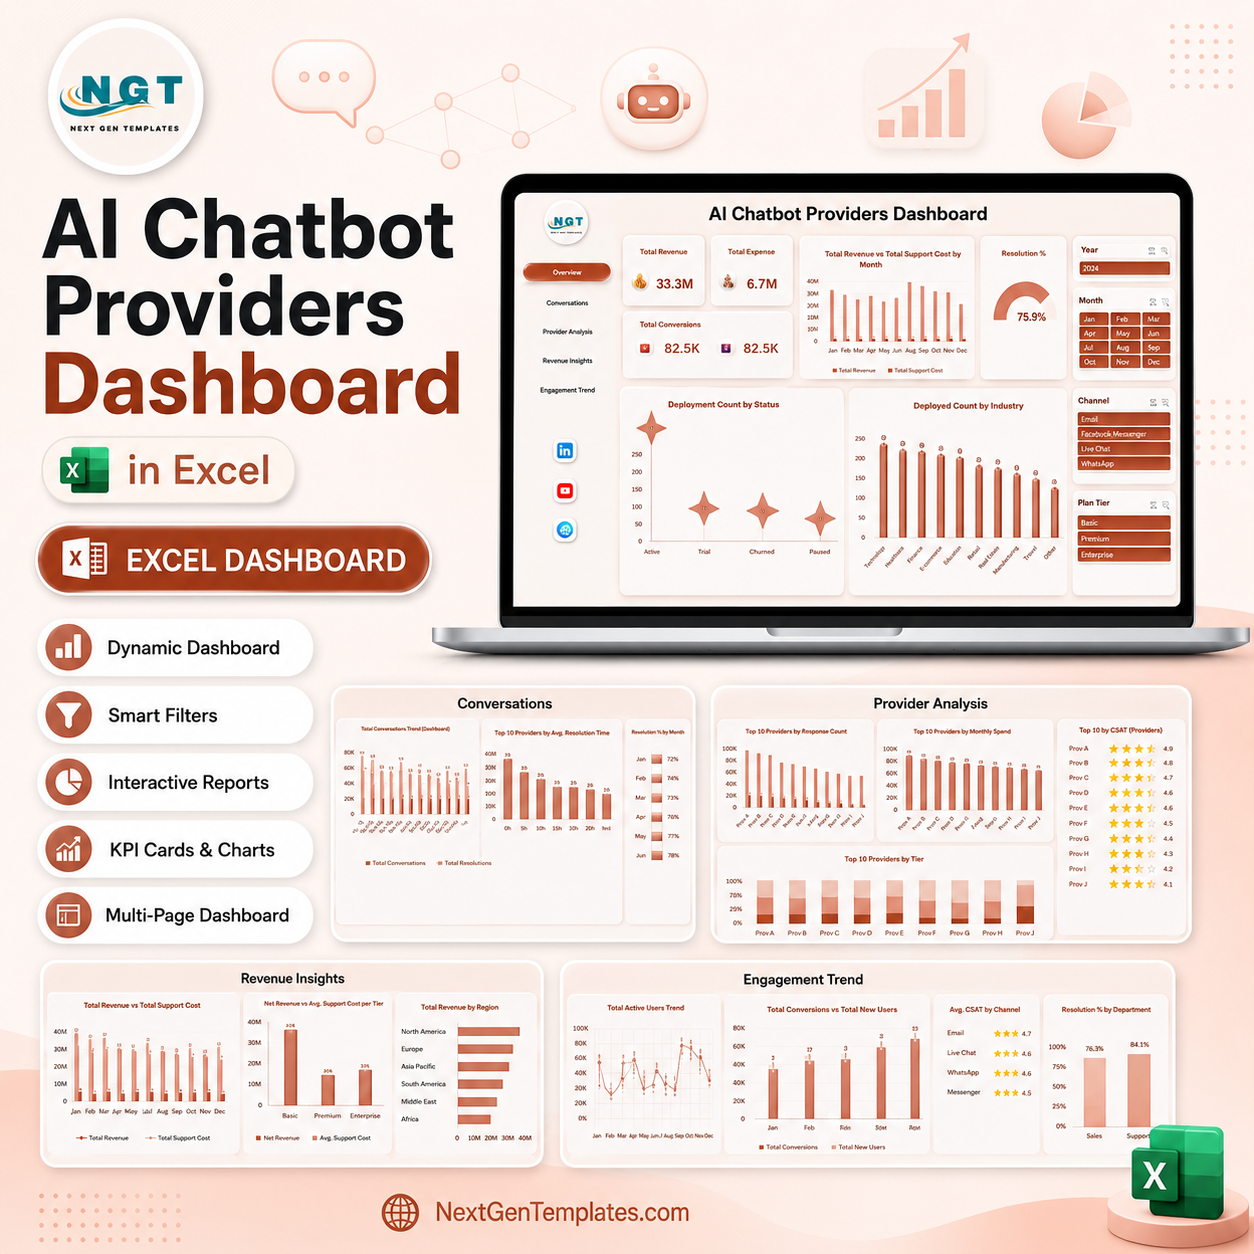
AI Chatbot Providers Dashboard in Excel is a ready-to-use reporting workbook for AI product teams, SaaS companies, customer support leaders, RevOps analysts, and consultants who need one place to monitor chatbot provider performance. Chatbot programs can produce thousands of conversations across providers, channels, industries, regions, model types, plan tiers, and support levels. This Excel dashboard brings those moving parts into 5 pages with KPI cards, slicers, and charts so you can review revenue, support cost, resolution, escalation, CSAT, active users, and engagement trends without building every visual from scratch. It is an instant-download Excel template with a one-time price and a practical reporting structure you can adapt.
Key Features of AI Chatbot Providers Dashboard in Excel
- 5 Excel dashboard pages: Overview, Conversations, Provider Analysis, Revenue Insights, and Engagement Trend.
- Top KPI cards for Total Revenue, Total Support Cost, Total Conversations, and Total Active Users.
- Monthly revenue and support cost comparison to monitor profitability pressure.
- Resolution, escalation, CSAT, channel, model type, provider, industry, region, plan tier, and support-level analysis.
- Interactive slicers for quick filtering and focused performance review.
- Editable Excel workbook structure that can be customized for your own chatbot provider data.
What’s Inside the AI Chatbot Providers Dashboard in Excel
The Overview page summarizes the business with Total Revenue, Total Support Cost, Total Conversations, and Total Active Users. It includes charts for Total Revenue vs Total Support Cost by Month, Resolution %, Deployment Count by Status, and Deployment Count by Industry. These visuals help leadership understand financial scale, rollout status, and adoption patterns quickly.
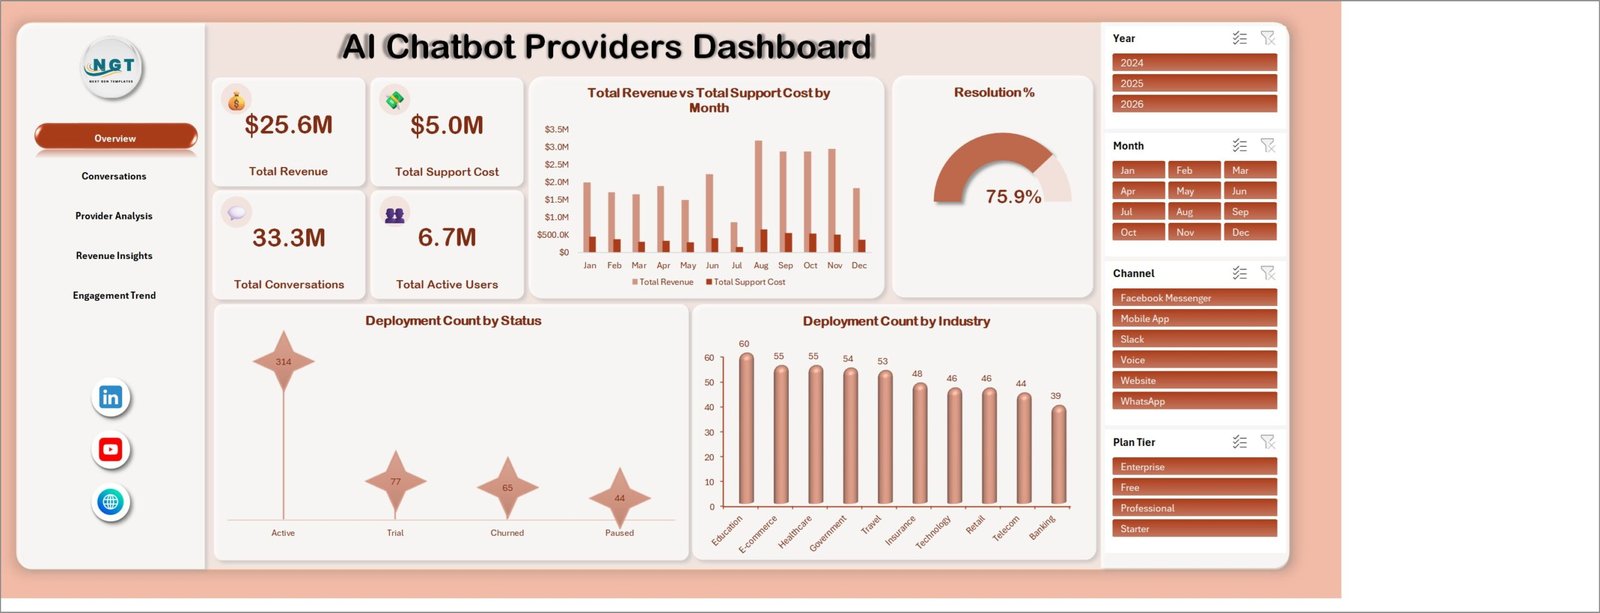
AI Chatbot Providers Dashboard
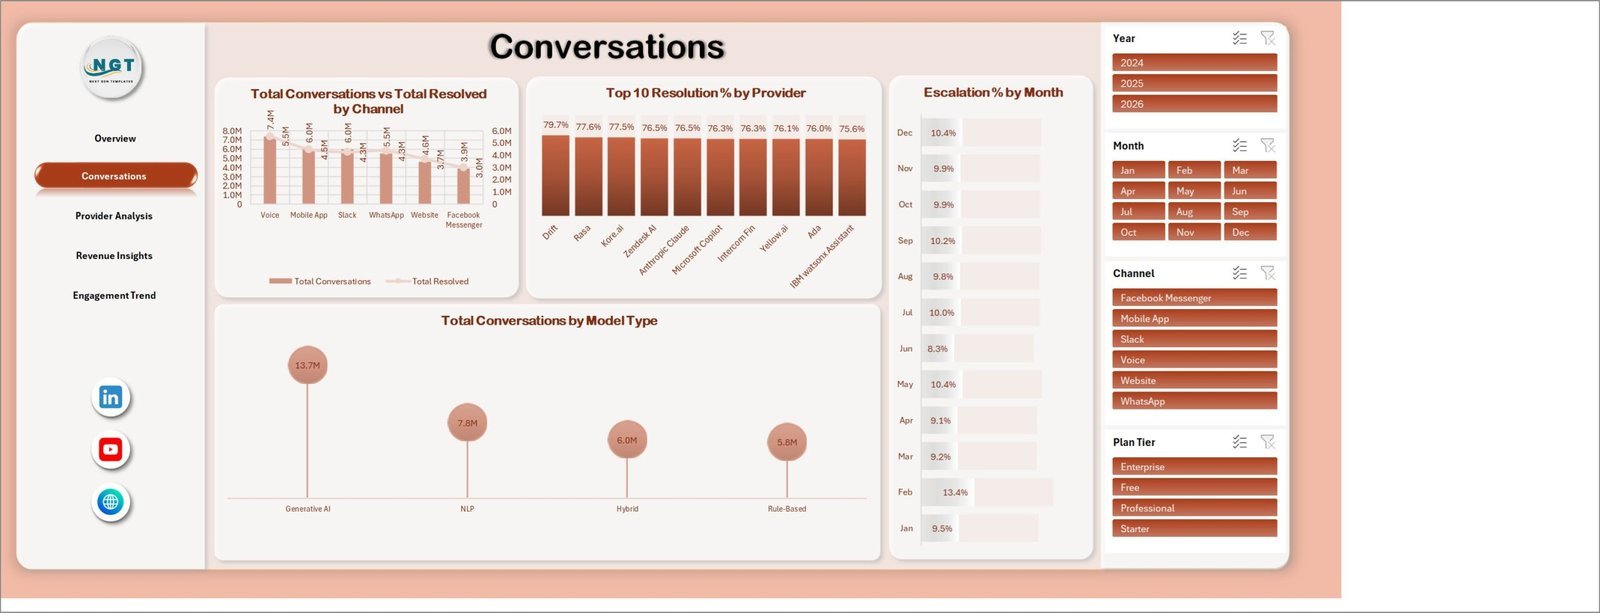
The Conversations page analyzes Total Conversations vs Total Resolved by Channel, Resolution % by Provider, Escalation % by Month, and Total Conversations by Model Type. This page is ideal for support teams that want to know whether chatbot traffic is being handled effectively.
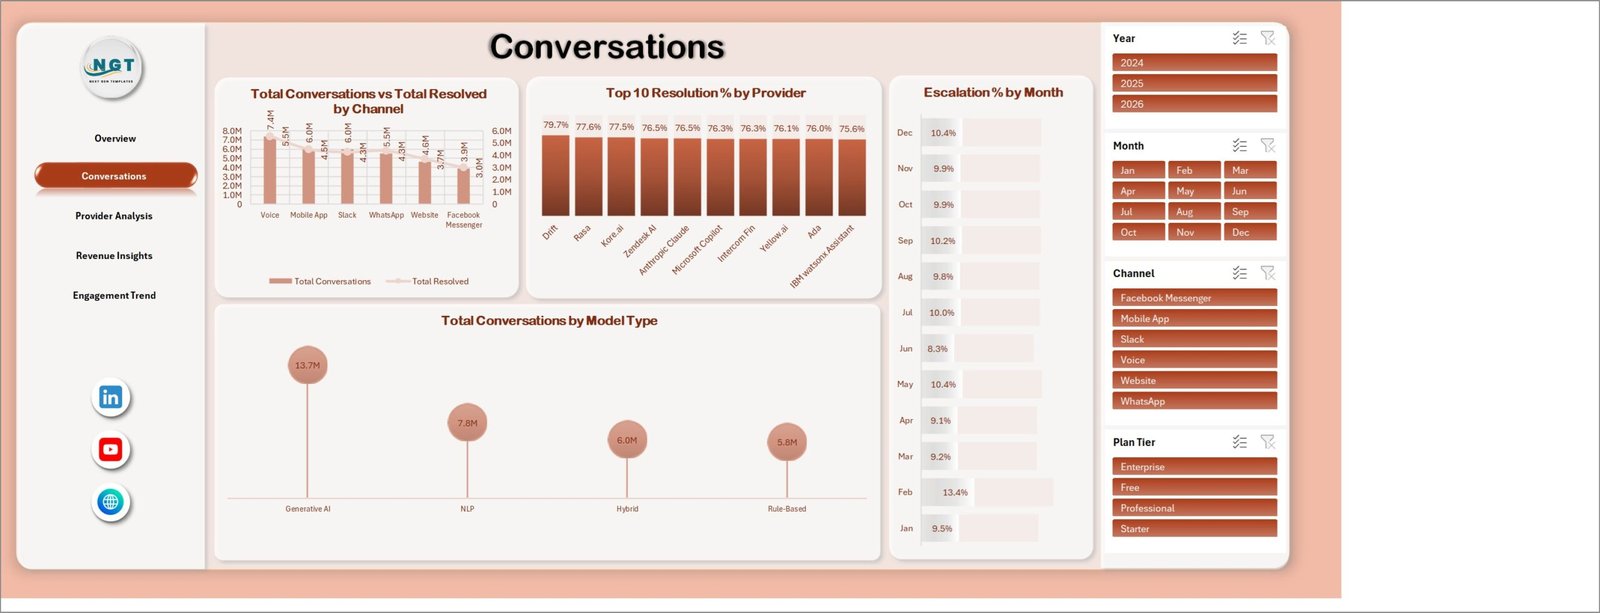
Conversations
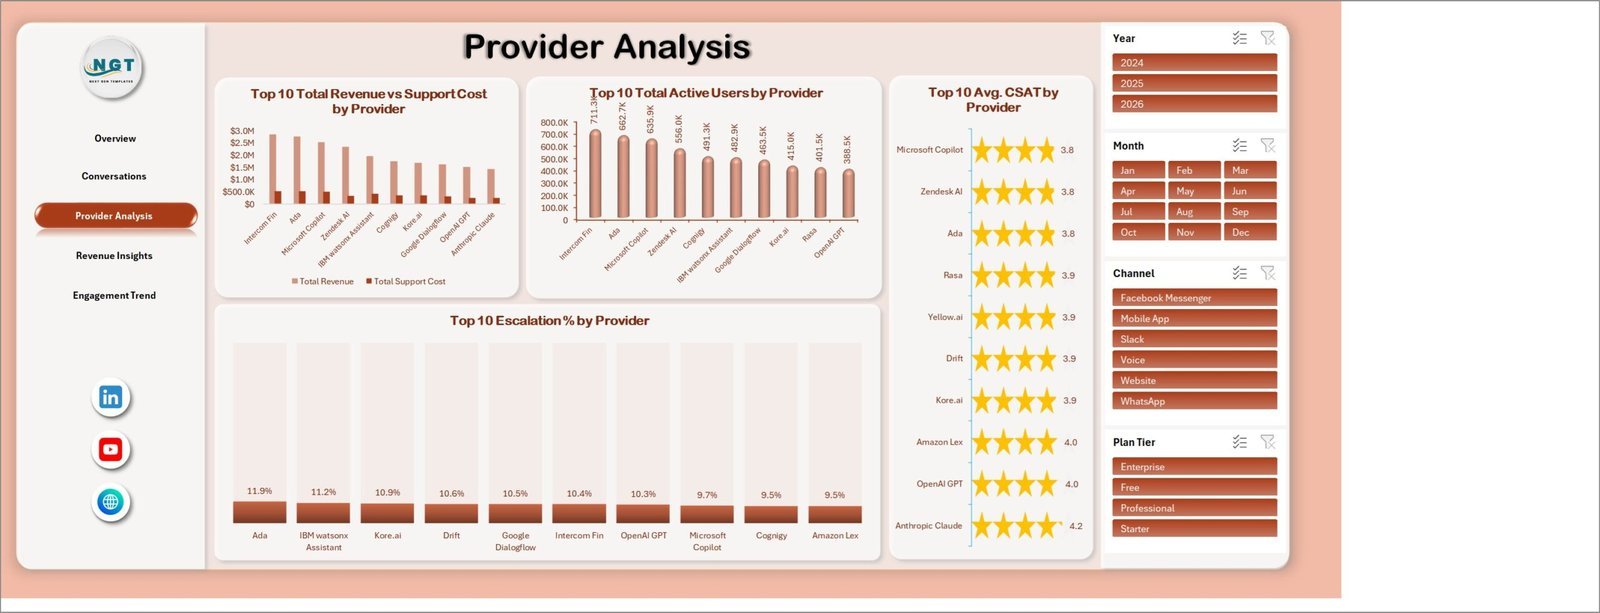
The Provider Analysis page compares Total Revenue vs Support Cost by Provider, Total Active Users by Provider, Avg. CSAT by Provider, and Escalation % by Provider. It helps teams identify which chatbot providers deliver the best mix of revenue, adoption, satisfaction, and automation quality.
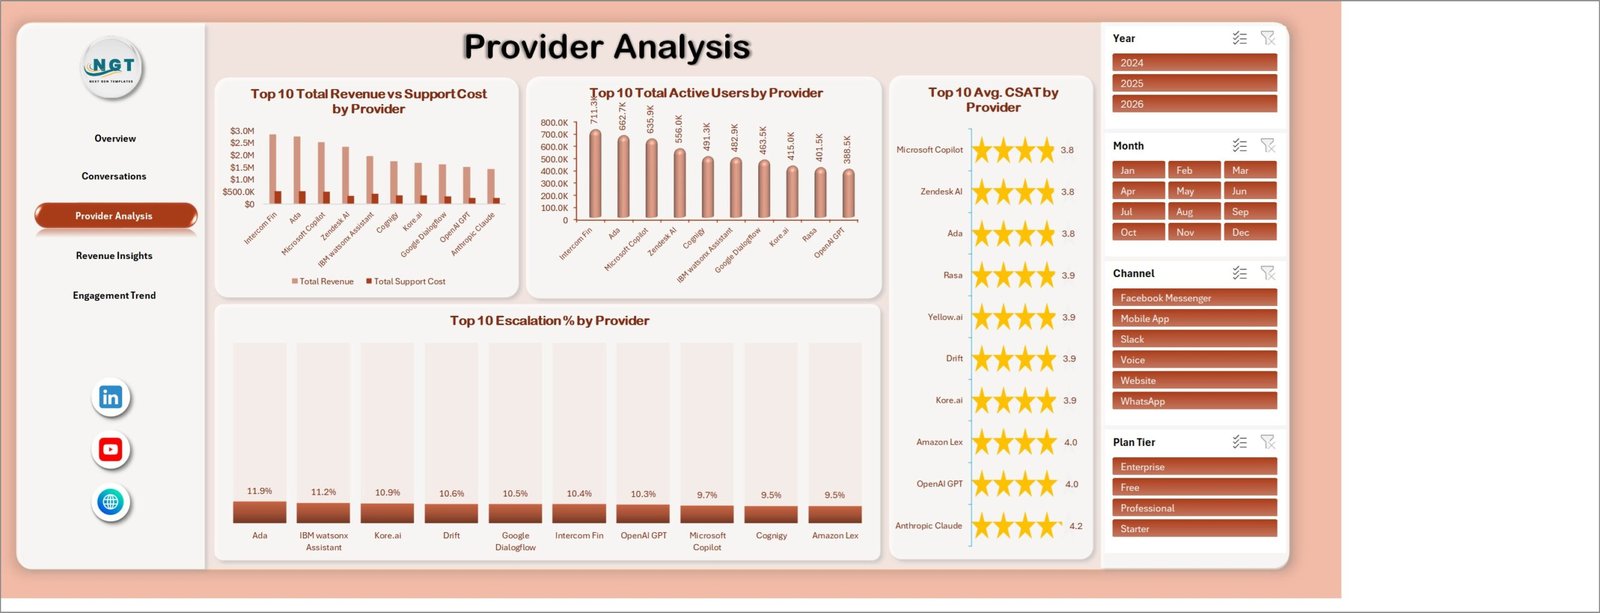
Provider Analysis
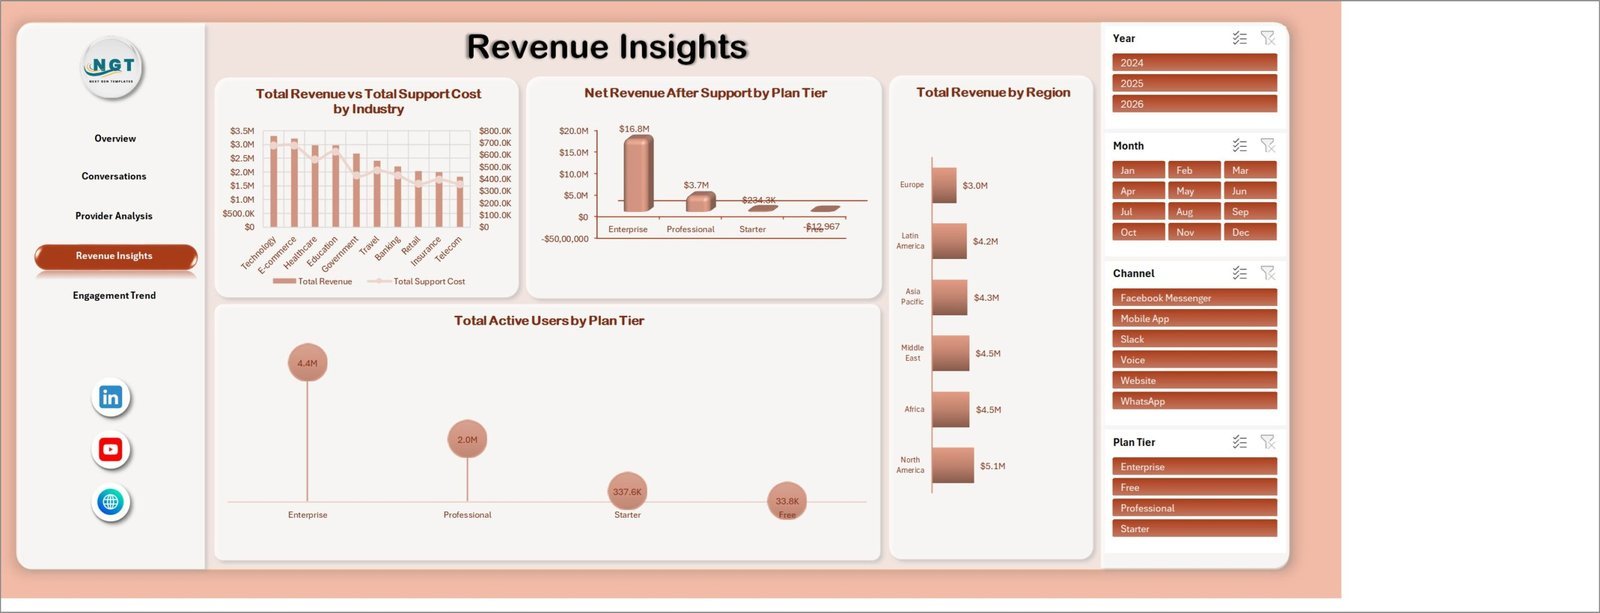
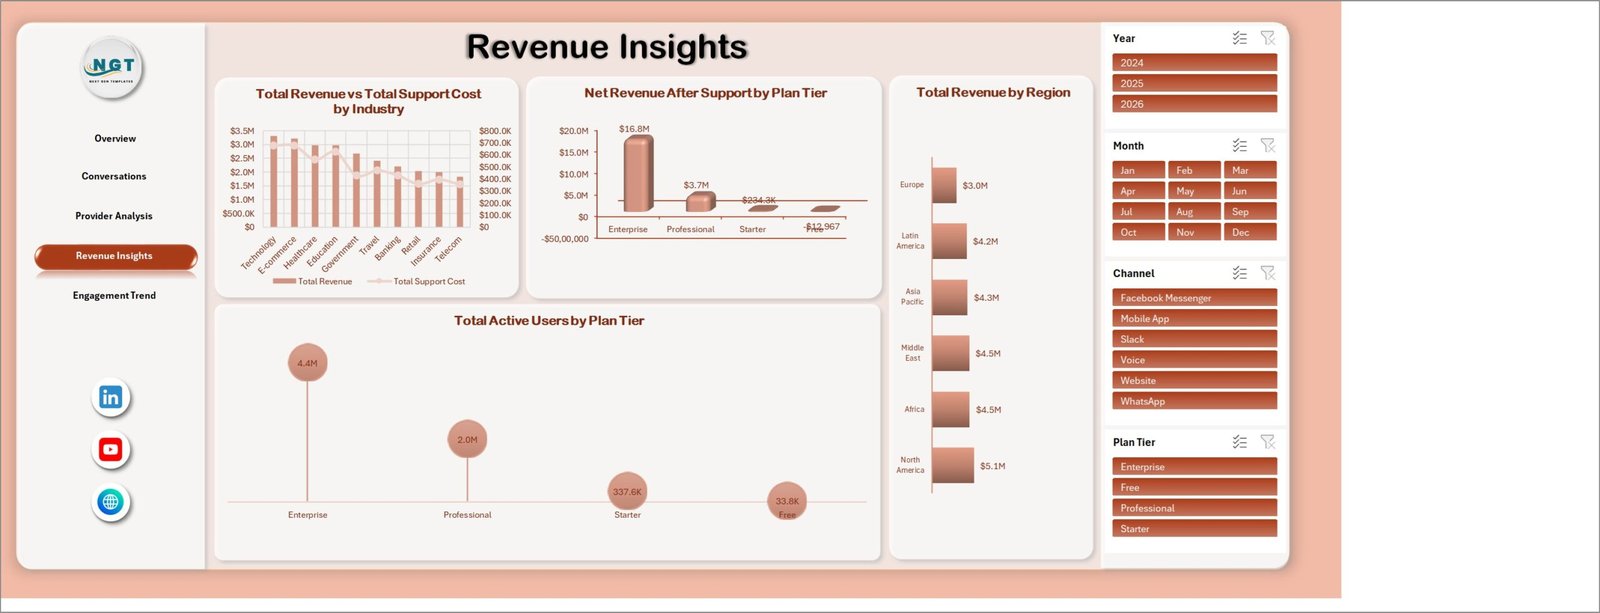
The Revenue Insights page includes Total Revenue vs Total Support Cost by Industry, Net Revenue After Support by Plan Tier, Total Revenue by Region, and Total Active Users by Plan Tier. Finance, sales, and customer success teams can use this page to connect usage with commercial performance.
Revenue Insights
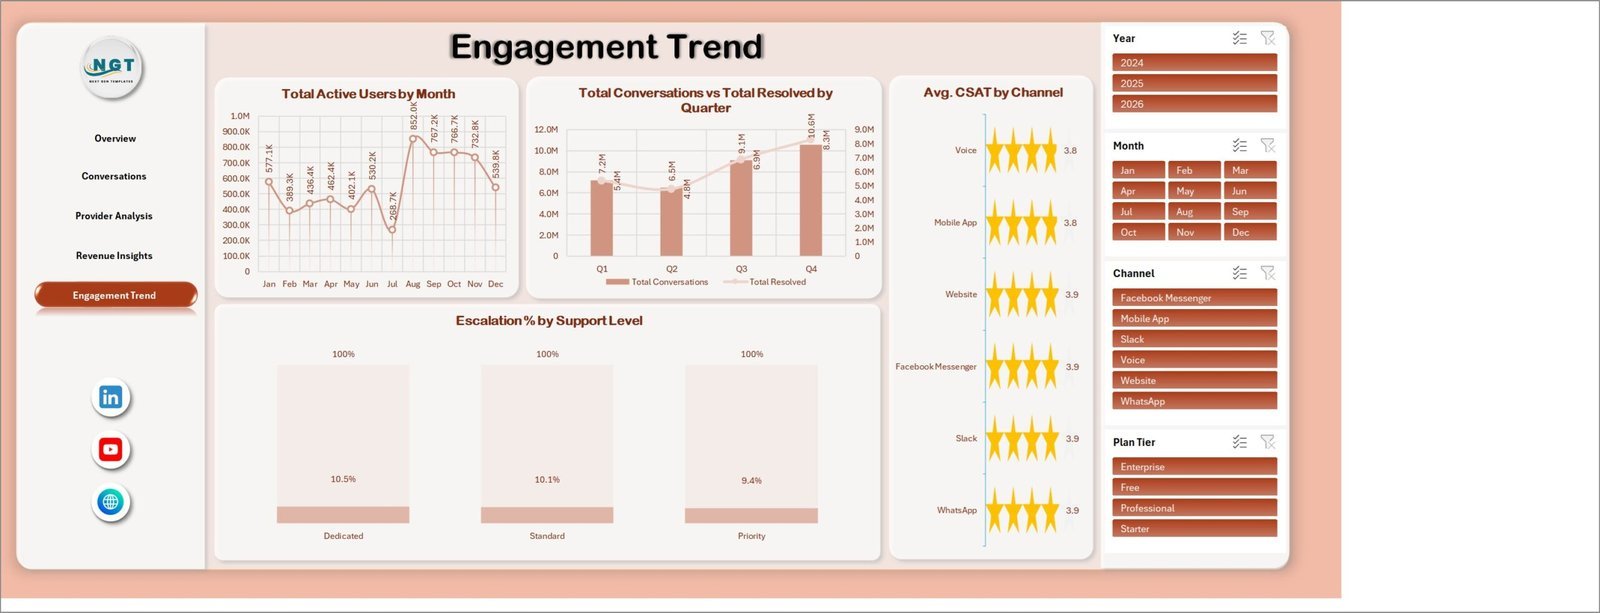
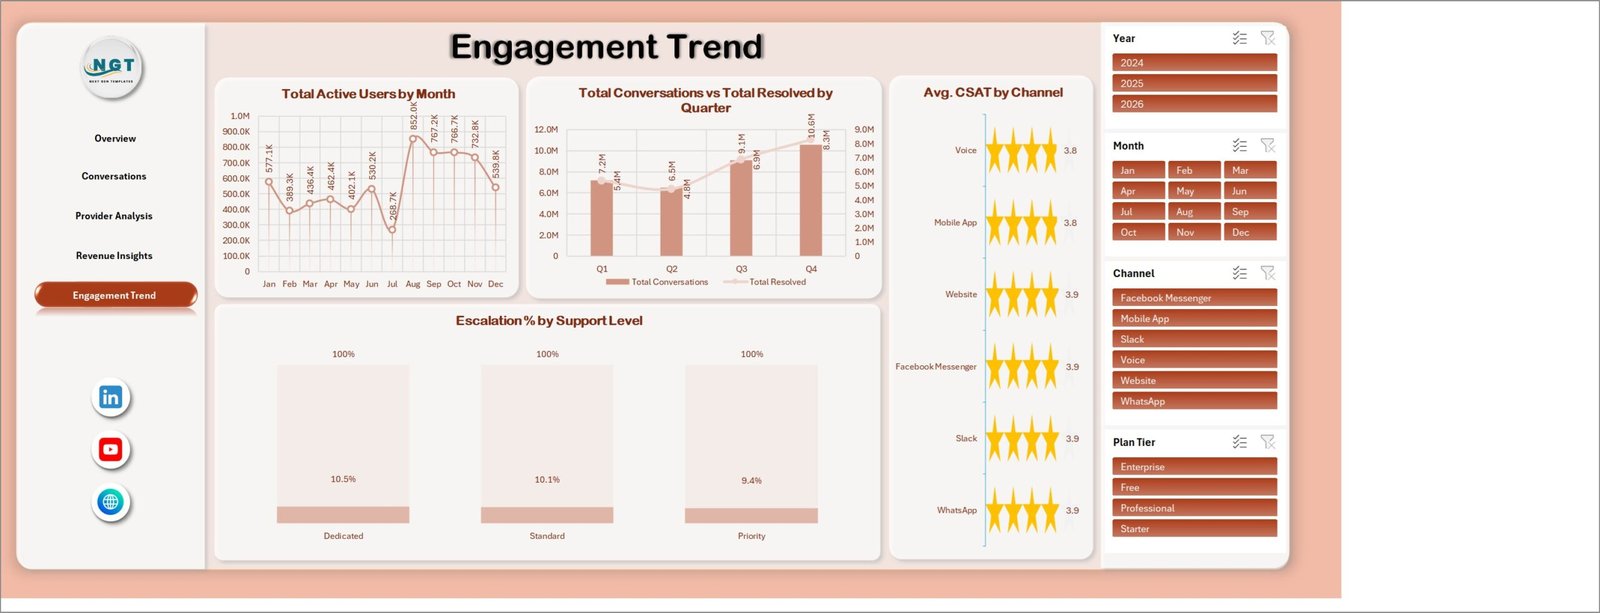
The Engagement Trend page tracks Total Active Users by Month, Total Conversations vs Total Resolved by Quarter, Avg. CSAT by Channel, and Escalation % by Support Level. This page helps teams review adoption, service quality, and escalation movement over time.
Engagement Trend
AI Chatbot Providers Dashboard in Excel vs. Google Sheets vs. Paid CRM/SaaS – Where This Fits
This template sits between a manually built spreadsheet and a paid SaaS reporting platform. Google Sheets can be useful for collaboration, but the dashboard structure and charts must usually be built manually. Paid CRM or customer support analytics platforms can offer live integrations, but they often require recurring subscriptions, onboarding, and platform-specific configuration. This Excel dashboard is best when you want a lower-cost, editable, offline-friendly reporting workbook for structured chatbot data.
Who This Template Is For – and Who It’s Not For
Use this template if you manage AI chatbot performance, support automation, provider comparisons, chatbot revenue reporting, customer engagement reporting, or internal dashboard reviews. It is a good fit for SaaS teams, AI consultants, support managers, product managers, and analysts who already have exportable chatbot data.
It is not a live chatbot platform, help desk, CRM, ticketing system, billing engine, API monitor, or model-training tool. If you need real-time operational monitoring with direct platform connections, a BI platform or SaaS analytics system may be a better fit.
How to Use the AI Chatbot Providers Dashboard in Excel
- Download and unzip the product file.
- Open the workbook in Microsoft Excel.
- Replace the sample chatbot provider data with your own structured records.
- Refresh the workbook tables, charts, and slicers.
- Use the 5 dashboard pages to review provider, revenue, conversation, support, and engagement performance.
Real-World Use Cases
Ananya, SaaS operations manager: She compares monthly support cost and chatbot revenue across providers before a leadership review.
Michael, support director: He checks channel-level conversations, resolution rate, escalation percentage, and CSAT to decide where chatbot flows need improvement.
Priya, AI consultant: She uses the provider, industry, plan tier, and region views to prepare client-facing chatbot performance reports.
Frequently Asked Questions
What does this Excel dashboard track?
It tracks revenue, support cost, conversations, resolved conversations, active users, resolution percentage, escalation percentage, CSAT, deployment status, industry, provider, region, channel, model type, plan tier, and support level.
How many pages are included?
The workbook includes 5 dashboard pages: Overview, Conversations, Provider Analysis, Revenue Insights, and Engagement Trend.
Can I use my own chatbot data?
Yes. Replace the sample data with your own records and refresh the workbook.
Can I customize the template?
Yes. You can edit charts, slicers, formulas, fields, and layout inside Excel.
Does it replace a chatbot or CRM platform?
No. It is an analytics dashboard, not a chatbot engine, ticketing system, or CRM.
Do I need a subscription?
No subscription is required for the template itself. Microsoft Excel is required to use the workbook.
About the Author
Built by PK – Microsoft Certified Professional with 15+ years of Excel, Google Sheets, and Power BI experience. Founder of NextGenTemplates, reaching 300K+ subscribers across YouTube channels. Every template is hand-built and tested before release.
Explore Related Templates
Browse more Excel Dashboard templates and the full MS Excel template collection on NextGenTemplates.
Download the AI Chatbot Providers Dashboard in Excel today and turn your chatbot provider data into a clear Excel reporting view.






























Reviews
There are no reviews yet.