


Freight Insurance Providers Dashboard in Excel helps insurance, logistics, and risk teams track premiums, claims, policy status, provider rating, freight lanes, cargo risk, and shipment coverage from one editable Excel workbook. Instead of building insurance reports manually across policy files, shipment logs, and claims sheets, this dashboard gives you 5 analysis pages, 5 executive KPI cards, slicers, charts, a structured Data Sheet, and a Support Sheet powered by pivot tables. Join 8,400+ teams using NextGenTemplates to replace recurring dashboard software with one-time, editable templates. Instant download, lifetime file access, and a simple risk-reversal: review the structure, replace the sample data, and adapt it to your reporting workflow.
Key Features of Freight Insurance Providers Dashboard in Excel
- Executive KPI cards: Total Premium, Total Claim Amount, Claim Frequency %, Total Policy Records, and Avg. Provider Rating.
- 5 dashboard pages: Overview Page, Premium Trend, Provider Review, Risk Claims, and Lane Insights.
- Interactive slicers: Filter the dashboard quickly by relevant source fields such as month, year, provider, region, cargo type, freight lane, policy status, coverage type, and client segment.
- Pivot-driven design: Update the Data Sheet, refresh all pivots, and charts update automatically.
- Insurance and logistics views: Analyze premium movement, provider performance, claims, loss ratio, cargo type risk, lane profitability, and regional exposure.
- Excel-native file: Customize formulas, charts, labels, colors, slicers, and source fields directly in Microsoft Excel.
What’s Inside the Freight Insurance Providers Dashboard in Excel
The workbook includes dashboard pages for premium, claims, provider, freight lane, cargo, and regional insurance analysis. The Overview Page starts with high-level cards for Total Premium, Total Claim Amount, Claim Frequency %, Total Policy Records, and Avg. Provider Rating. It also includes charts for Total Premium by Month, Total Premium by Year, Total Policy Records by Policy Status, and Total Claim Amount by Provider.
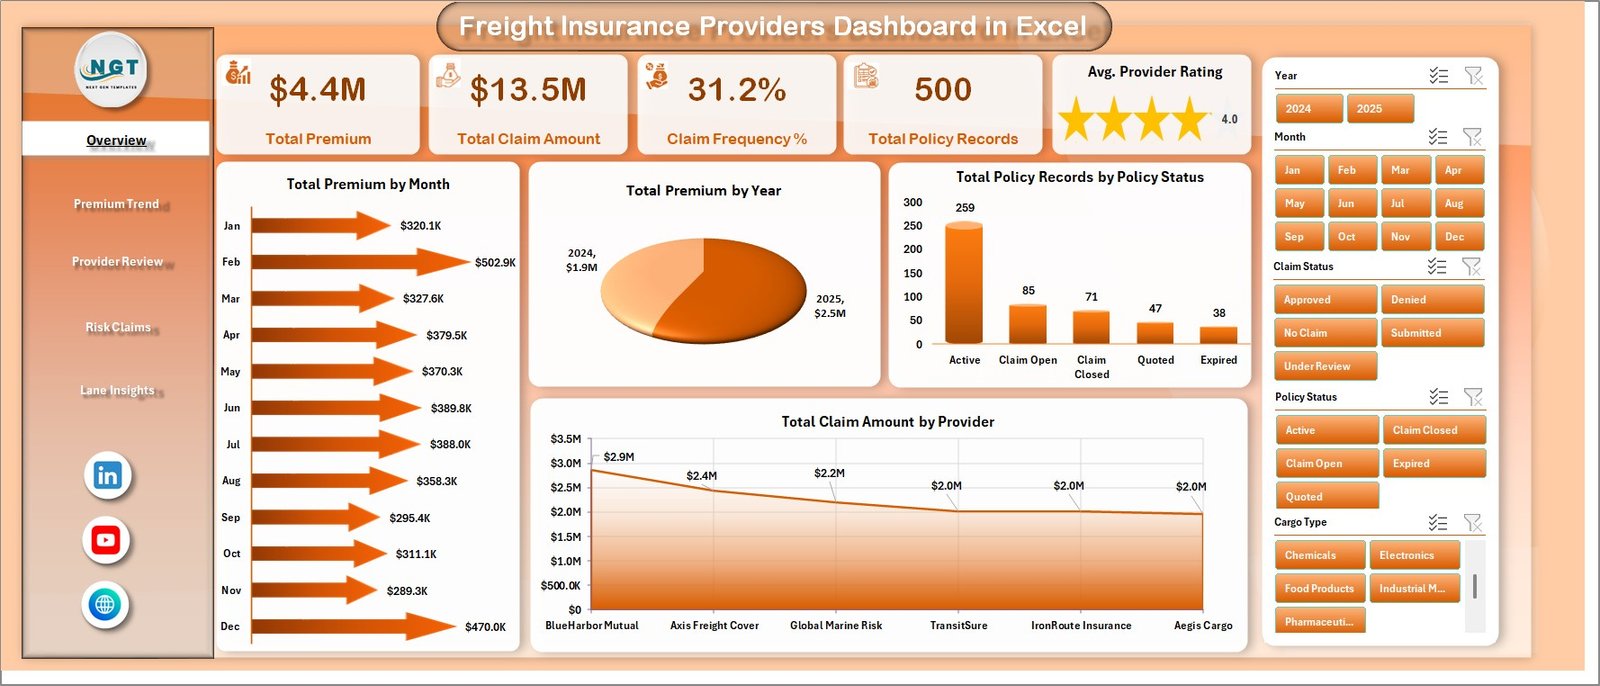
Freight Insurance Providers Dashboard in Excel
The Premium Trend page shows Total Premium by Quarter, Total Shipments by Month, Total Premium by Coverage Type, and Total Premium by Provider. These views help teams review seasonality, coverage mix, and provider-level premium contribution.
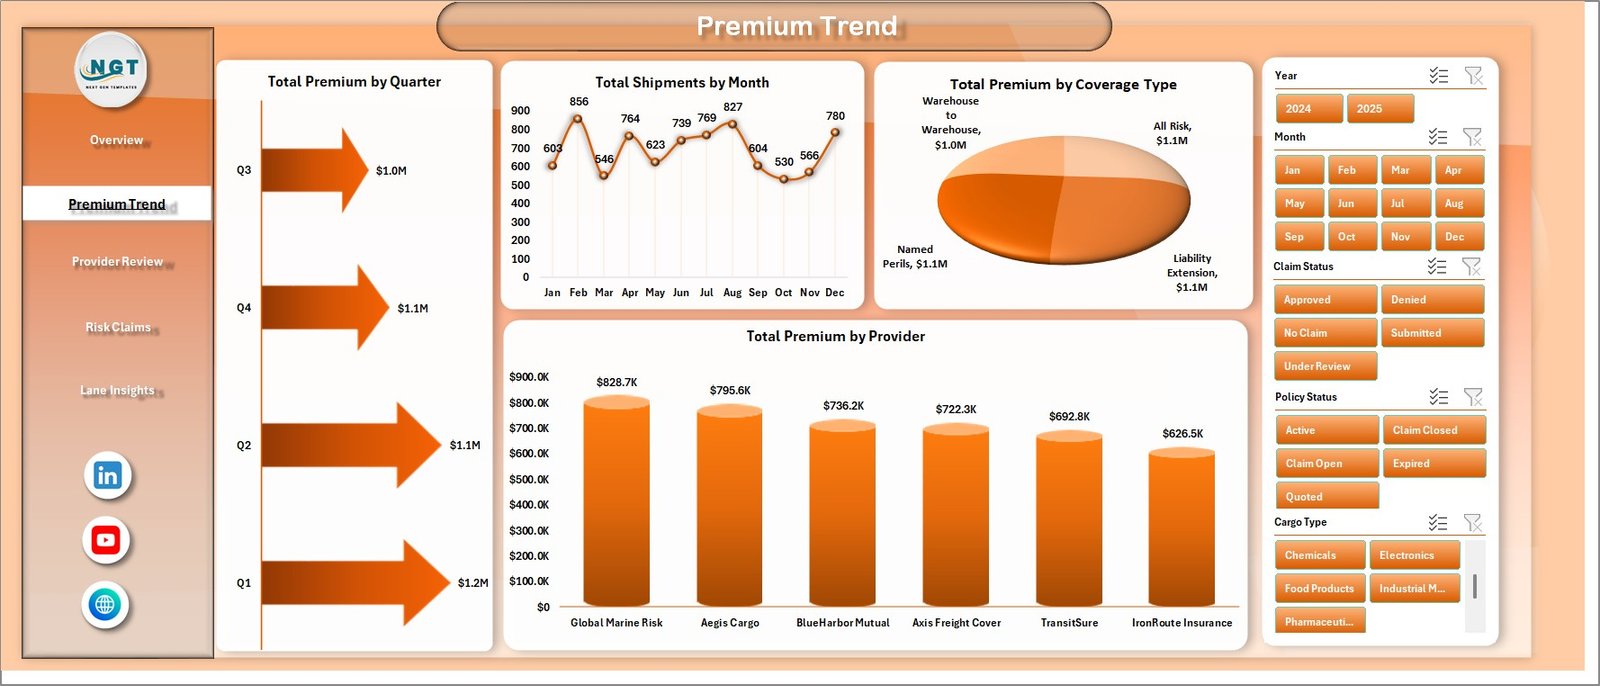
Premium Trend
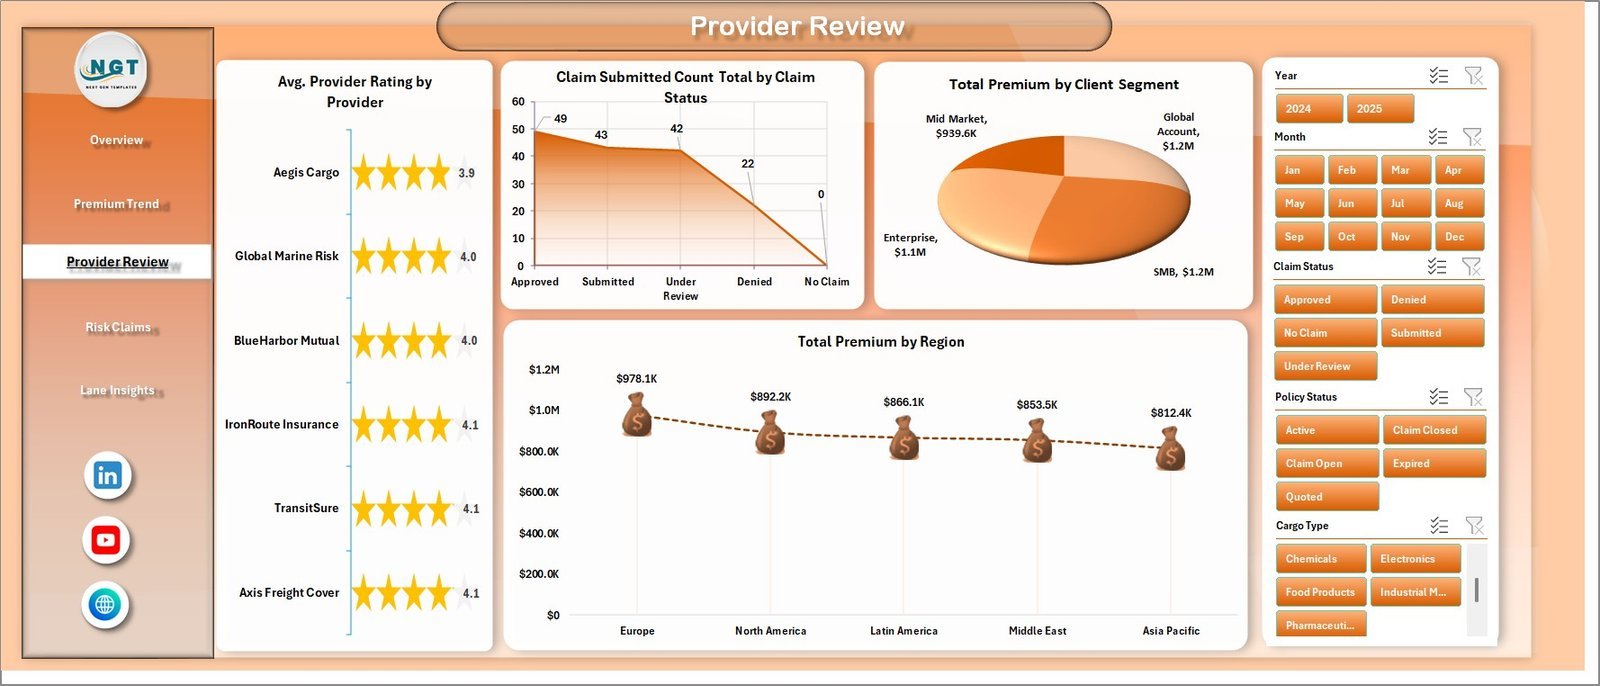
The Provider Review page compares Avg. Provider Rating by Provider, Claim Submitted Count Total by Claim Status, Total Premium by Client Segment, and Total Premium by Region. It is useful for vendor review, underwriting discussion, and client-segment reporting.

Provider Review
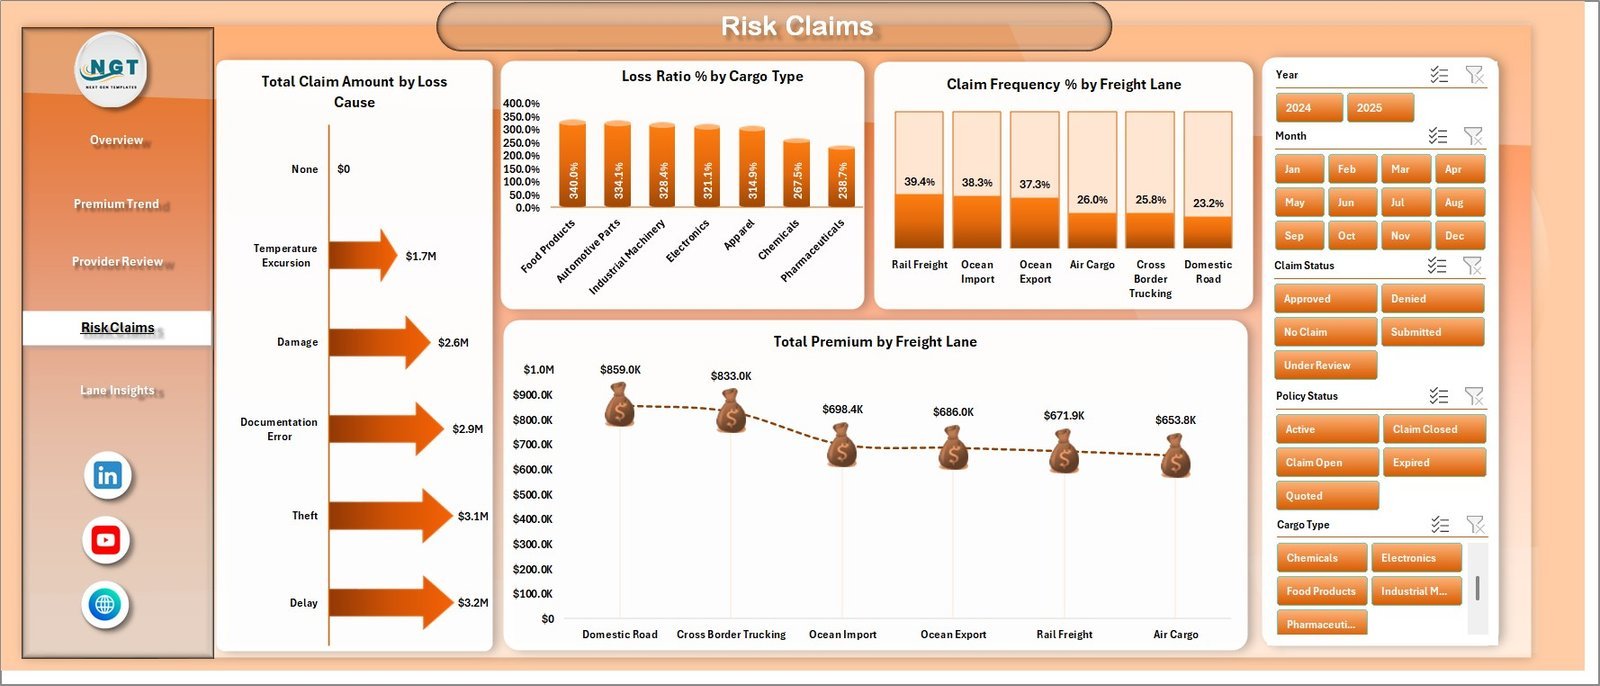
The Risk Claims page focuses on Total Claim Amount by Loss Cause, Loss Ratio % by Cargo Type, Claim Frequency % by Freight Lane, and Total Premium by Freight Lane. This page helps identify claim-heavy loss causes, risky cargo types, and freight lanes that deserve closer review.

Risk Claims
The Lane Insights page analyzes Total Insured Value by Region, Total Shipments by Cargo Type, and Loss Ratio % by Coverage Type. Use it to understand exposure by region, shipment composition, and coverage categories that need pricing or policy review.
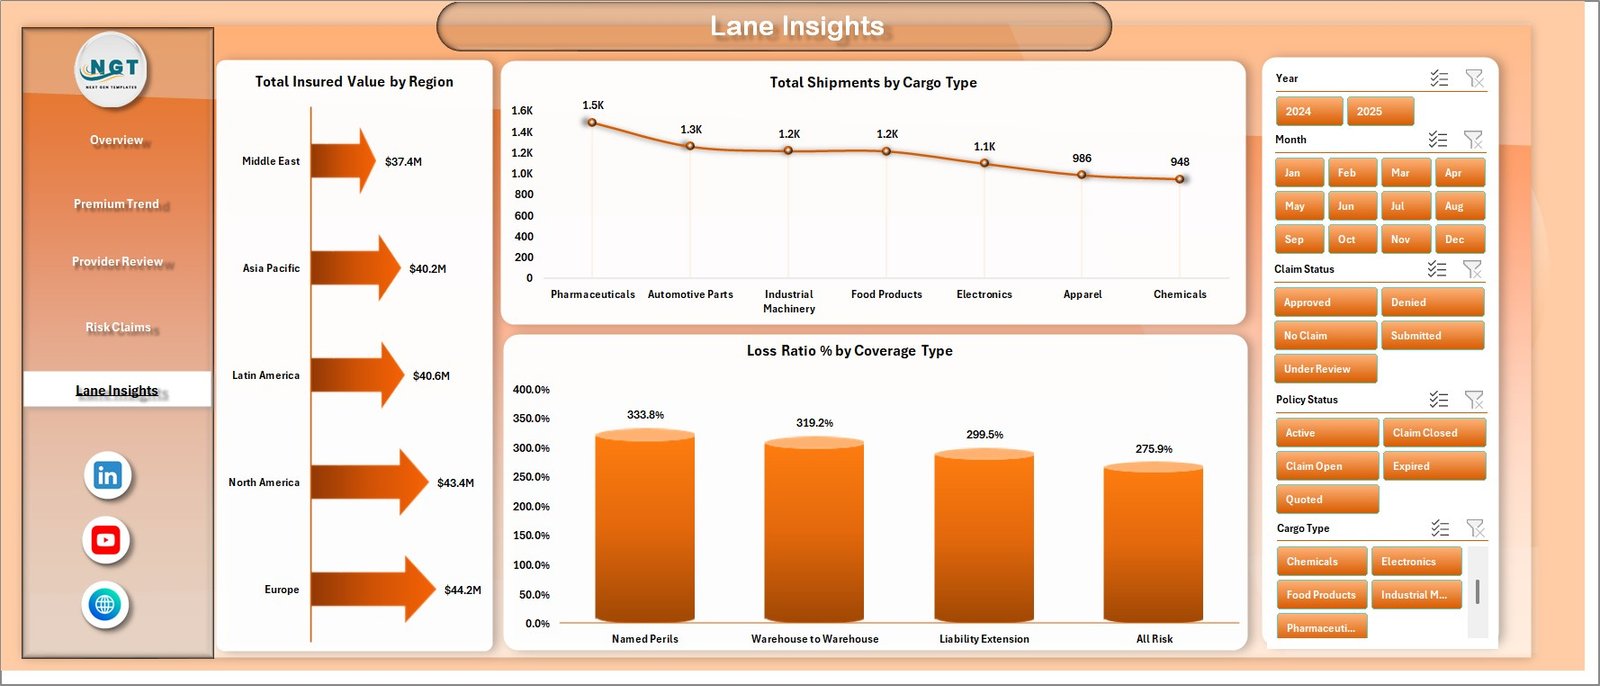
Lane Insights
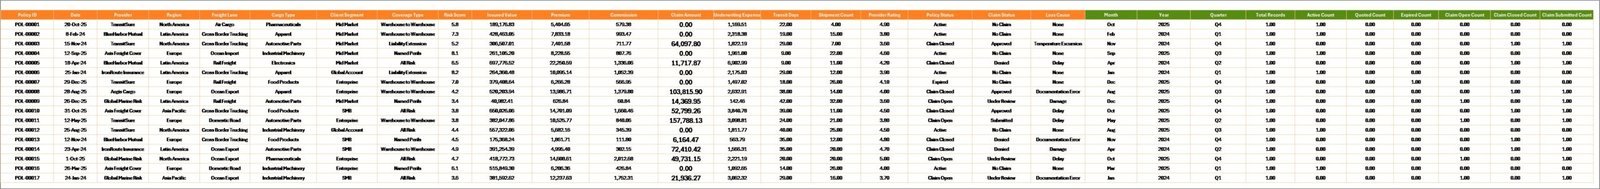
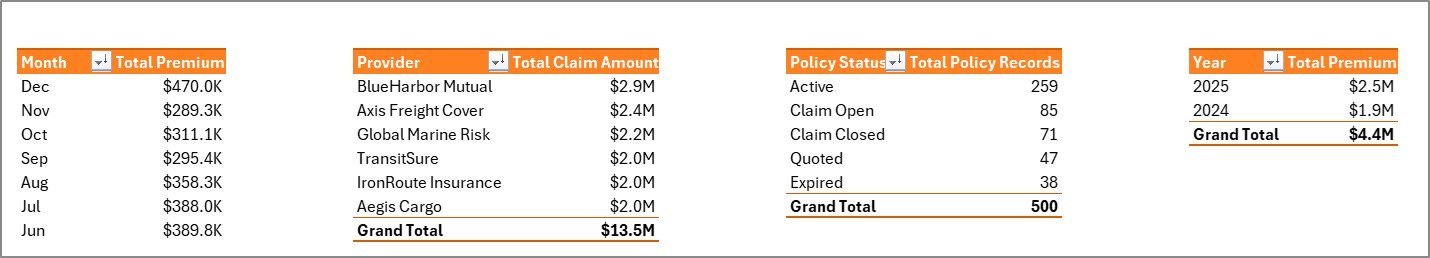
The Data Sheet tab is where you enter or paste your freight insurance records in the same structured format. The Support Sheet contains pivot tables that drive the charts. After updating the Data Sheet, go to the Data tab in Excel and click Refresh All to update the pivots and dashboards. You can keep the Support Sheet hidden for everyday users.
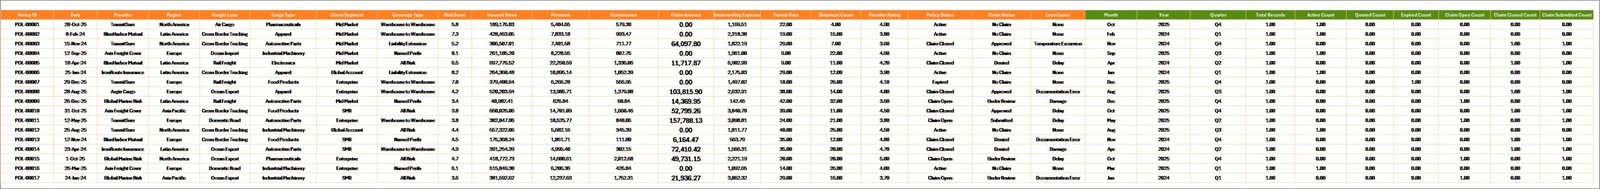
Data Sheet tab

Support Sheet tab
Freight Insurance Providers Dashboard in Excel vs. Google Sheets vs. Paid CRM/SaaS – Where This Fits
| Feature | This Excel dashboard | Google Sheets alternative | Paid insurance SaaS |
|---|---|---|---|
| Cost | $17.99 one-time | Template or custom build | Monthly or annual subscription |
| Platform | Microsoft Excel | Google Sheets | Vendor-hosted system |
| Setup time | Replace sample data and refresh pivots | Import data and rebuild formulas | Implementation and onboarding |
| Real-time team collaboration | Available through OneDrive/SharePoint | Native collaboration | Usually included |
| Mobile access | Excel mobile with limitations | Google Sheets mobile | Vendor app or portal |
| Customizable fields | Fully editable workbook | Editable sheet | Depends on plan |
| Share with link | Possible through Microsoft 365 | Yes | Usually login-controlled |
| Year-1 cost at 5 users | $17.99 plus any Microsoft licensing | Template cost plus maintenance | Often hundreds or thousands |
| Freight insurance views | Built in across 5 pages | Must be built or adapted | Depends on vendor module |
Who This Template Is For – and Who It’s Not For
This template is for freight insurance providers, cargo insurance teams, logistics analysts, transportation risk managers, freight brokers, 3PL reporting teams, and consultants who need a practical Excel dashboard for premium, claim, provider, lane, cargo, region, and policy-status reporting.
It is not for teams that need live claims workflow automation, policy issuance, regulatory filing, real-time carrier integrations, or a production insurance core system. Use it as an analytics and management reporting workbook after your source data is prepared.
How to Use the Freight Insurance Providers Dashboard in Excel
- Download and unzip the Excel dashboard file.
- Open the workbook in Microsoft Excel.
- Replace the sample records in the Data Sheet with your own freight insurance data.
- Keep the same column structure so pivots and charts read the data correctly.
- Go to the Data tab and click Refresh All.
- Use slicers on each page to filter premium, claim, provider, region, cargo, and lane performance.
Real-World Use Cases
Neha, cargo insurance manager: Neha reviews claim frequency, loss ratio, and total claim amount before monthly provider meetings.
Arjun, logistics finance analyst: Arjun uses Premium Trend and Lane Insights to explain premium movement by quarter, coverage type, freight lane, and region.
Maria, freight broker consultant: Maria prepares client-facing reports that compare policy status, claim status, provider rating, and risk by cargo type.
Frequently Asked Questions
What software do I need?
You need Microsoft Excel. The workbook is designed as an Excel dashboard with charts, slicers, data tables, and pivot tables.
How many dashboard pages are included?
The workbook includes 5 dashboard pages: Overview Page, Premium Trend, Provider Review, Risk Claims, and Lane Insights, plus Data Sheet and Support Sheet tabs.
Can I add my own freight insurance data?
Yes. Add your records to the Data Sheet in the same format, then refresh all pivots from the Excel Data tab.
Can I customize charts and KPIs?
Yes. You can edit chart titles, colors, slicers, pivot tables, formulas, and workbook styling directly in Excel.
Does this replace insurance software?
No. This is a reporting dashboard template, not a policy administration, claims processing, or regulatory filing system.
Can I hide the Support Sheet?
Yes. The Support Sheet contains pivot tables used to create the dashboard dynamically and can be hidden after setup.
About the Author
Built by PK – Microsoft Certified Professional with 15+ years of Excel, Google Sheets, and Power BI experience. Founder of NextGenTemplates, reaching 300K+ subscribers across YouTube channels. Every template is hand-built and tested before release.
Explore Related Templates
Explore more Excel dashboard templates and logistics Excel templates. Related options include KPI Dashboard Library (Excel), Customs Clearance Agencies Dashboard in Excel, and Logistics Dashboard in Power BI.
Watch the step-by-step video tutorial:


Reviews
There are no reviews yet.