

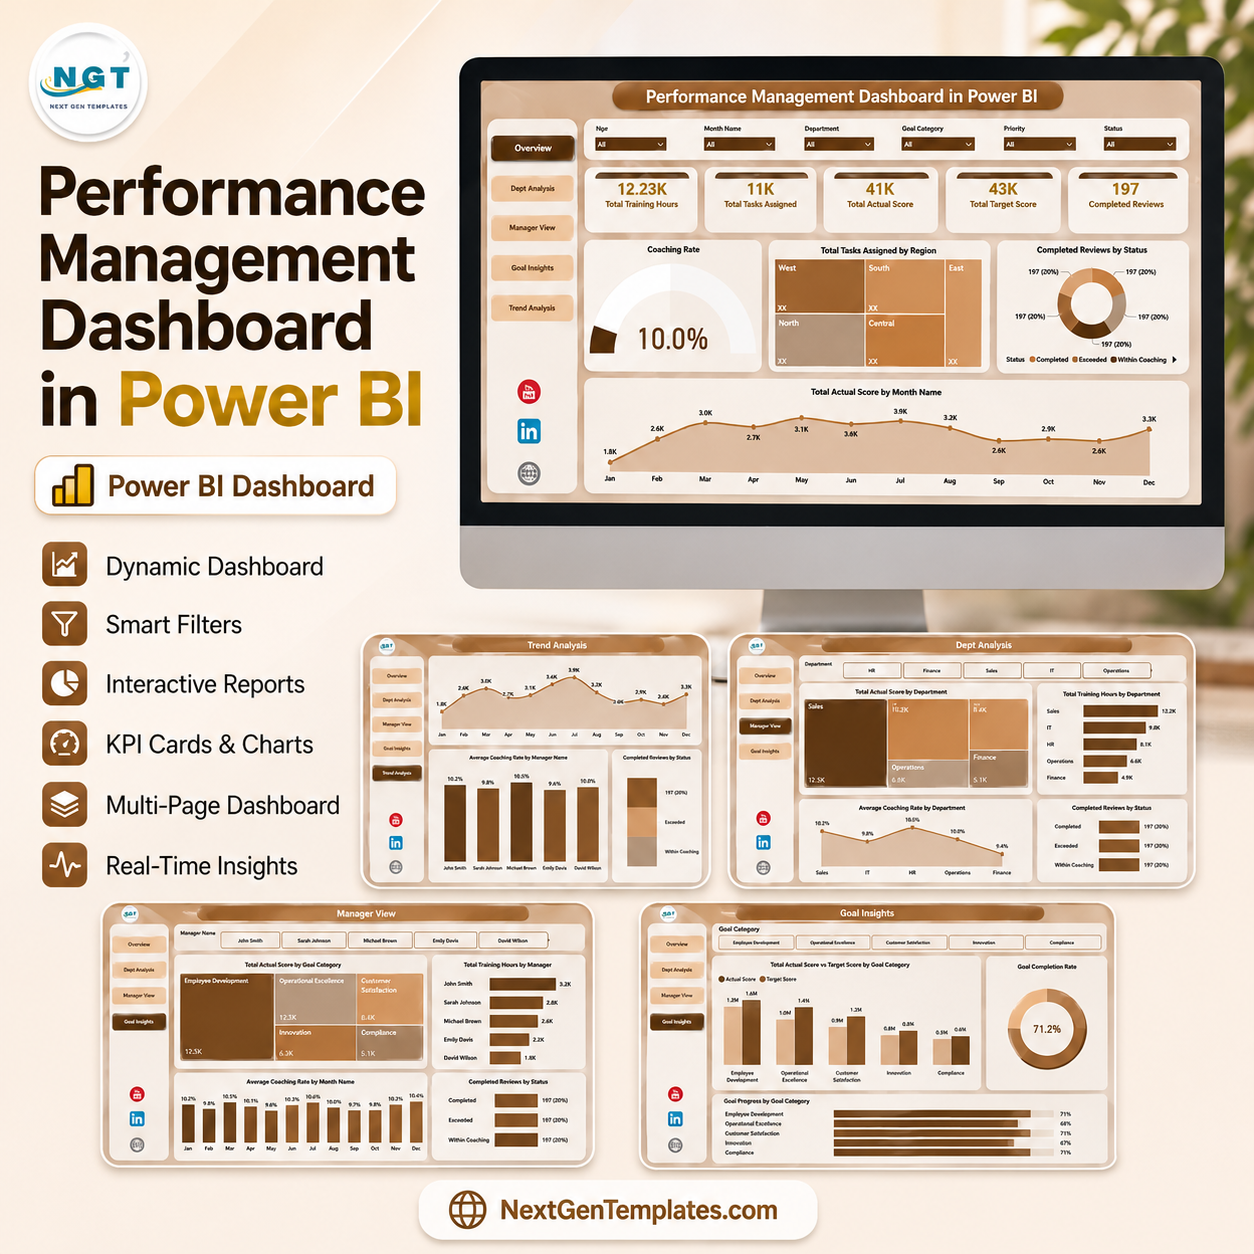

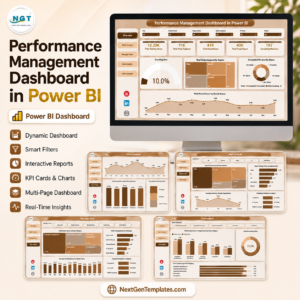
Performance Management Dashboard in Power BI gives HR teams, managers, and business leaders a 5-page Power BI report for reviewing training hours, tasks assigned, actual score, target score, completed reviews, coaching rate, goal attainment, performance rating, priority, and review-cycle trends. Instead of paying monthly HR software fees before you are ready, you get a one-time $17.99 downloadable .pbix file with sample data, slicers, and visual pages already built. Built by PK for a 300K+ subscriber learning audience, this dashboard is designed for practical review meetings, not generic chart decoration.
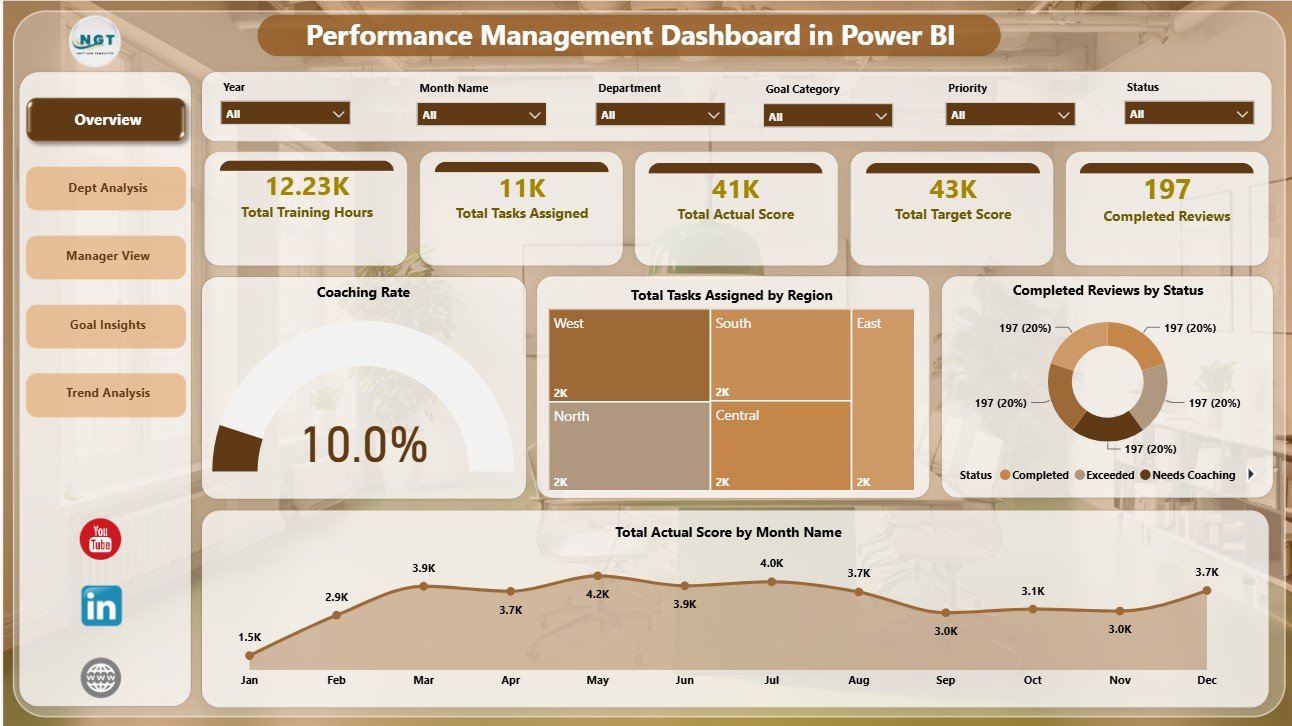
Performance Management Dashboard in Power BI
Key Features of Performance Management Dashboard in Power BI
- 5 Power BI pages: Overview, Dept Analysis, Manager View, Goal Insights, and Trend Analysis.
- 5 headline cards: Total Training Hours, Total Tasks Assigned, Total Actual Score, Total Target Score, and Completed Reviews.
- Interactive slicers: Filter the report quickly by available fields and review the updated dashboard without rebuilding visuals.
- Department analysis: Compare goal attainment by manager, average performance rating by department, and training hours by department.
- Manager view: Review performance rating, tasks completed, and actual score by goal category from a manager-focused page.
- Goal insights: Analyze actual score by priority, task completion rate by goal category, and coaching need by review cycle.
- Trend analysis: Track training hours by month, performance rating by review cycle, and goal attainment by quarter.
What’s Inside the Performance Management Dashboard in Power BI
1 – Overview Page
The Overview page gives leadership a high-level performance snapshot before moving into department, manager, goal, and trend views. The top cards show Total Training Hours, Total Tasks Assigned, Total Actual Score, Total Target Score, and Completed Reviews, while slicers help users filter the report quickly.
Coaching Rate by Overall Performance: This chart shows how coaching need changes across performance groups. It helps HR identify whether low, medium, or high performers need more structured coaching follow-up.
Total Tasks Assigned by Region: This visual compares workload distribution across regions. It helps managers see whether task allocation is balanced or concentrated in specific locations.
Completed Reviews by Status: This chart groups finished reviews by status. It helps teams monitor review workflow progress and spot areas where follow-up may still be needed.
Total Actual Score by Month Name: This trend shows how actual performance score changes month by month. It helps reviewers identify seasonal movement, improvement periods, and possible dips.
2 – Dept Analysis
The Dept Analysis page compares department and manager performance views. It includes Goal Attainment by Manager, Average Performance Rating by Department, and Total Training Hours by Department.
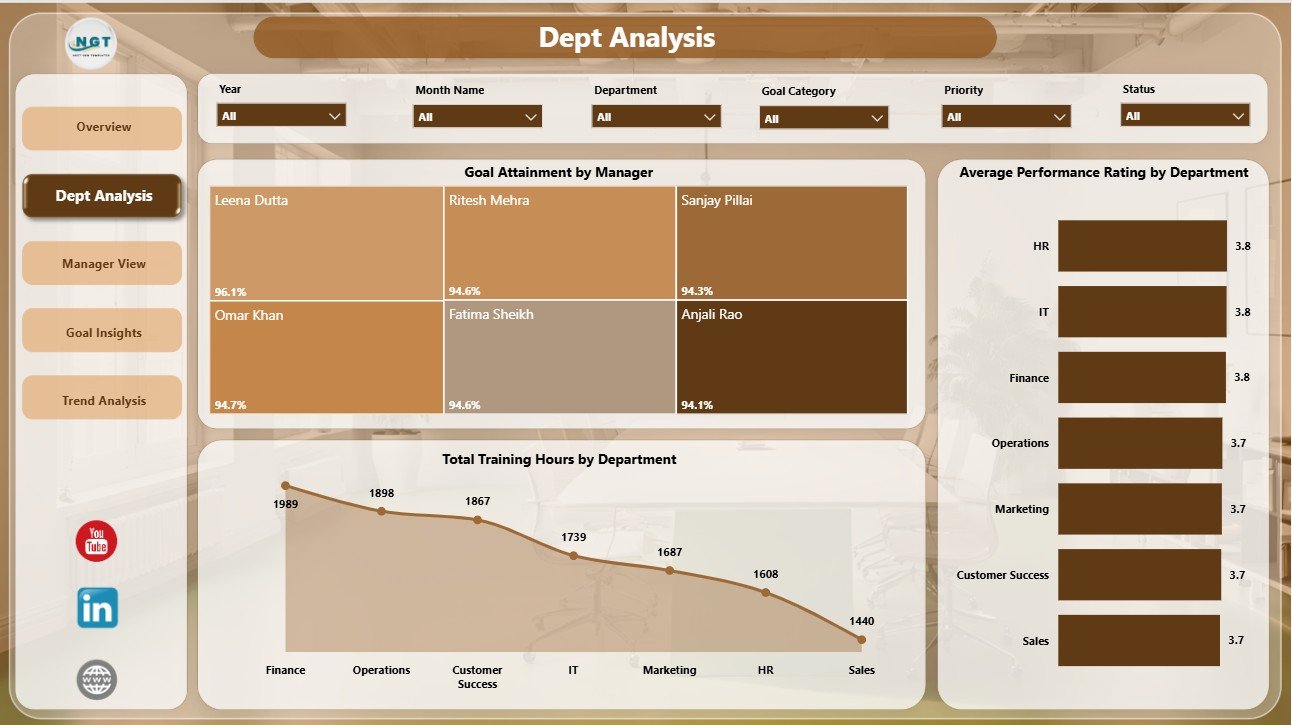
Dept Analysis
3 – Manager View
The Manager View page helps leaders compare outcomes across managers. It includes Average Performance Rating by Manager, Total Tasks Completed by Manager, and Total Actual Score by Goal Category.
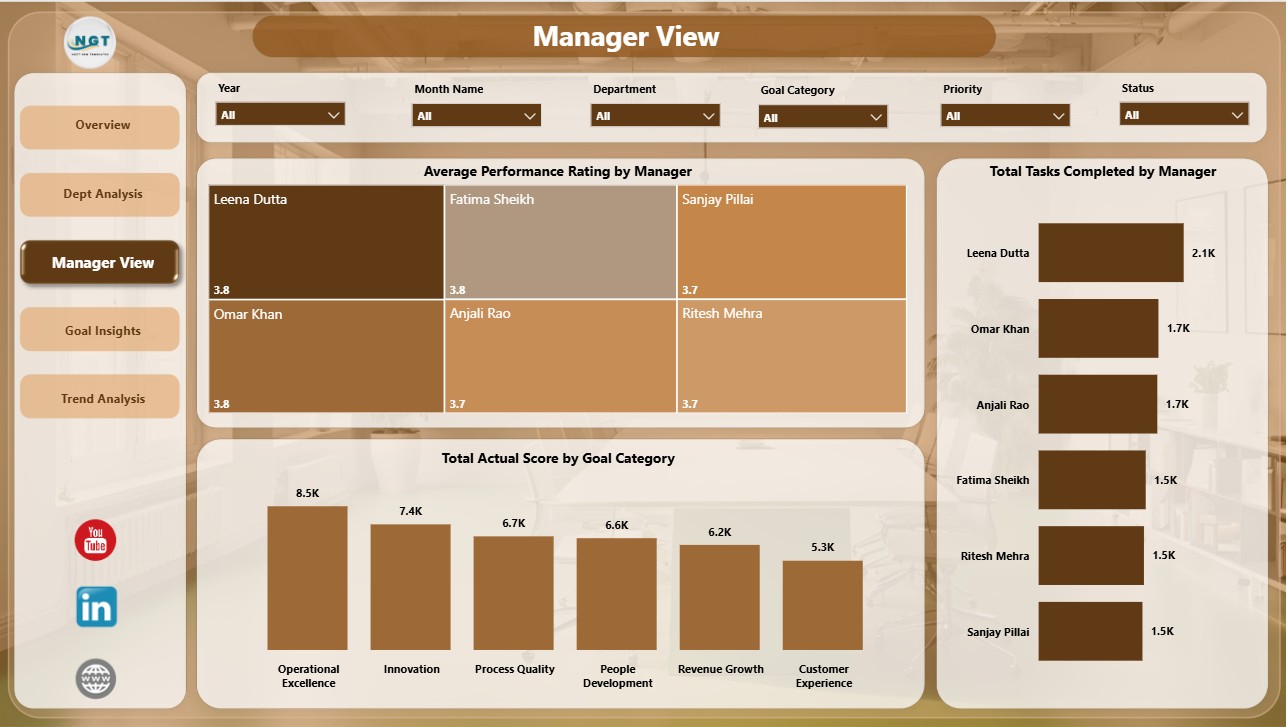
Manager View
4 – Goal Insights
The Goal Insights page focuses on goal priority, completion rate, and coaching need. It includes Total Actual Score by Priority, Task Completion Rate by Goal Category, and Needs Coaching Count by Review Cycle.
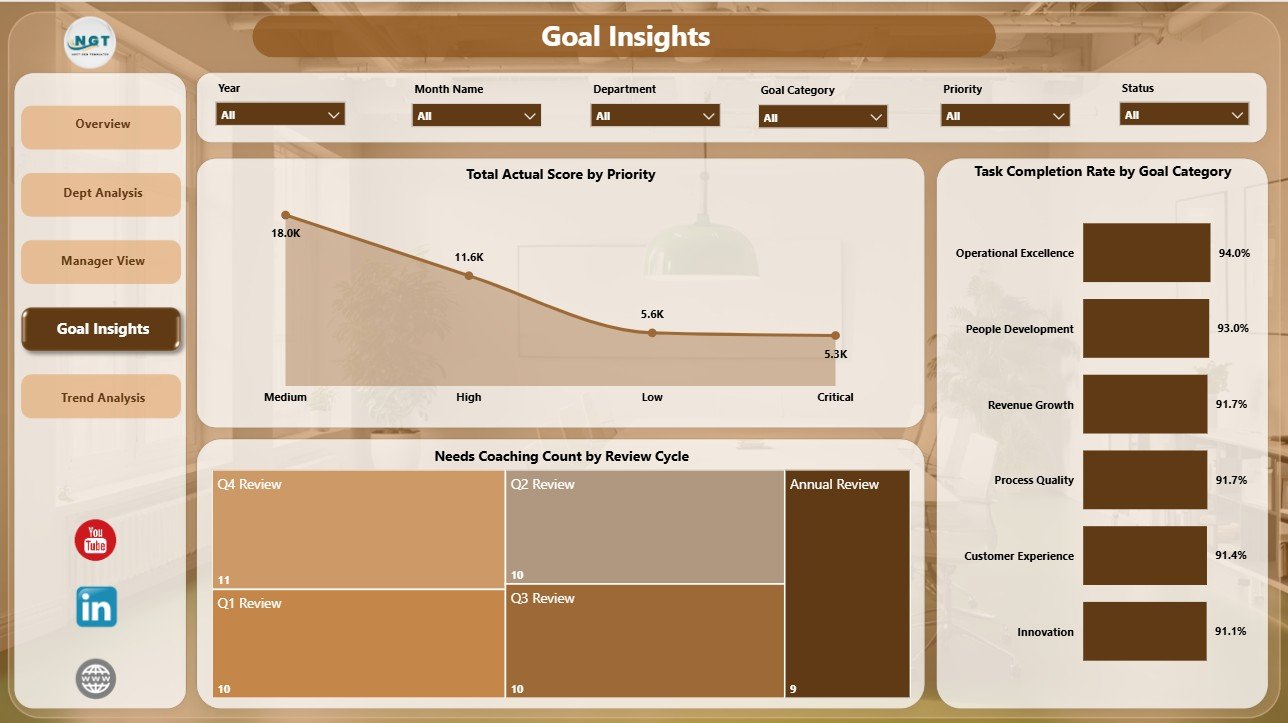
Goal Insights
5 – Trend Analysis
The Trend Analysis page is designed for period-over-period review. It includes Total Training Hours by Month Name, Average Performance Rating by Review Cycle, and Goal Attainment by Quarter.
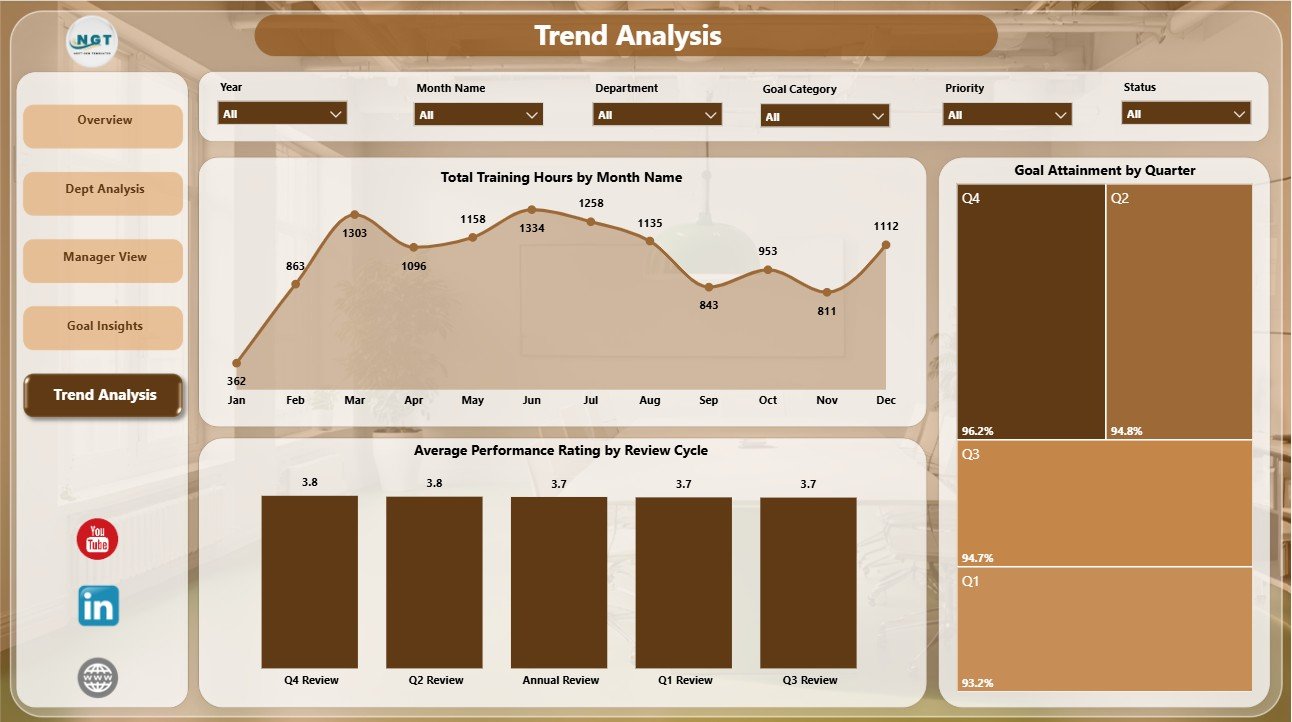
Trend Analysis
Performance Management Dashboard in Power BI vs. Tableau vs. Paid HR SaaS – Where This Fits
| Feature | This Power BI template | Tableau alternative | Paid HR SaaS |
|---|---|---|---|
| Cost | $17.99 one-time sale price | Requires Tableau setup and licensing | Monthly or annual subscription |
| Platform | Power BI Desktop | Tableau Desktop or Cloud | Vendor cloud platform |
| Setup time | Open the .pbix file and replace sample data/source | Build or rebuild visuals | Implementation and onboarding |
| Real-time team collaboration | Possible when published to Power BI Service | Possible with Tableau Server/Cloud | Usually included |
| Customizable fields | Editable model, measures, visuals, and pages | Editable with Tableau skills | Often admin or plan dependent |
| Share with link | Available after publishing to Power BI Service | Available with paid sharing setup | Login controlled |
| Year-1 cost at 5 users | Template price plus your Power BI licensing choice | Often much higher licensing cost | Often hundreds or thousands |
| Performance-review pages | 5 pre-built pages for HR review analysis | Requires custom dashboard build | Depends on reporting module |
Who This Template Is For – and Who It’s Not For
This dashboard is for HR managers, department heads, people analytics analysts, team leads, operations managers, and consultants who already collect performance review data and want a ready Power BI reporting layer. It is not a full HRIS, payroll system, employee self-service portal, approval workflow, or live survey tool.
How to Use the Performance Management Dashboard in Power BI
- Download and unzip the file.
- Open the .pbix file in Power BI Desktop.
- Review the sample Overview, Dept Analysis, Manager View, Goal Insights, and Trend Analysis pages.
- Replace the sample data or connect your own source.
- Refresh the report and verify slicers, cards, charts, and page filters.
- Customize colors, labels, measures, or visuals if your performance process uses different terminology.
Real-World Use Cases
An HR manager uses the Overview and Dept Analysis pages before quarterly review meetings to compare training hours, tasks assigned, completed reviews, and department ratings.
A department head uses Manager View to compare tasks completed and actual score by goal category before deciding where coaching support is needed.
A people analytics consultant adapts the .pbix file for clients that need faster reporting before committing to a larger HR technology rollout.
Frequently Asked Questions
What pages are included?
The report includes Overview, Dept Analysis, Manager View, Goal Insights, and Trend Analysis pages.
What software do I need?
You need Power BI Desktop to open and edit the .pbix file.
Can I connect my own data?
Yes. Replace the sample data or connect your own source, then refresh the Power BI report.
Does this include employee logins or review approvals?
No. This is an analytics dashboard template, not an HR workflow platform.
Can I publish it to Power BI Service?
Yes, if you have the right Power BI account and workspace permissions.
Can I customize the visuals?
Yes. You can edit visuals, measures, labels, slicers, and pages inside Power BI Desktop.
About the Author
Built by PK – Microsoft Certified Professional with 15+ years of Excel, Google Sheets, and Power BI experience. Founder of NextGenTemplates, reaching 300K+ subscribers across YouTube channels. Every template is hand-built and tested before release.
Explore Related Templates
Pair this dashboard with Performance Management Dashboard in Excel, Human Resources (HR) KPI Dashboard in Power BI, Employee Turnover Dashboard in Excel, and Employee Master and Record Data Entry System in Excel. Browse more Power BI dashboard templates and HR and Payroll templates.
Download the Performance Management Dashboard in Power BI today and turn review data into manager-ready Power BI insights.
Last updated: July 23, 2026.
Watch the demo video:
Compatibility and Requirements
- Works in Power BI Desktop, which is free. You open and edit the .pbix file there.
- Publishing to Power BI Service needs a Power BI account and workspace permissions. Microsoft explains the desktop download in Get Power BI Desktop.



























Reviews
There are no reviews yet.