

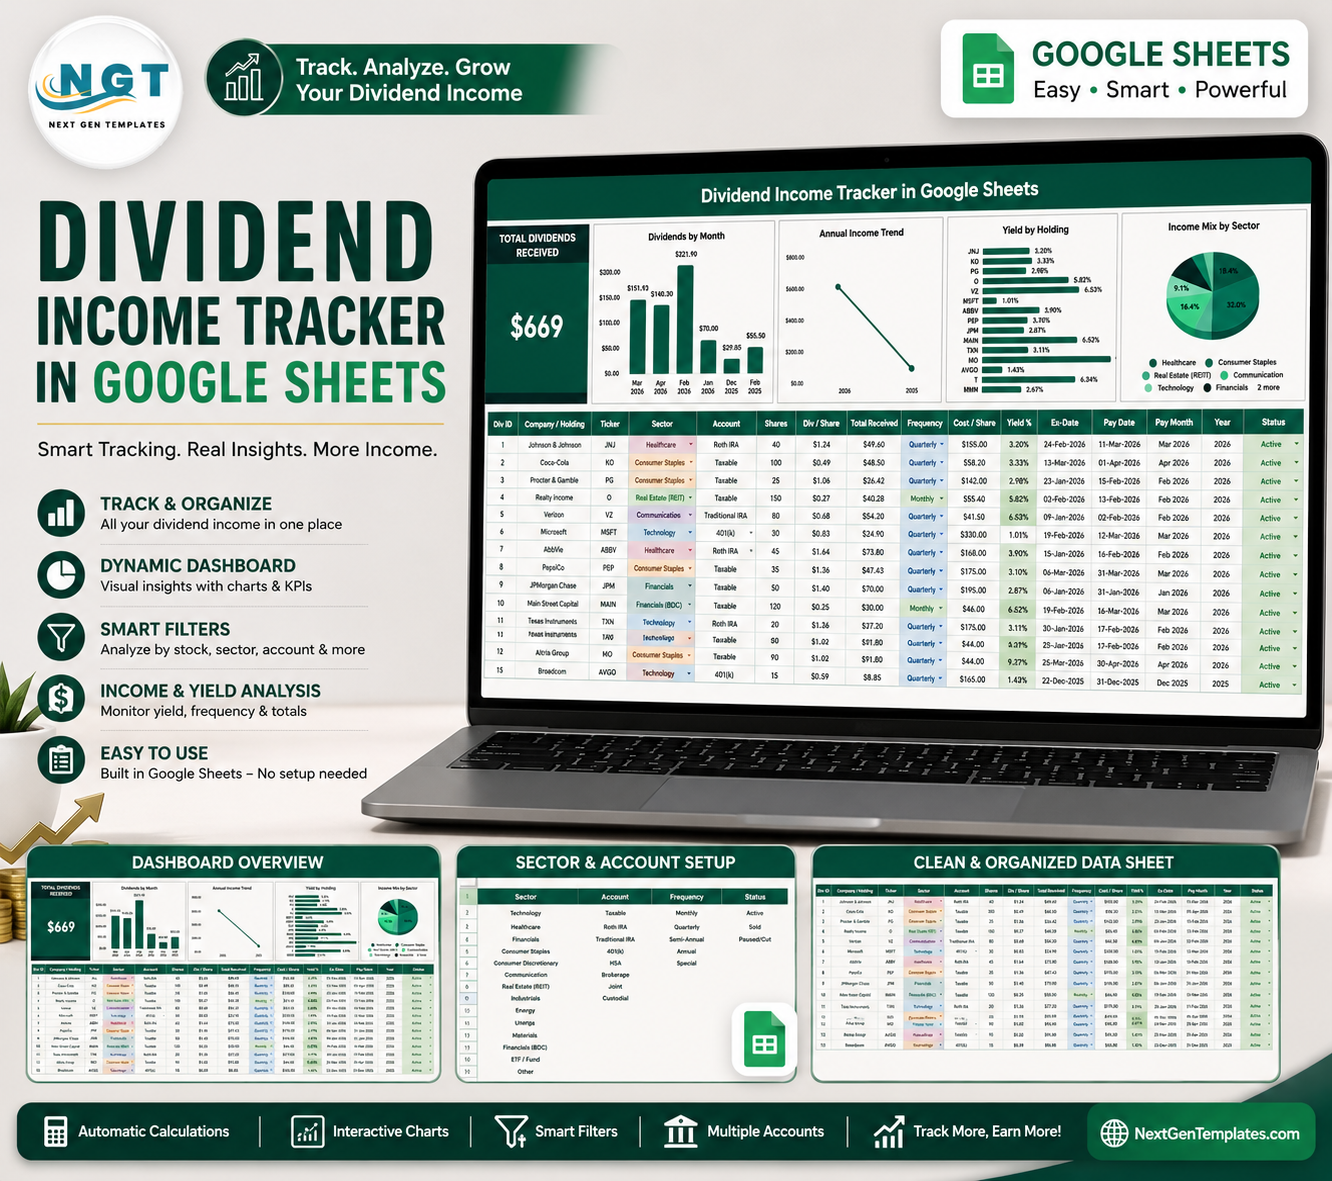

Dividend Income Tracker in Google Sheets helps dividend investors keep payment records, income trends, sector exposure, account types, and holding status in one editable spreadsheet. A portfolio with 20 quarterly dividend holdings creates 80 expected payment checkpoints per year before special payouts or reinvestment notes. This template gives you a cleaner way to track that activity without paying for a full investment platform. It is built for the NextGenTemplates library trusted by 10,000+ professionals, and you work from your own Google Sheets copy with sample data to review before replacing it.
Key Features of Dividend Income Tracker in Google Sheets
- Dividend overview page: See high-level dividend performance with a Total Dividends Received card and visual analysis.
- Monthly income tracking: Review how dividend payments change month by month.
- Annual income view: Compare dividend income across years to see growth or decline.
- Yield by holding: Compare yield performance across individual stocks, funds, or income holdings.
- Sector income mix: Check whether your dividend income depends too heavily on one sector.
- Dropdown list tab: Manage sectors, accounts, payment frequency, and holding status from one setup area.
- Google Sheets access: Use tracker from your browser and share it with an advisor or family member.
What’s Inside the Dividend Income Tracker in Google Sheets
1 – Overview Page
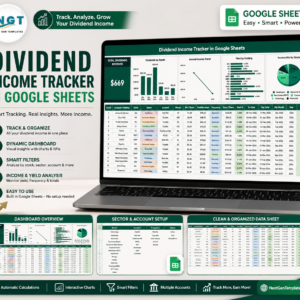
The Overview Page is the main dashboard view. At the top, the Total Dividends Received card gives a quick read on dividend income.
The page includes slicers so you can filter by fields such as sector, account, frequency, holding status, month, or year. This makes it easier to review a specific portfolio slice instead of scrolling through raw records.
Dividends Received by Month: This chart shows dividend cash flow across months. It helps you identify income seasonality, quiet months, and high-payment months.
Annual Income by Year: This chart compares dividend income year by year. It is useful for checking whether your income stream is growing, flat, or becoming less reliable.
Yield by Holding: This chart compares yield across each holding. It helps you spot holdings that produce stronger income relative to the value tracked in the sheet.
Income Mix by Sector: This chart breaks dividend income into sector groups. It helps you see whether your portfolio income is diversified or concentrated in a few sectors.
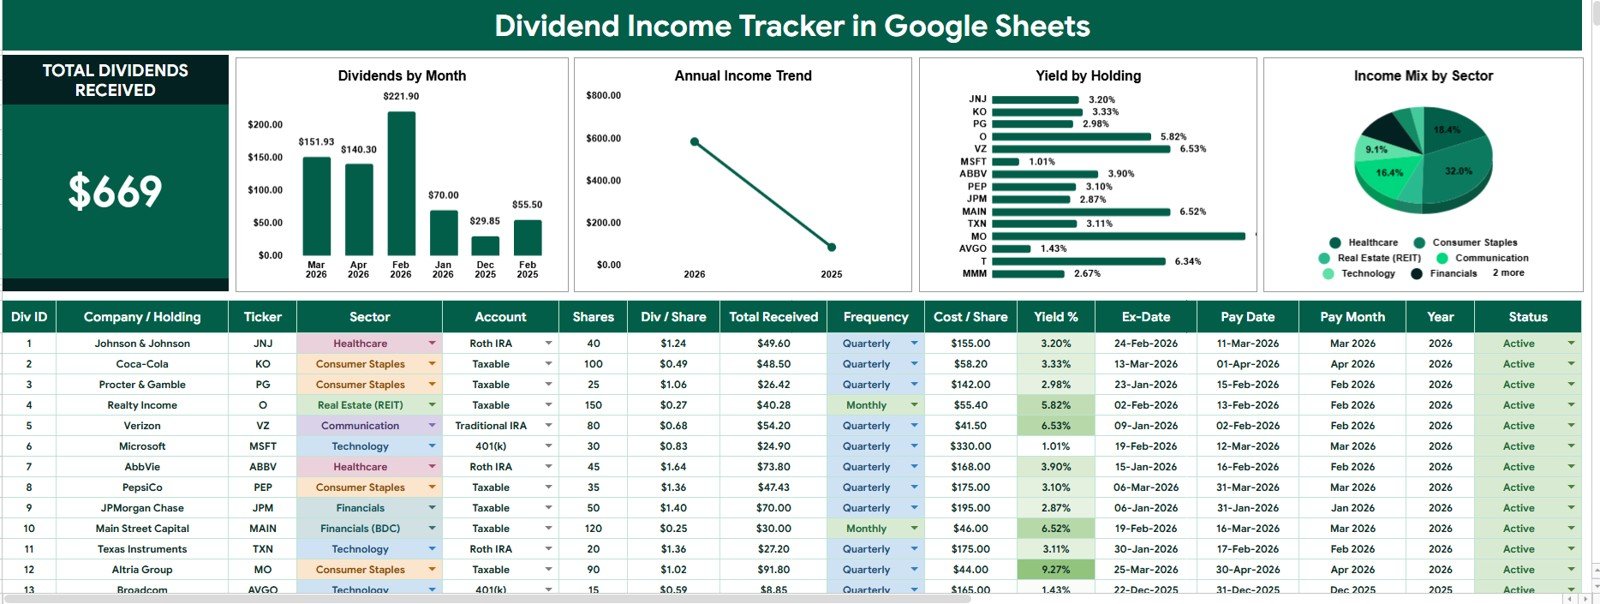
Dividend Income Tracker in Google Sheets
2 – Dropdown List Tab
The Dropdown List tab controls the selectable options used across the tracker. Standard lists keep data entry cleaner and dashboard filters more reliable.
Sector Options by Investment Category: Use this list to standardize sector names for your dividend holdings.
Account Options by Account Type: Track whether income belongs to a taxable account, retirement account, brokerage account, or another category you use.
Dividend Frequency by Payment Schedule: Keep payment timing consistent with monthly, quarterly, semiannual, annual, or custom frequency labels.
Holding Status by Portfolio Stage: Mark holdings as active, watchlist, closed, paused, or any status that fits your portfolio workflow.
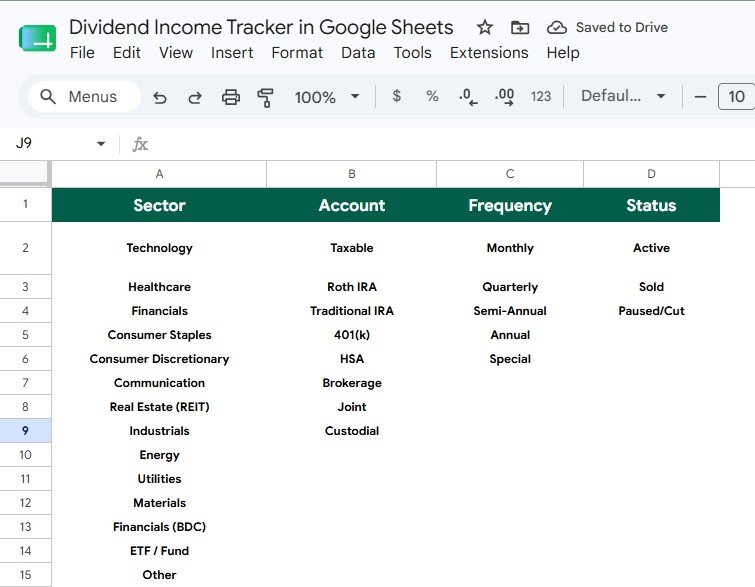
Dropdown List Tab
Dividend Income Tracker in Google Sheets vs. Microsoft Excel Tracker vs. Paid Investment SaaS – Where This Fits
| Area | This Google Sheets Tracker | Microsoft Excel Tracker | Paid Investment SaaS |
|---|---|---|---|
| Cost | One-time template purchase | Spreadsheet file, usually manual setup | Recurring subscription |
| Platform | Google Sheets in the browser | Desktop or web Excel | Vendor-controlled web app |
| Setup time | Start from sample structure and replace records | Often requires chart and formula setup | May require account linking and configuration |
| Collaboration | Shareable with Google Drive permissions | Depends on OneDrive or local file sharing | Usually role-based but subscription limited |
| Dividend focus | Designed around dividends, yield, sectors, accounts, and status | Depends on how the workbook is built | Can include many features you may not need |
Who This Template Is For – and Who It’s Not For
This tracker is for dividend investors, personal finance users, family portfolio managers, finance students, and advisors who want a simple way to organize dividend income. It works well when you want visibility into monthly income, annual income, yield, sector mix, account type, and holding status.
It is not the best fit if you need live brokerage integration, automated tax filing, real-time market data, advanced portfolio modeling, or institutional compliance workflows. In those cases, a dedicated investment platform may be more appropriate.
How to Use the Dividend Income Tracker in Google Sheets
- Open the copy link from the PDF guide and create your editable Google Sheets version.
- Review the sample data to understand the fields, dropdowns, and dashboard behavior.
- Update the Dropdown List tab with your sectors, accounts, dividend frequencies, and holding statuses.
- Enter your dividend records and holding details in the tracker data area.
- Use the Overview Page slicers to review income by month, year, holding, and sector.
Real-World Use Cases
Priya, a long-term dividend investor: Priya uses the monthly chart to see light-income months and annual dividend growth.
Daniel, a household finance planner: Daniel tracks dividends across brokerage and retirement accounts to separate taxable and retirement income views.
Maya, an advisor preparing a client review: Maya uses sector mix and yield by holding to discuss concentration risk with a client.
Frequently Asked Questions
Does this template work in Google Sheets?
Yes. The template is designed for Google Sheets and is intended to be copied into your own Google Drive account.
Can I customize the dropdown lists?
Yes. The Dropdown List tab lets you edit sector options, account types, dividend frequency labels, and holding status values.
Does the tracker connect to my brokerage account?
No. This is a spreadsheet-based tracker, so you enter or paste your dividend records manually.
Can I track multiple accounts?
Yes. The account option setup makes it practical to separate brokerage, retirement, taxable, or custom account types.
Can I share this tracker with someone else?
Yes. Since it is in Google Sheets, you can share the file through Google Drive permissions.
Is this suitable for tax reporting?
It can help organize dividend records, but it is not a tax filing tool. Review final numbers with your accountant or tax advisor.
About the Author
Built by PK – Microsoft Certified Professional with 15+ years of Excel, Google Sheets, and Power BI experience. Founder of NextGenTemplates, reaching 300K+ subscribers across YouTube channels. Every template is hand-built and tested before release.
Explore Related Templates
You may also like Investment Tracker in Google Sheets, Personal Finance KPI Dashboard in Google Sheets, Net Worth Tracker in Google Sheets, and Emergency Fund Tracker in Google Sheets. Browse more Google Sheets financial tools and Google Sheets tracker templates.
Watch the step-by-step video Demo:
Compatibility and Requirements
- Works in Google Sheets. You need a free Google account and a web browser.
- You make your own editable copy from the link in the PDF guide, then enter your dividend records there.
- The Dropdown List tab holds the sector, account, frequency and holding status lists. Google explains how dropdowns work in Create an in-cell dropdown list.


Reviews
There are no reviews yet.