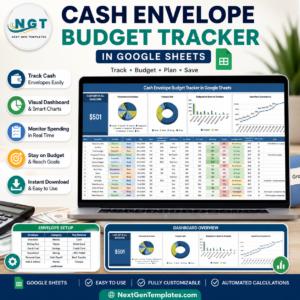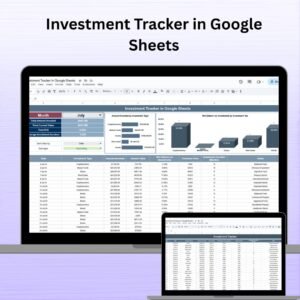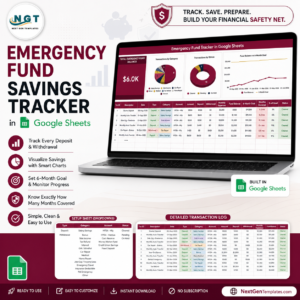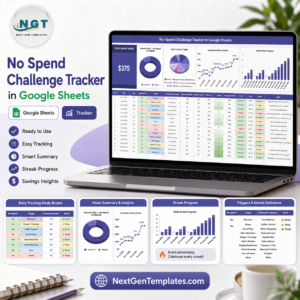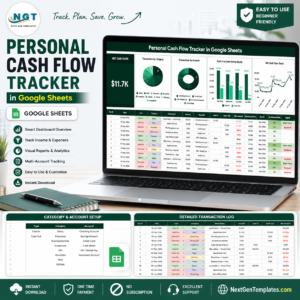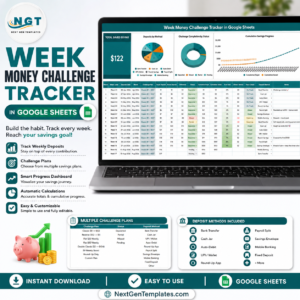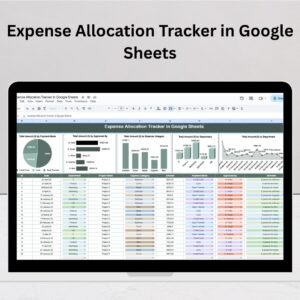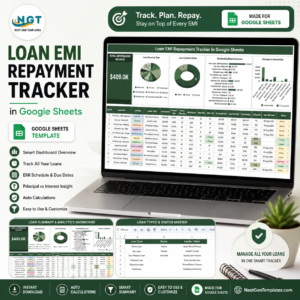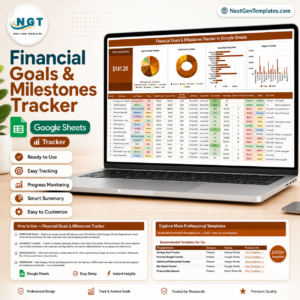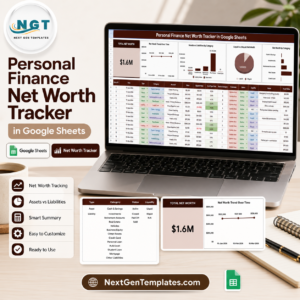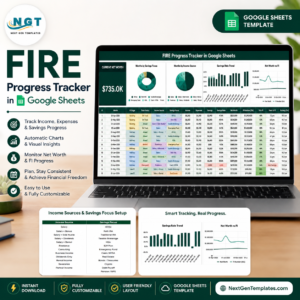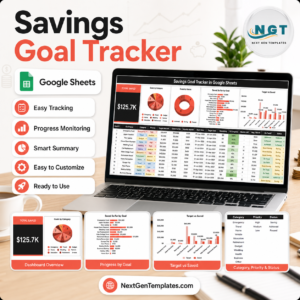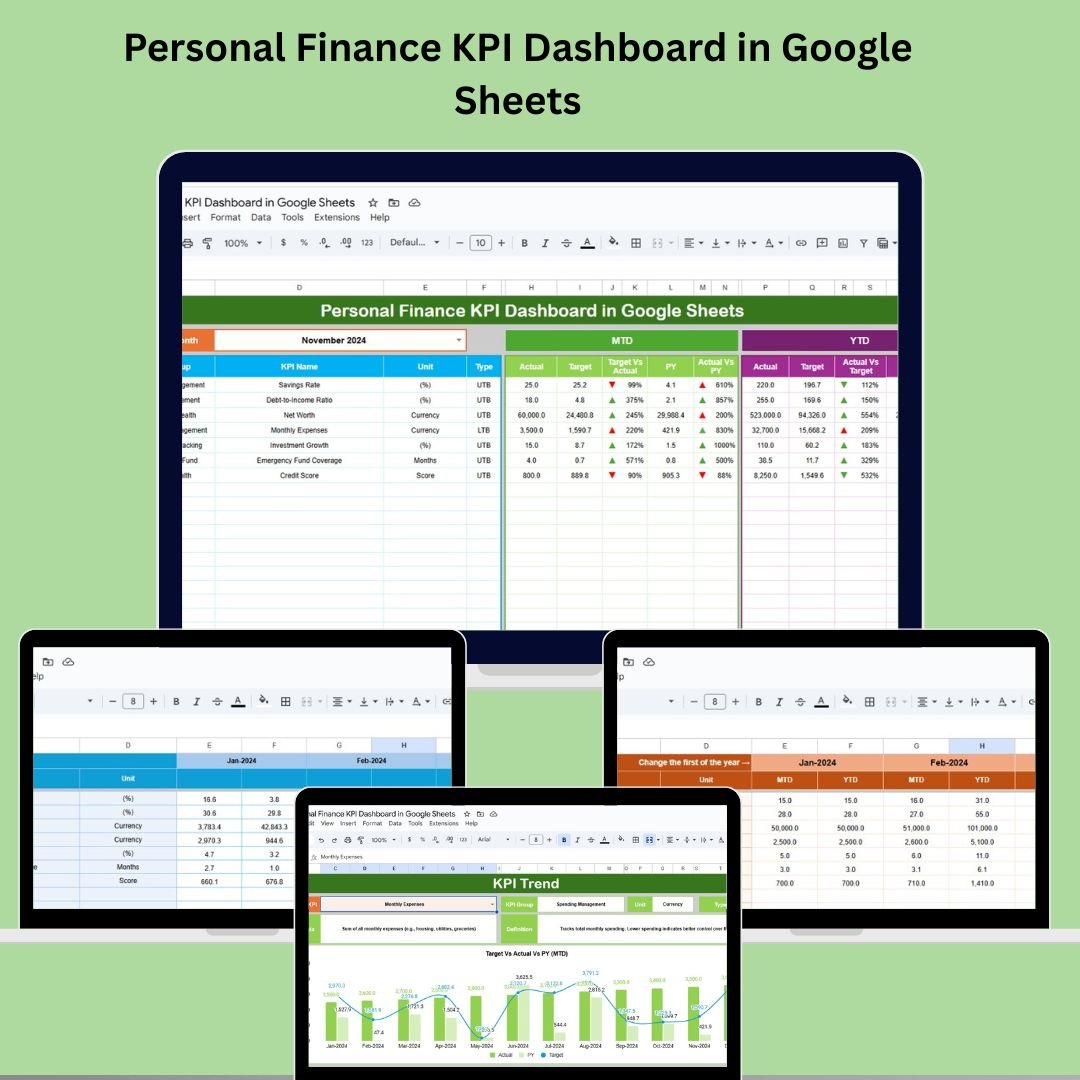
Struggling to stay on top of your income, expenses, and savings? Wish you had a bird’s-eye view of your financial health? Say hello to the Personal Finance KPI Dashboard in Google Sheets – your all-in-one money management tool designed to help you track, measure, and improve your financial goals 🔥📊
This smart and easy-to-use dashboard transforms Google Sheets into a powerful financial tracker. From monthly budgets to yearly savings goals and debt monitoring, this dashboard helps you make smarter money moves with confidence. Whether you’re a beginner or a finance enthusiast, this tool is your step-by-step guide to achieving financial clarity.
✨ Key Features of Personal Finance KPI Dashboard in Google Sheets
📊 Interactive Dashboard Sheet
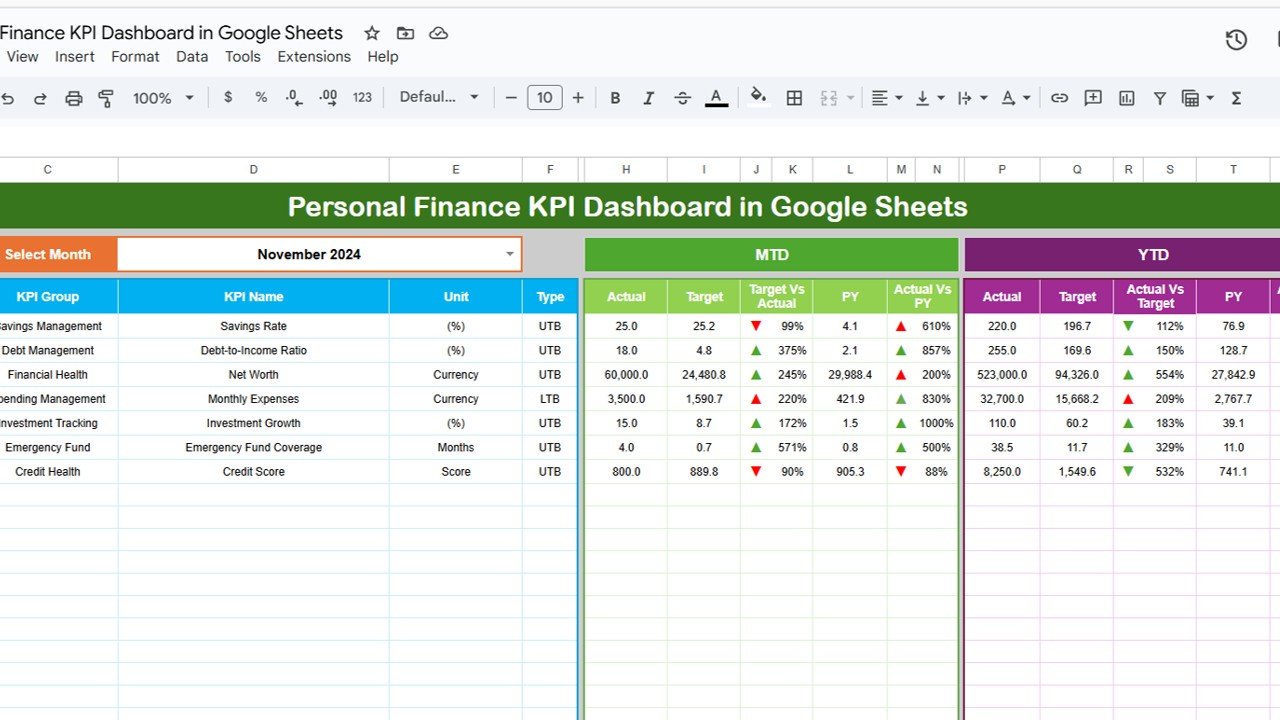
At the heart of this template is a dynamic dashboard that updates instantly based on the selected month.
MTD & YTD View – Track your progress with Month-To-Date and Year-To-Date insights.
Target vs Actual – See how close you are to hitting your goals.
Previous Year Comparison – Understand if you’re doing better than last year.
Smart Arrows – Conditional formatting with up/down arrows to show performance trends.
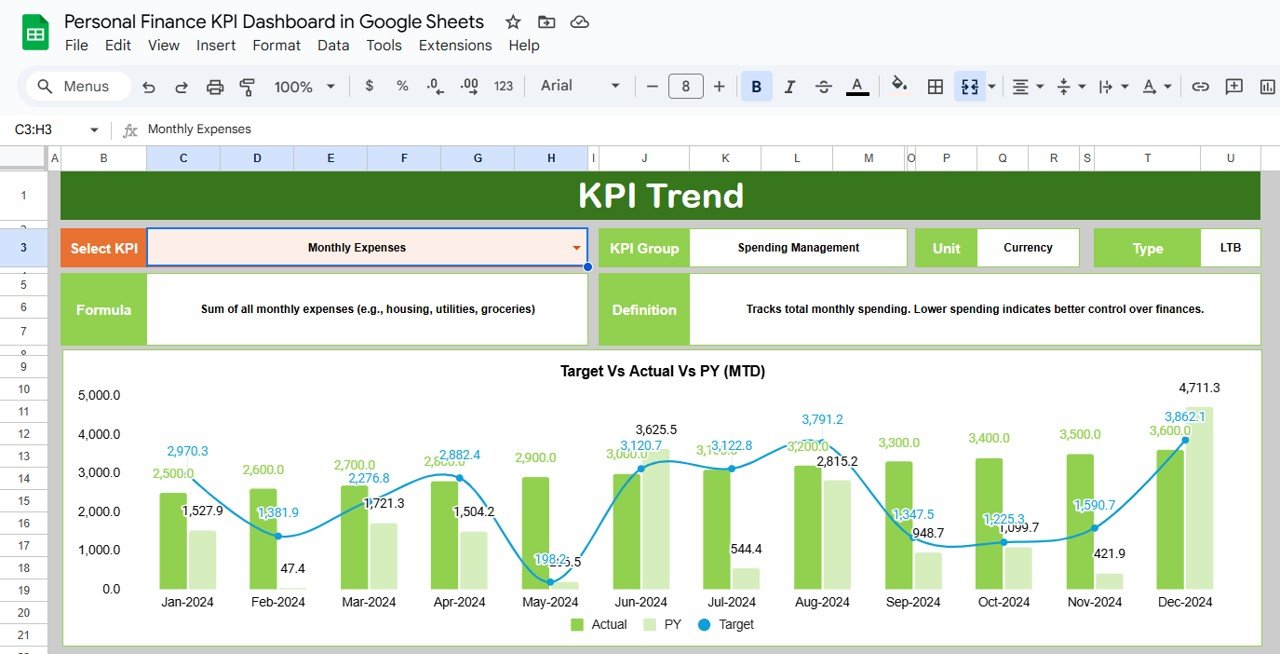
📈 KPI Trend Tracker
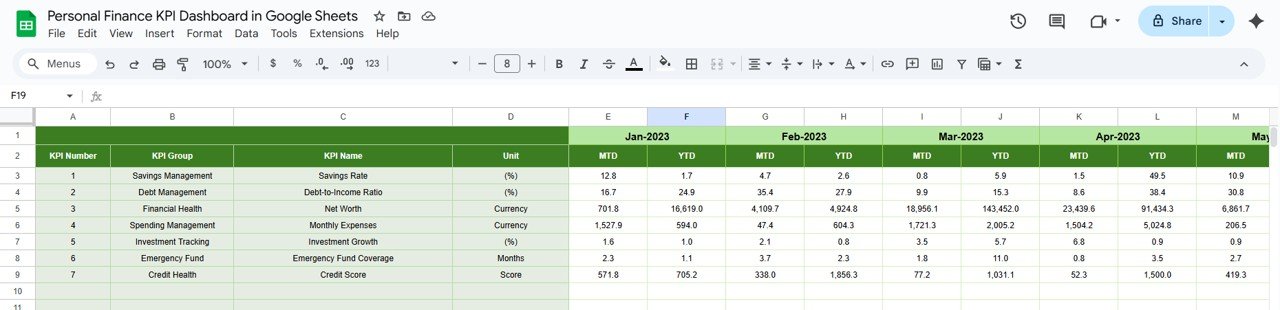
Want to dive deeper? Use the KPI Trend sheet to view:
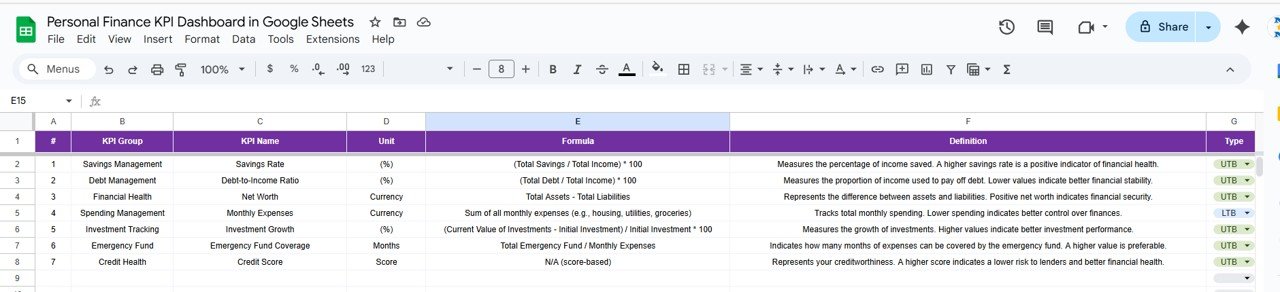
KPI Group, Unit, and Type (Lower or Upper the Better)
Definition and Formula
Monthly progress at a glance
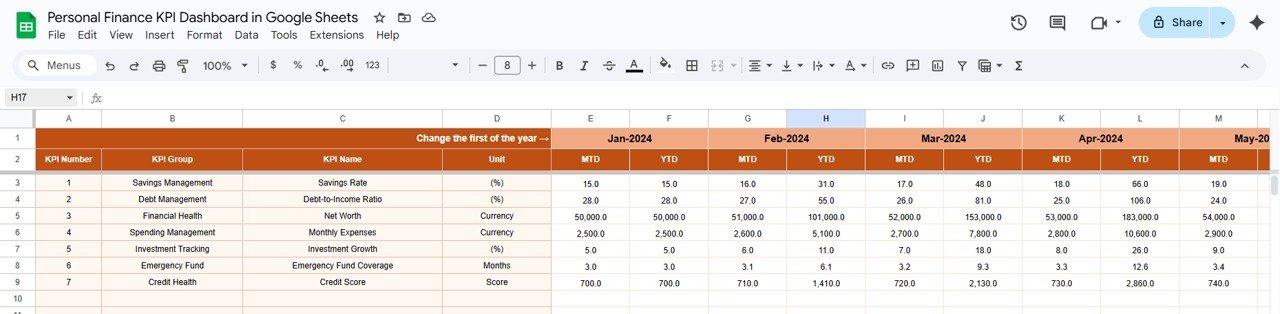
📥 Actual Numbers Input Sheet
Enter your real monthly data for both MTD and YTD. It updates everything in the dashboard automatically based on the selected month in range E1.
🎯 Target Sheet
Set your financial goals for each KPI. Define MTD and YTD targets and track your progress against them.
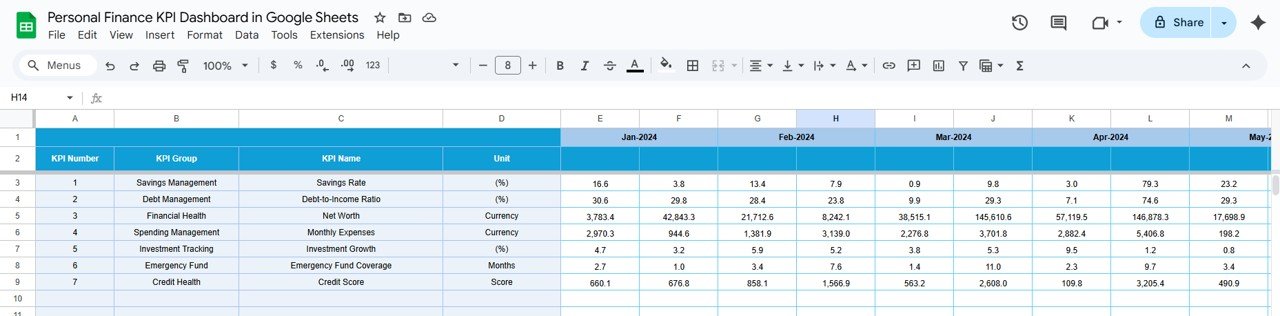
🔁 Previous Year Data Sheet
Input your historical financial data and easily compare it with the current year to identify improvements or concerns.
📌 KPI Definition Sheet
Clearly outlines all KPIs with fields for KPI Name, Group, Unit, Formula, and Definition—so you always know exactly what you’re tracking and why.
📦 What’s Inside the Personal Finance KPI Dashboard?
This dashboard comes with 6 powerful sheets:
Dashboard – Your financial cockpit
KPI Trend – Visual trend insights
Actual Number – Real-time data entry
Target – Goal-setting sheet
Previous Year Number – Compare with last year
KPI Definition – Know what each metric means
Every sheet is interconnected to give you full control and visibility over your finances with zero hassle.
🛠 How to Use the Personal Finance KPI Dashboard
Set the First Month in cell E1 on the Actual Numbers sheet.
Enter Your Actual Data for the selected month.
Set Your Goals in the Target sheet.
Review the Dashboard to track your progress.
Adjust Monthly and compare trends over time for smarter decision-making.
No fancy software or formulas needed—just your Google account and this sheet!
👥 Who Can Benefit from This Product?
This dashboard is ideal for:
🧑🎓 College Students – Start budgeting early
👨👩👧 Families – Track household expenses & savings
🧑💼 Working Professionals – Stay focused on goals like buying a house or saving for a car
🧠 Finance Enthusiasts – Monitor investments, debt, and income
👩💻 Freelancers – Keep personal and business finances separate and structured
💼 Side Hustlers – Understand where your extra income goes
💡 Why Choose Google Sheets?
✅ Cloud-Based – Access anywhere, anytime
✅ Real-Time Collaboration – Share with partners or financial advisors
✅ Easy to Customize – Add more KPIs or tweak formulas
✅ Version History – Never lose your data
✅ No Subscription – 100% free with your Google account
💡 Best Practices for Maximum Impact
Update monthly to keep your dashboard fresh
Use trend insights to detect patterns or issues
Set realistic targets that push you, but don’t overwhelm
Compare with previous years for a progress check
Customize the KPI list to match your financial goals