

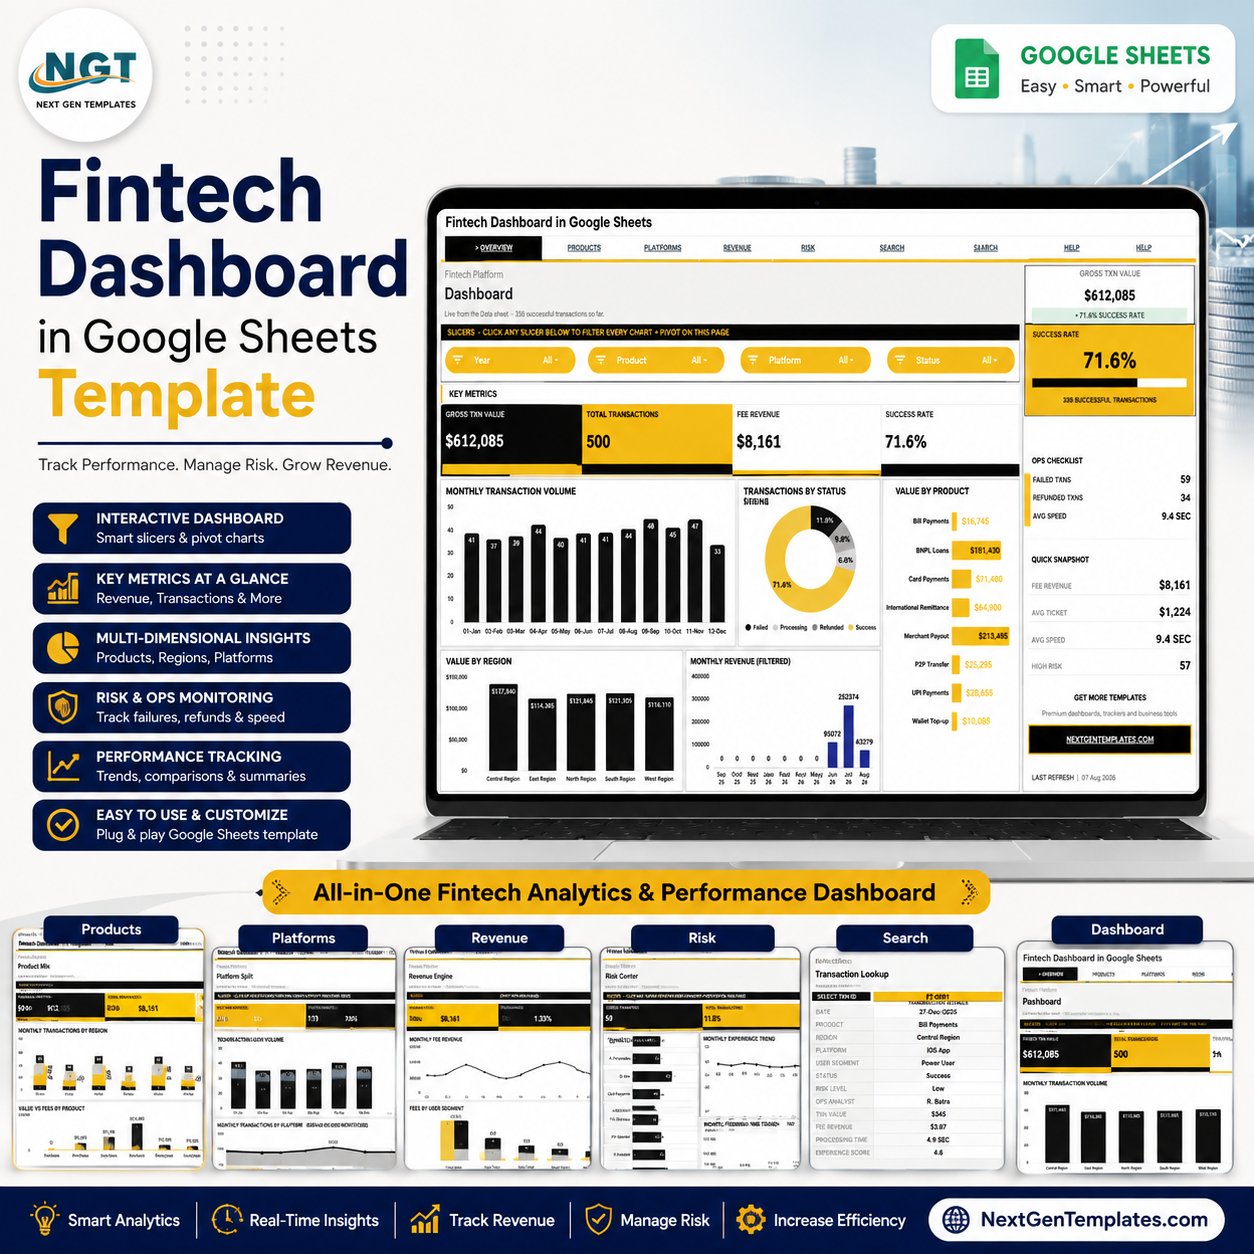
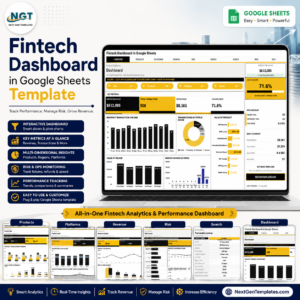
Fintech Dashboard in Google Sheets gives payment and fintech teams 7 connected sheet tabs, 4 headline KPI cards, 20 chart views, native slicers, a transaction lookup sheet, and an editable data sheet for transaction analysis. At the $9.99 sale price, it is a one-time Google Sheets dashboard for teams that need transaction value, fee revenue, success rate, product mix, platform split, revenue, and risk views without a monthly BI subscription. Built by PK, founder of NextGenTemplates with 300K+ subscribers, every template is tested before release, and your editable copy stays in your own Google Drive.
Key Features of Fintech Dashboard in Google Sheets
- 4 executive KPI cards: Gross TXN Value, Total Transactions, Fee Revenue, and Success Rate.
- 20 ready chart views: Monthly volume, transaction status, product value, region value, platform mix, user segments, fee revenue, risk, analyst, processing time, and experience score trends.
- Native slicers: Filter the dashboard by the fields already built into the workbook, so review meetings can move from total performance to selected segments quickly.
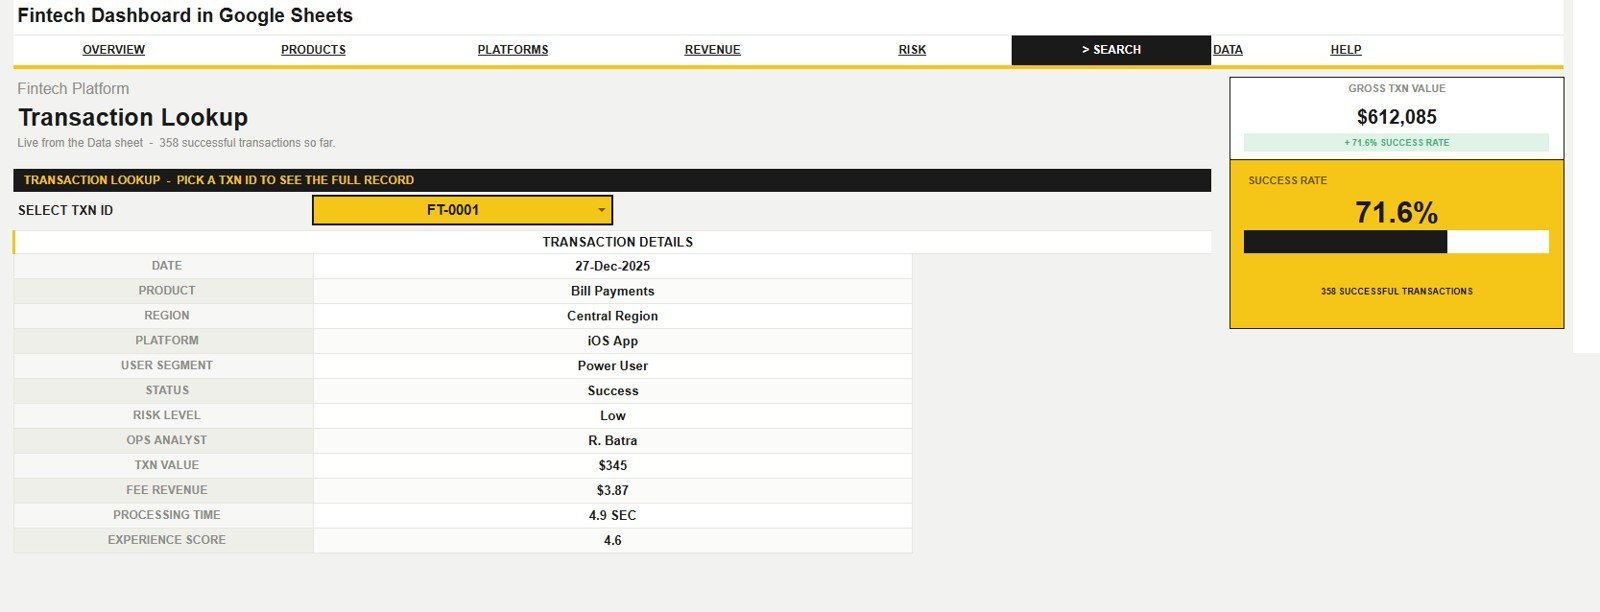
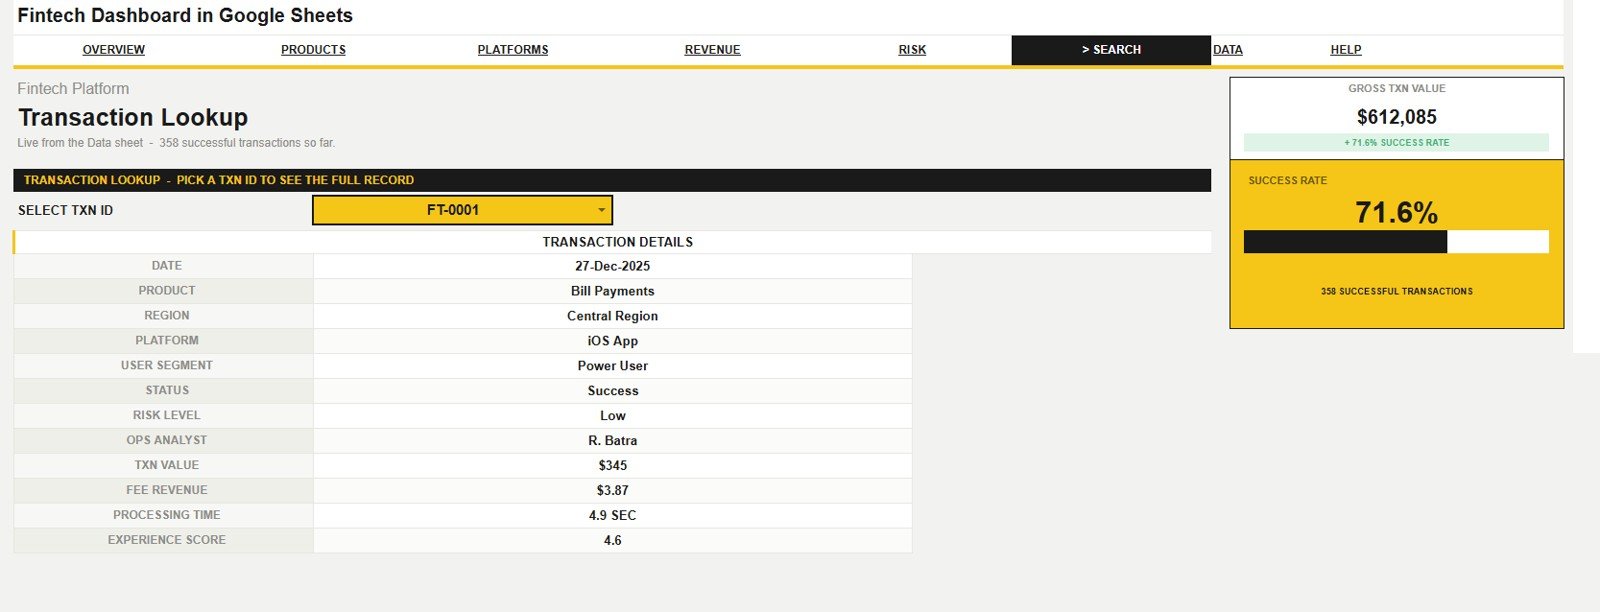
- Transaction lookup sheet: Select a Txn ID and see the full record, including date, product, region, platform, user segment, status, risk level, analyst, value, fee, processing time, and experience score.
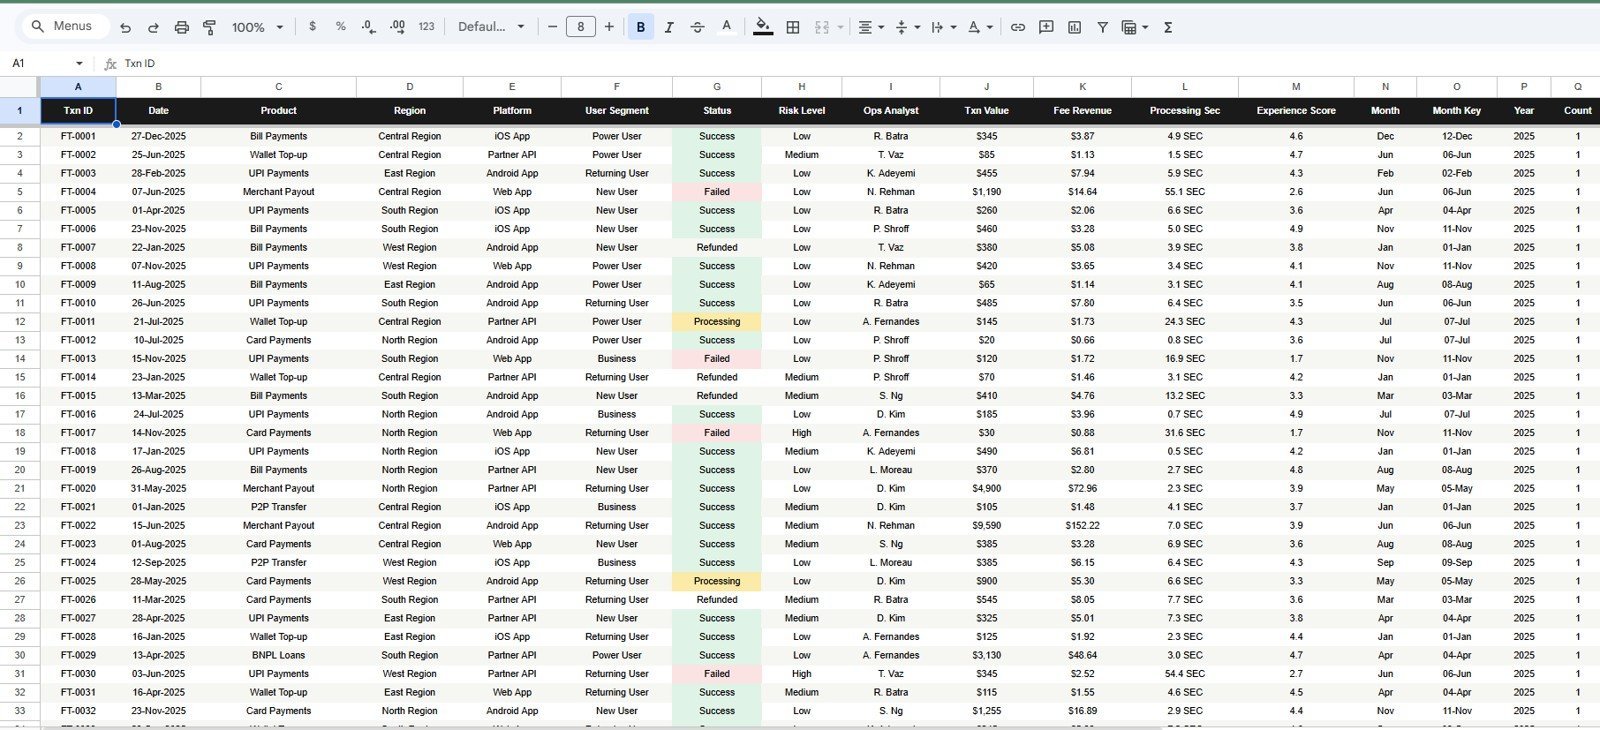
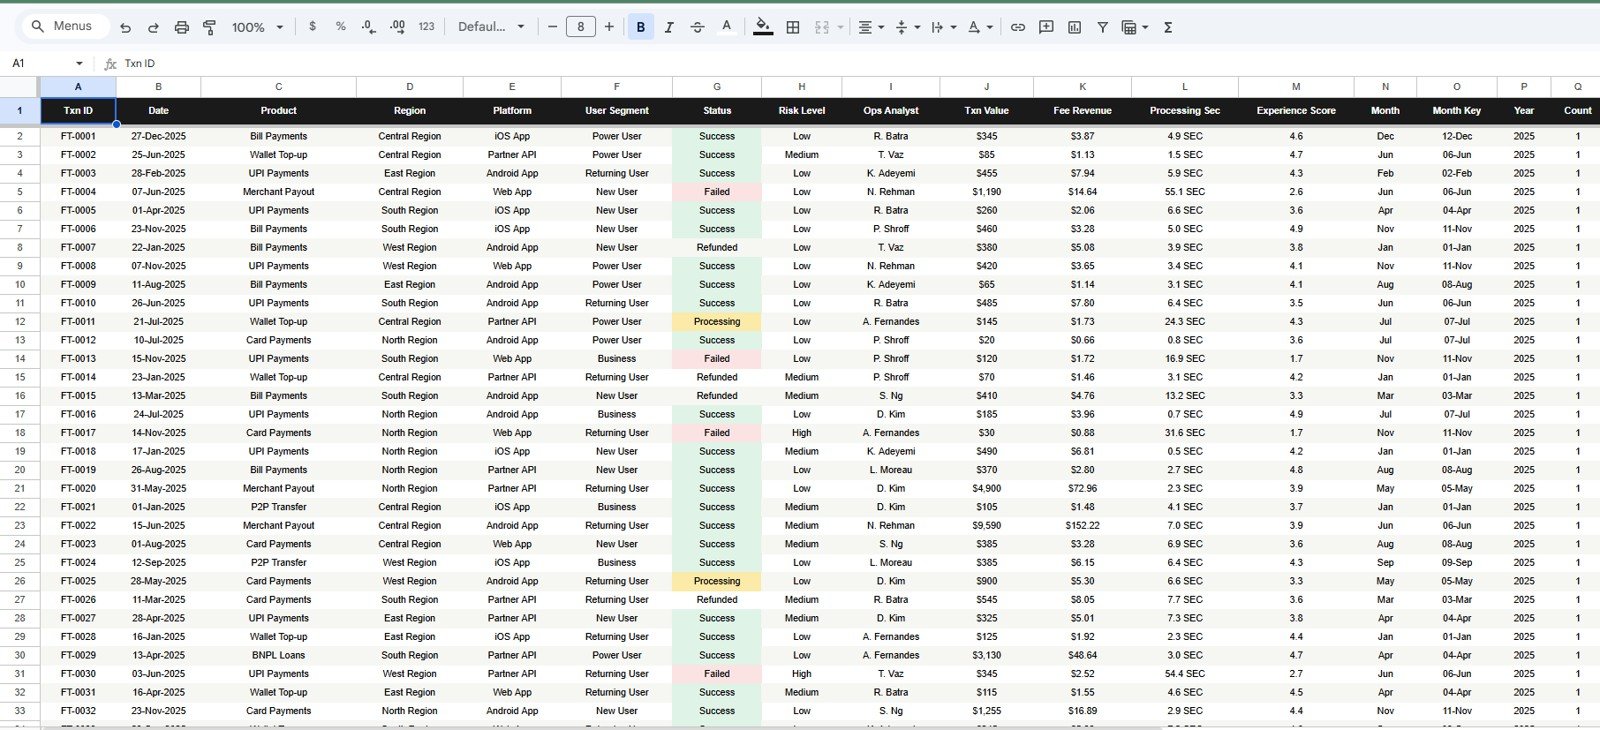
- Editable data sheet: Replace the sample transaction records in the same column format and the dashboard pages update from your data.
- Google Sheets format: Share the file through Google Drive for team viewing, comments, or controlled editing.
What’s Inside the Fintech Dashboard in Google Sheets
The workbook is built around the questions a fintech operations, payments, revenue, or risk team asks every week: how much value moved, how many transactions succeeded, which products and regions are strongest, which platforms carry the load, and where risk or processing friction is appearing.
Overview Page
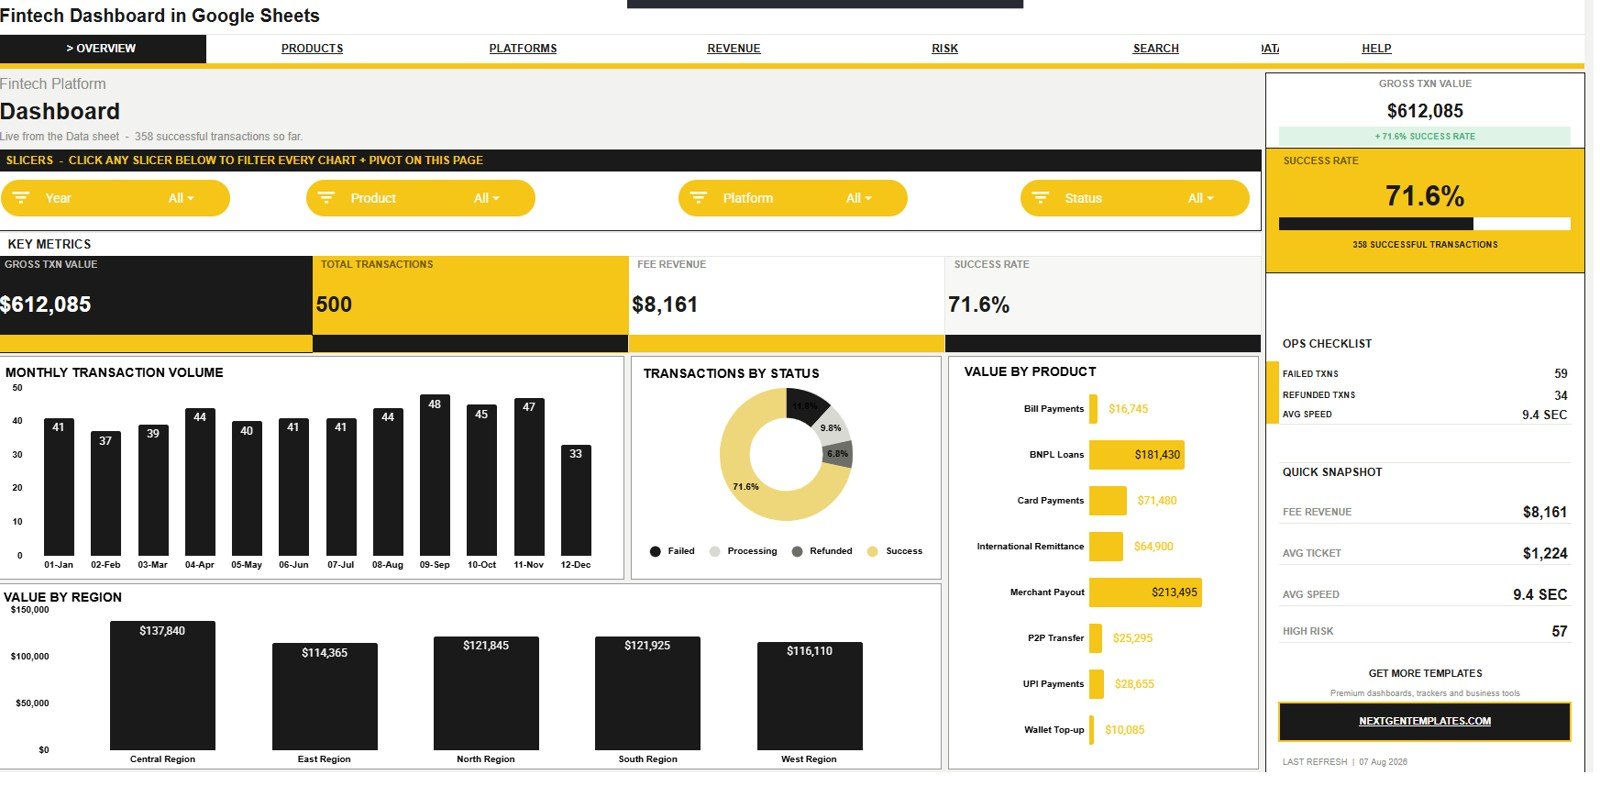
The Overview Page shows Gross TXN Value, Total Transactions, Fee Revenue, and Success Rate at the top. Monthly Transaction Volume by Month tracks transaction activity over time, while Transactions by Status separates successful, failed, pending, or reviewed activity for quick health checks.
Value by Product helps compare payment, lending, wallet, card, or other fintech products. Value by Region helps the team see which markets are driving the highest transaction value.
Product Mix
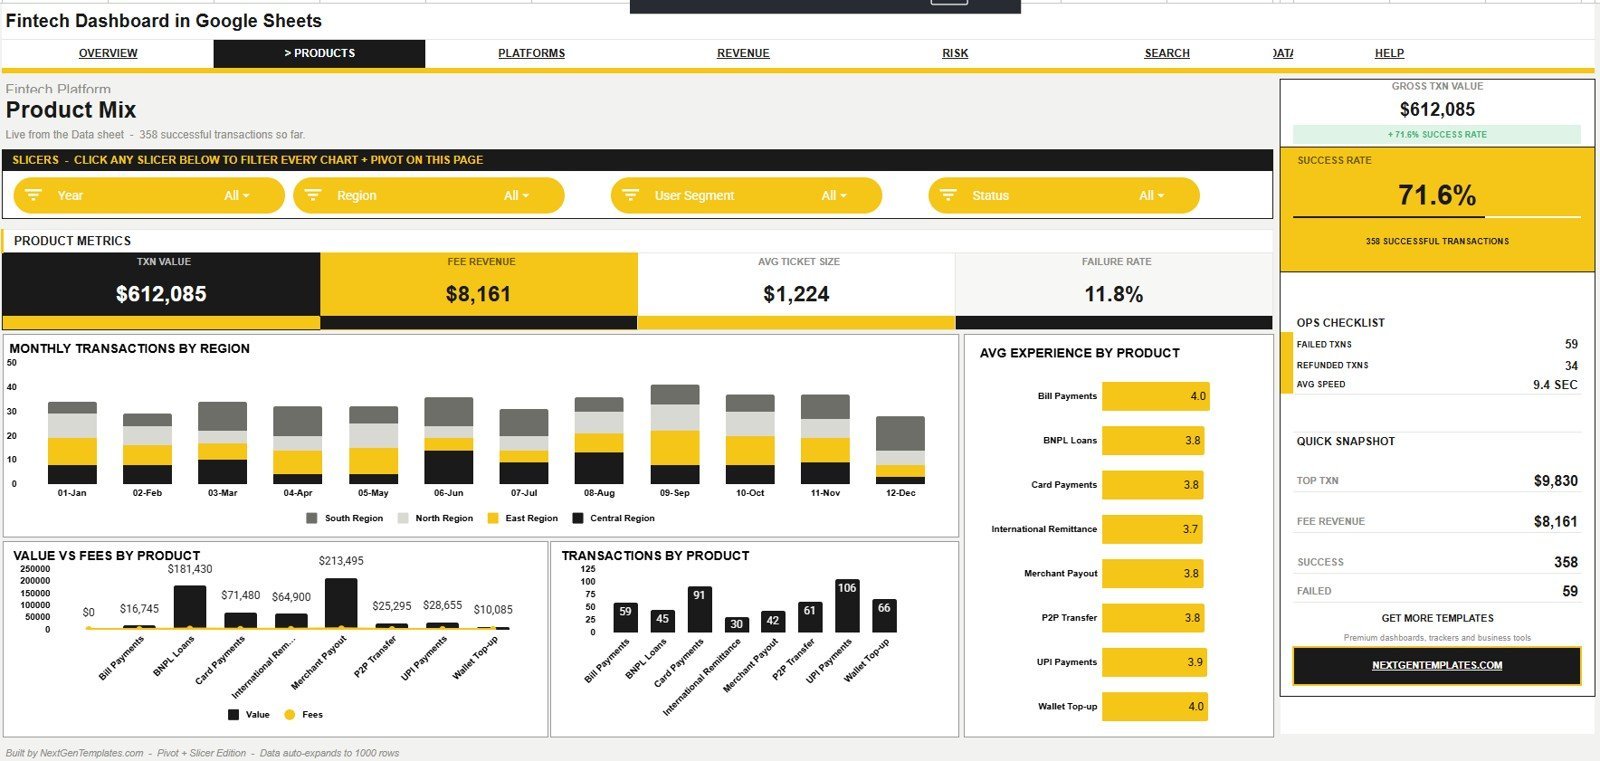
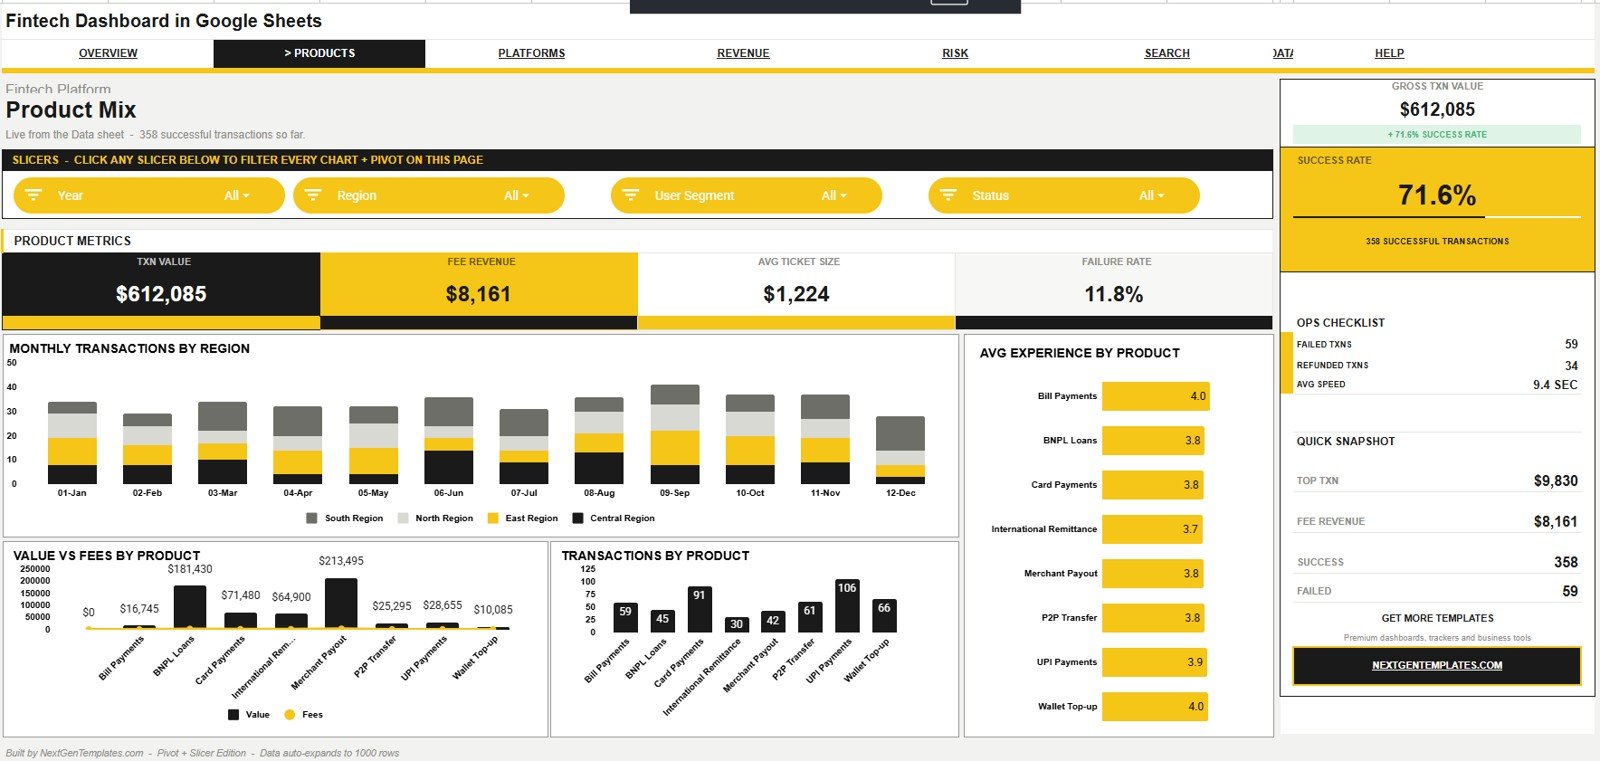
The Product Mix tab reviews Monthly Transactions by Region, Average Experience by Product, Transaction Value and Fee Revenue by Product, and Transactions by Product. It is useful when leadership needs to understand which products generate usage, revenue, and customer experience quality.
Platform Split
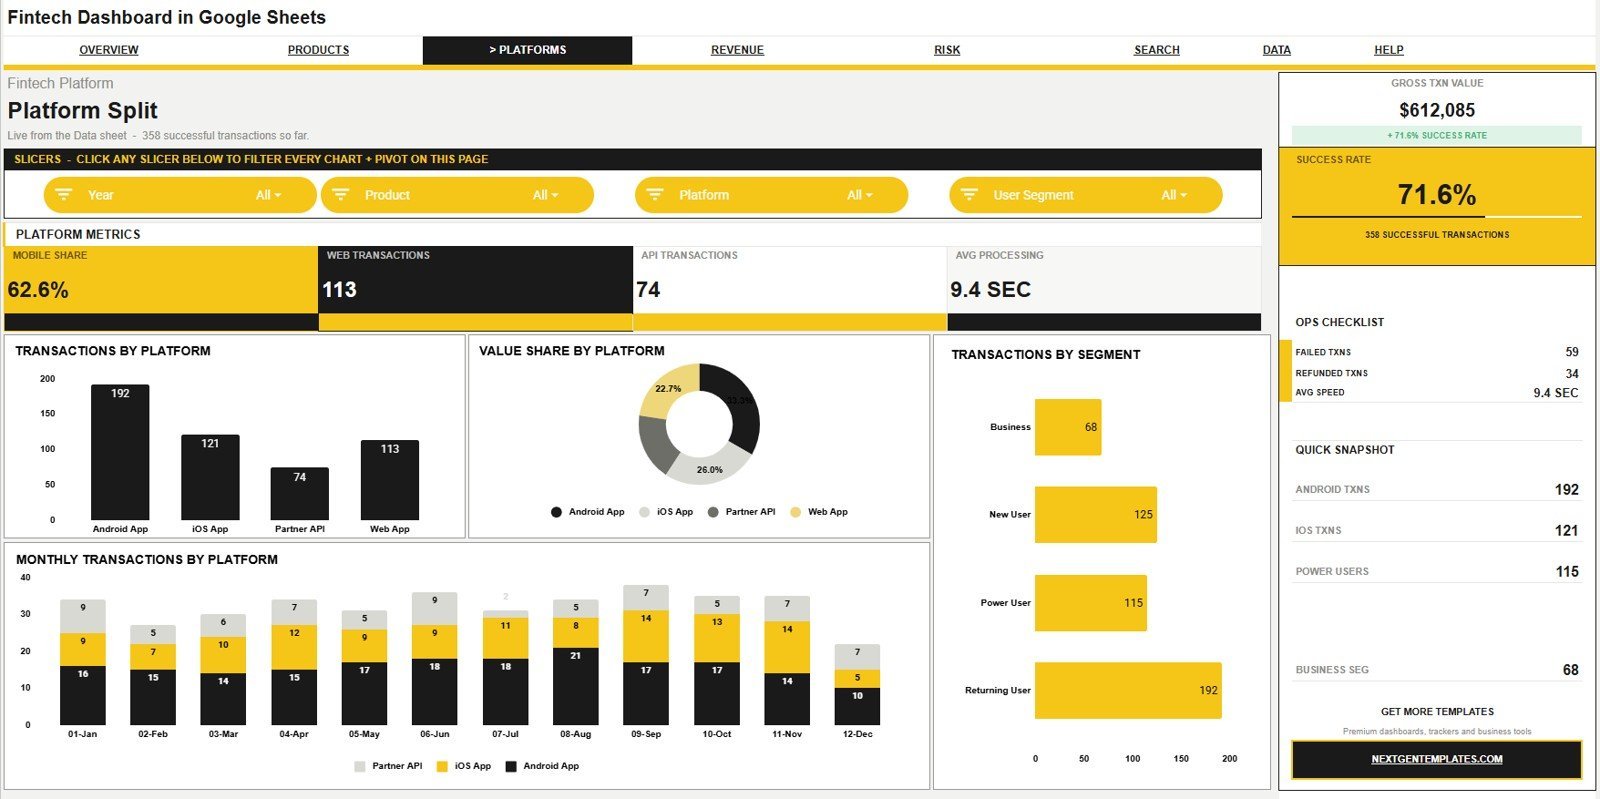
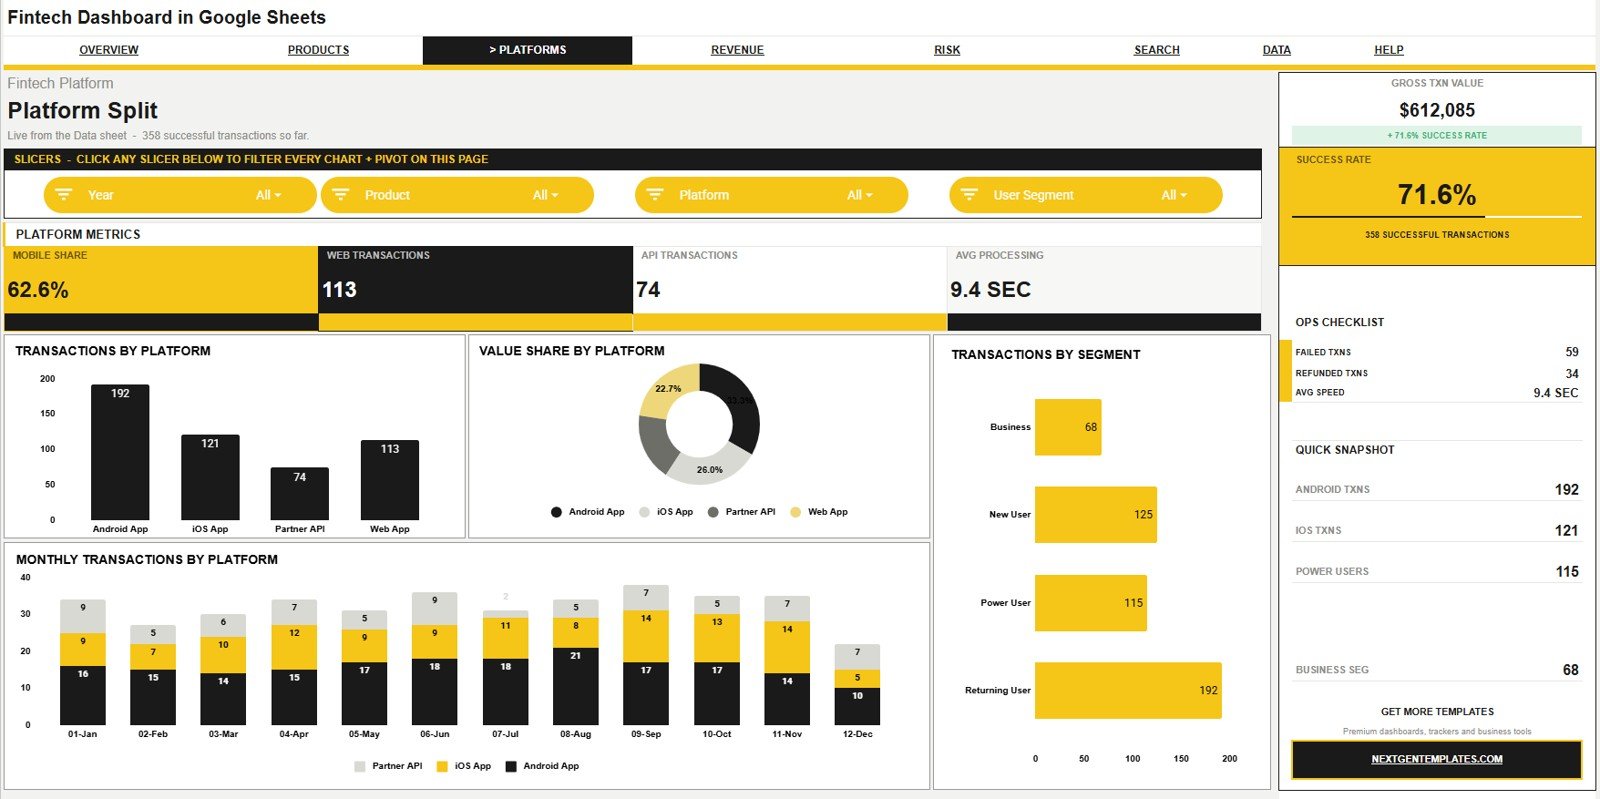
The Platform Split tab compares Transactions by Platform, Value Share by Platform, Transactions by User Segment, and Monthly Transactions by Platform. Use it to see whether web, mobile, API, partner, or other channels are carrying more volume and value.
Revenue Engine
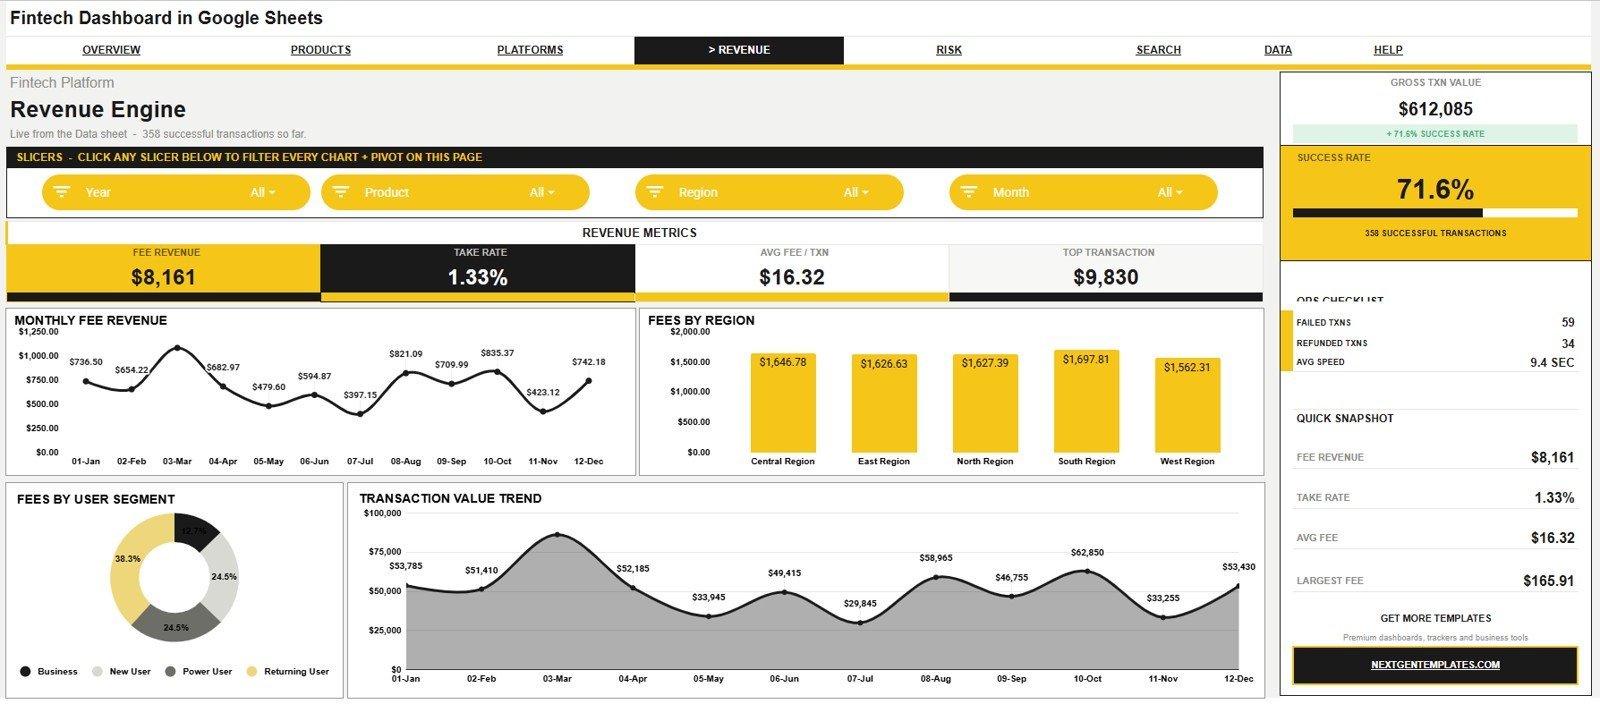
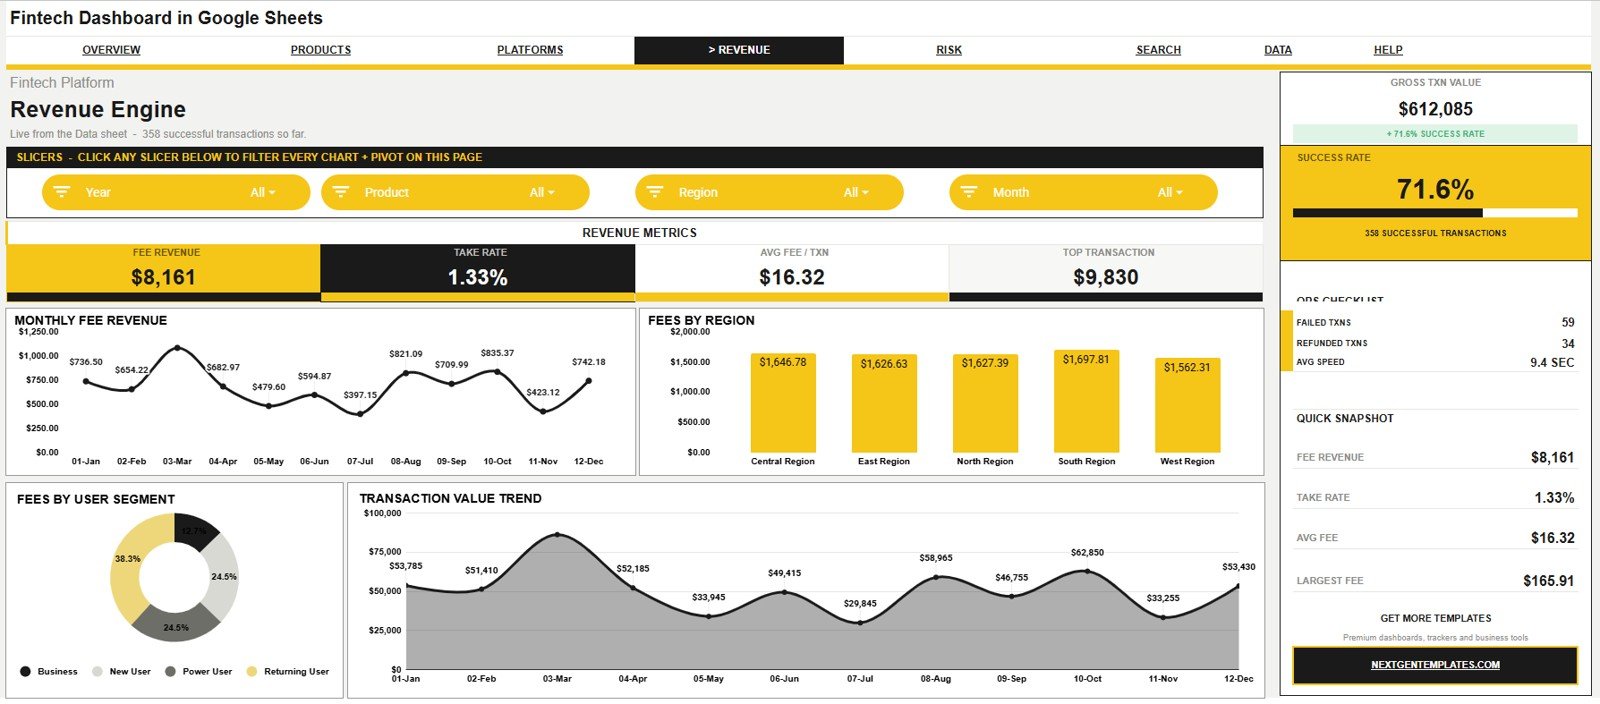
The Revenue Engine tab focuses on Monthly Fee Revenue by Month, Fees by Region, Fee Revenue by User Segment, and Transaction Value by Month. It connects transaction movement with revenue so the team can separate high-volume segments from high-fee segments.
Risk Center
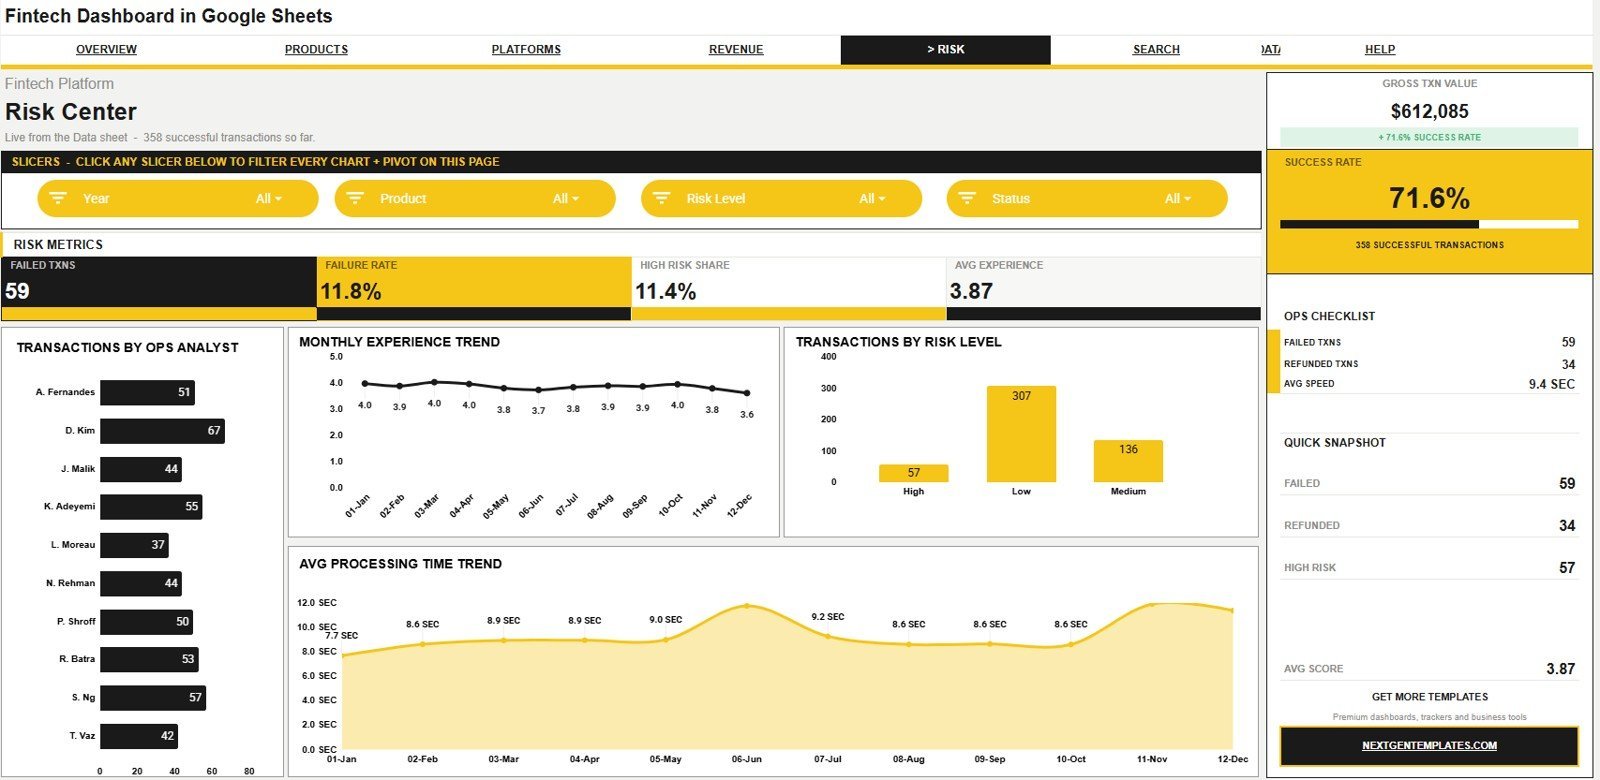
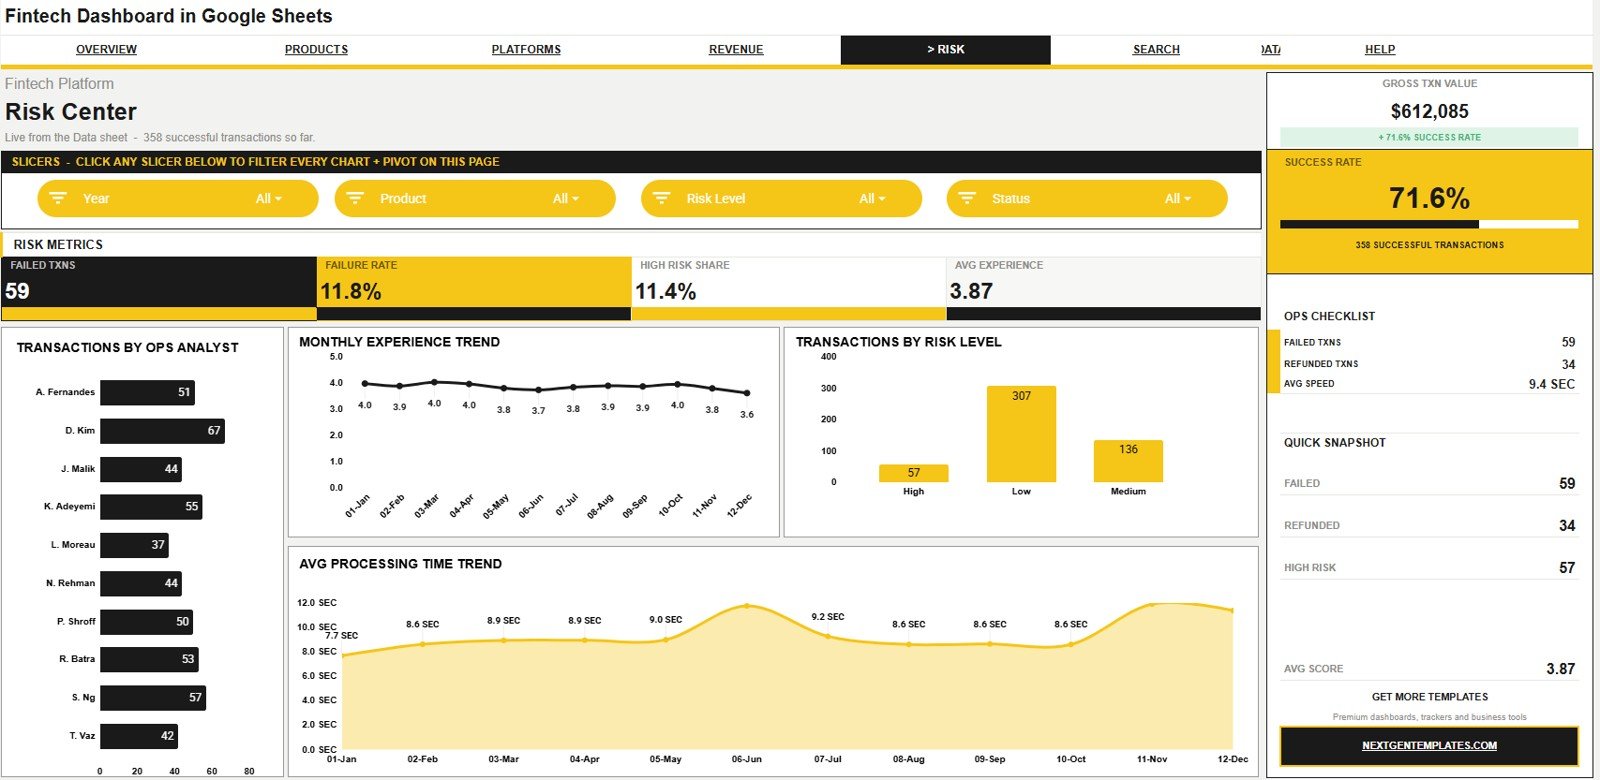
The Risk Center tab shows Transactions by Ops Analyst, Average Experience by Month, Transactions by Risk Level, and Average Processing Time by Month. It supports risk, support, and operations review by bringing analyst workload, user experience, risk mix, and processing speed into one page.
Search Sheet Tab
The Search Sheet is the Transaction Lookup sheet. Select a Txn ID to see the full transaction record, including product, region, platform, segment, status, risk level, ops analyst, value, fee revenue, processing time, and experience score.
Data Sheet Tab
The Data Sheet is the input layer. Add your own transaction data in the same format as the sample data so the slicers, cards, charts, and lookup sheet continue to work correctly.
Fintech Dashboard in Google Sheets vs. Microsoft Excel Dashboard vs. Paid Fintech SaaS – Where This Fits
| Feature | This Google Sheets dashboard | Microsoft Excel dashboard | Paid fintech SaaS or BI tool |
|---|---|---|---|
| Cost | $9.99 one-time sale price | Template cost plus Excel or Microsoft 365 access | Usually monthly or annual subscription |
| Platform | Google Sheets in browser and Drive | Excel desktop or web | Vendor cloud or enterprise BI stack |
| Setup time | Copy file, replace sample data, review slicers | Open workbook and configure sharing | Connector setup, vendor onboarding, or analyst build |
| Real-time team collaboration | Native Google Sheets sharing | Depends on OneDrive or SharePoint | Usually included by user role |
| Mobile access | Google Sheets app or mobile browser | Excel app or browser | Usually available |
| Customizable fields | Edit records, labels, products, regions, and segments | Editable, but formulas can be easier to break | Depends on admin permissions and plan |
| Share with link | Yes, through Google Drive | Yes, when saved to Microsoft cloud | Usually by seat or secure share link |
| Year-1 cost at 5 users | One-time template price, plus any Google Workspace plan already used | Template plus Microsoft licensing if needed | Can become hundreds or thousands of dollars per year |
| Transaction lookup | Included with Txn ID selector | Must be built or customized | Often available, but tied to vendor data model |
Who This Template Is For – and Who It’s Not For
This template is for fintech startups, payment operations teams, digital wallet teams, lending operations, banking analysts, finance analysts, founders, and consultants who need transaction reporting in Google Sheets. It is a good fit when the team already exports transaction records and wants a fast dashboard layer without a subscription tool.
It is not the right fit if you need live payment gateway connections, role-based audit logs, automated fraud decisions, bank-grade access controls, or real-time streaming analytics. In those cases, use a dedicated fintech data warehouse, BI tool, or risk platform.
How to Use the Fintech Dashboard in Google Sheets
- Open the copy guide included with your download.
- Create your own editable copy in Google Drive.
- Replace the sample records in the Data Sheet tab using the same column structure.
- Use slicers on the dashboard pages to filter by month, product, region, platform, segment, status, or risk level.
- Use the Search Sheet tab to inspect a single transaction by Txn ID.
- Review Overview, Product Mix, Platform Split, Revenue Engine, and Risk Center weekly or monthly.
Real-World Use Cases
A fintech founder reviewing weekly traction uses the Overview Page to monitor transaction value, transaction count, fee revenue, success rate, and monthly transaction movement before investor updates.
A payments operations lead uses Platform Split and Risk Center to compare transaction load by platform, risk level, analyst, processing time, and experience score.
A finance analyst at a digital wallet company uses Revenue Engine to connect fee revenue with regions, user segments, monthly value, and transaction growth.
Frequently Asked Questions
What does the Fintech Dashboard in Google Sheets track?
It tracks gross transaction value, total transactions, fee revenue, success rate, product mix, platform usage, region value, user segment revenue, risk levels, processing time, experience score, and transaction lookup details.
Can I customize the product and region names?
Yes. Replace the sample data with your own product, region, platform, user segment, status, risk, and analyst fields while keeping the same column structure.
Does the template connect directly to payment gateways?
No. It is a Google Sheets dashboard built for exported or manually pasted transaction records. Direct API connections would require a separate custom integration.
Is there a transaction lookup page?
Yes. The Search Sheet tab lets you select a Txn ID and see the full record for that transaction.
Does it work for mobile wallet, lending, and payment products?
Yes. The product and platform labels are editable, so the same dashboard can support wallets, cards, lending, payment links, remittances, merchant payments, or similar fintech products.
Is this a one-time purchase?
Yes. The product is priced as a one-time template purchase. There are no recurring subscription fees from NextGenTemplates for the file.
About the Author
Built by PK – Microsoft Certified Professional with 15+ years of Excel, Google Sheets, and Power BI experience. Founder of NextGenTemplates, reaching 300K+ subscribers across YouTube channels. Every template is hand-built and tested before release.
Explore Related Templates
- Browse Google Sheets templates for more spreadsheet-based business tools.
- Browse Google Sheets dashboard templates for more dashboard products.
- Blockchain and Cryptocurrency Dashboard in Google Sheets for crypto and blockchain metrics.
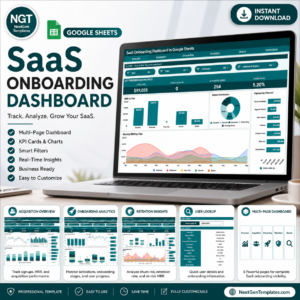
- SaaS Onboarding Dashboard in Google Sheets for signup, activation, and retention analysis.
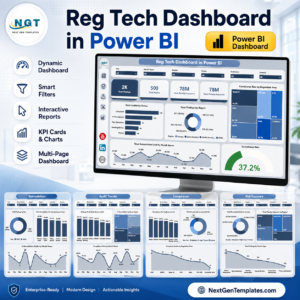
- Reg Tech Dashboard in Excel for compliance-focused reporting.
Download the Fintech Dashboard in Google Sheets to review transaction value, fee revenue, product mix, platform activity, revenue movement, risk, and transaction-level records in one editable Google Sheets file.
Watch the step-by-step video Demo:
Last updated: August 7, 2026.





























Reviews
There are no reviews yet.