
Knowledge Transfer Partnerships Dashboard in Power BI helps universities, business partners, project managers, innovation teams, and grant-funded program offices track KTP performance in one editable PBIX report. Instead of reviewing projects, budgets, actual spend, grant funding, milestones, innovation outputs, jobs created, partners, sectors, and regions in separate files, this dashboard brings the main signals into 5 Power BI pages, 4 headline KPI cards, multiple slicers, and focused visuals. It is a one-time downloadable template, includes sample reporting structure, and can be customized in Power BI Desktop for your own partnership portfolio.
Knowledge Transfer Partnerships Dashboard in Power BI
Key Features of Knowledge Transfer Partnerships Dashboard in Power BI
- 5 Power BI pages: Overview Page, Funding, Project Flow, Innovation, and Partners.
- Headline KPI cards: Total Projects, Total Budget, Total Actual Spend, and Total Grant Funding.
- Funding analysis: Review grant funding, funding leverage, budget, spend, project stage, region, year, and priority.
- Project flow tracking: Analyze milestone completion by stage and month, plus projects by priority.
- Innovation reporting: Track innovation outputs by knowledge area, region, and organization.
- Partner visibility: Compare projects, university partners, organizations, regions, budgets, and jobs created.
- Interactive slicers: Filter the report quickly during steering meetings and portfolio reviews.
- Editable PBIX file: Adjust visuals, fields, measures, colors, labels, and data connections in Power BI Desktop.
What’s Inside the Knowledge Transfer Partnerships Dashboard in Power BI
1. Overview Page
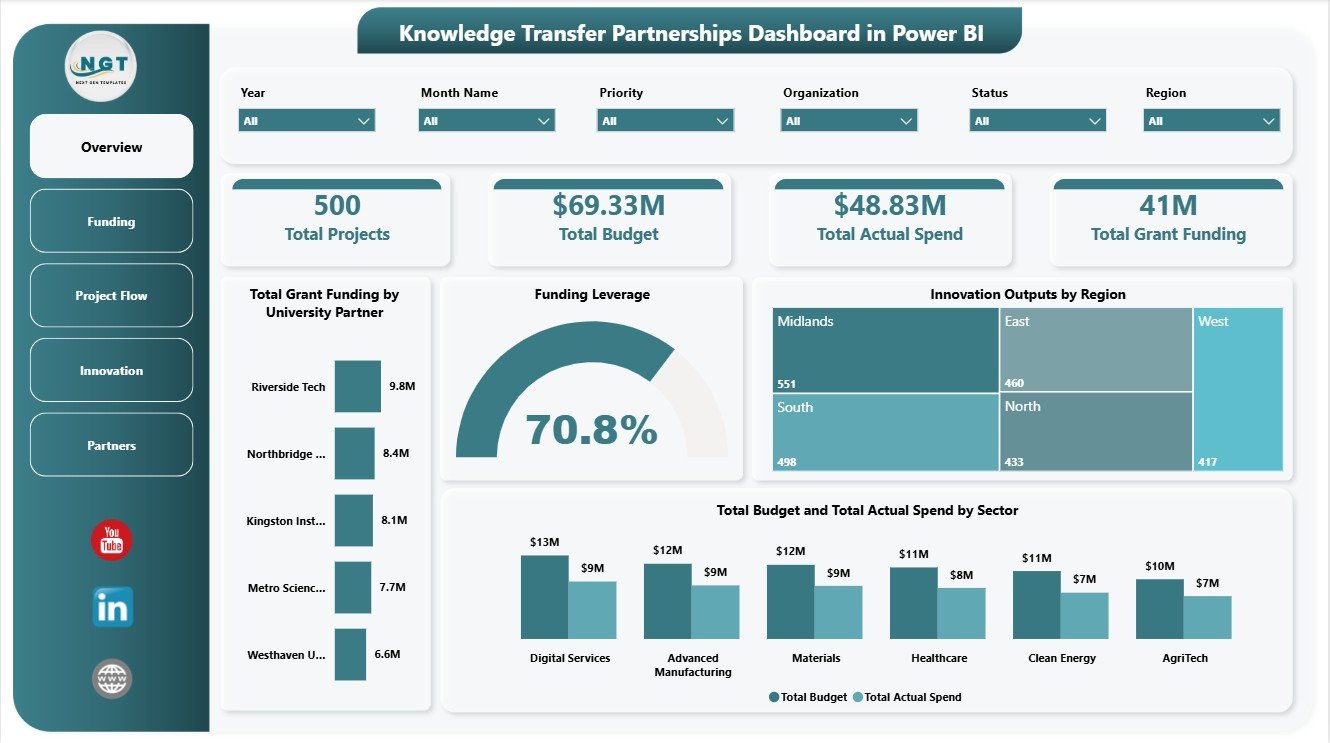
The Overview Page gives a high-level view of the KTP portfolio. The top cards show Total Projects, Total Budget, Total Actual Spend, and Total Grant Funding so leaders can understand portfolio scale, approved investment, delivered spend, and grant-backed support at a glance.
Total Grant Funding by University Partner: This chart compares grant funding across university partners. It helps program teams see which academic partners are connected with the highest funding value.
Funding Leverage by Overall Projects: This visual links leverage with the wider project base. It helps decision-makers assess whether project volume is translating into strong funding leverage.
Innovation Outputs by Region: This chart shows where outputs are being generated geographically. It supports regional impact reporting and highlights locations with stronger innovation delivery.
Total Budget and Total Actual Spend by Sector: This comparison shows budget and spend by sector. It helps finance and program teams identify sectors where actual spend is tracking above or below planned funding.
2. Funding
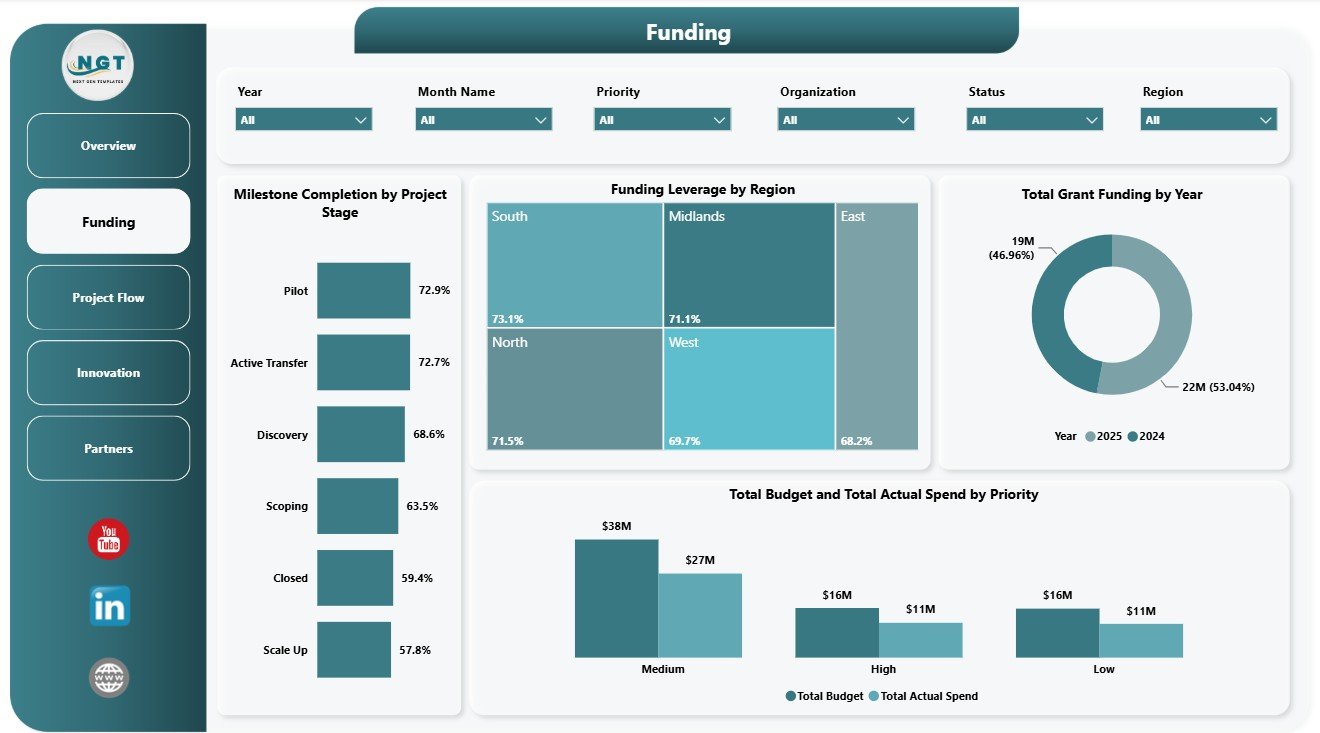
The Funding page focuses on how money is allocated, leveraged, and used across stages, regions, years, and priorities. Milestone Completion by Project Stage shows delivery progress by stage, helping managers understand where projects are moving smoothly or slowing down.
Funding Leverage by Region compares leverage across operating regions. Total Grant Funding by Year shows how grant support changes over time, while Total Budget and Total Actual Spend by Priority helps teams review whether strategic priorities are receiving and using the right level of investment.
Funding
3. Project Flow
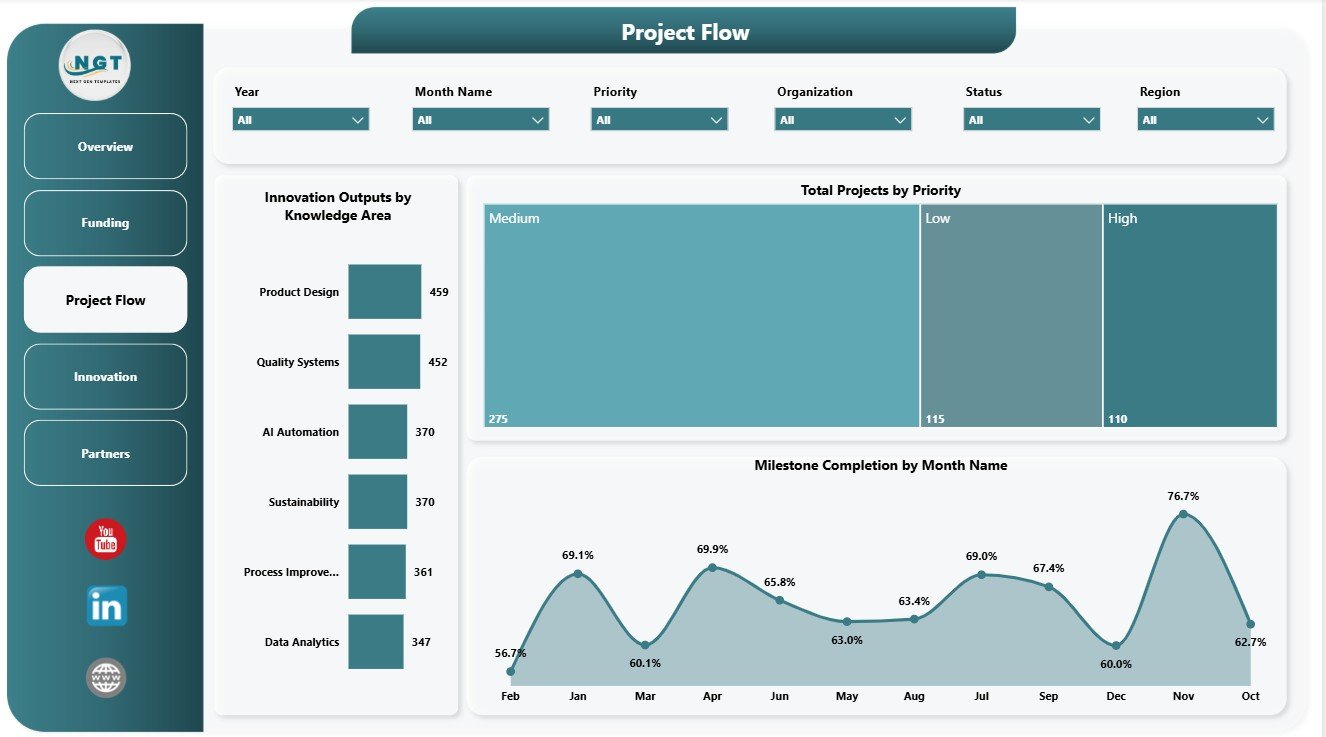
The Project Flow page explains how KTP work is progressing through knowledge areas, priorities, and monthly milestones. Innovation Outputs by Knowledge Area shows which research or knowledge themes are producing the most outputs.
Total Projects by Priority helps leaders see whether the portfolio is balanced across strategic priorities. Milestone Completion by Month Name tracks monthly completion behavior so teams can spot delivery peaks, delays, and follow-up periods.
Project Flow
4. Innovation
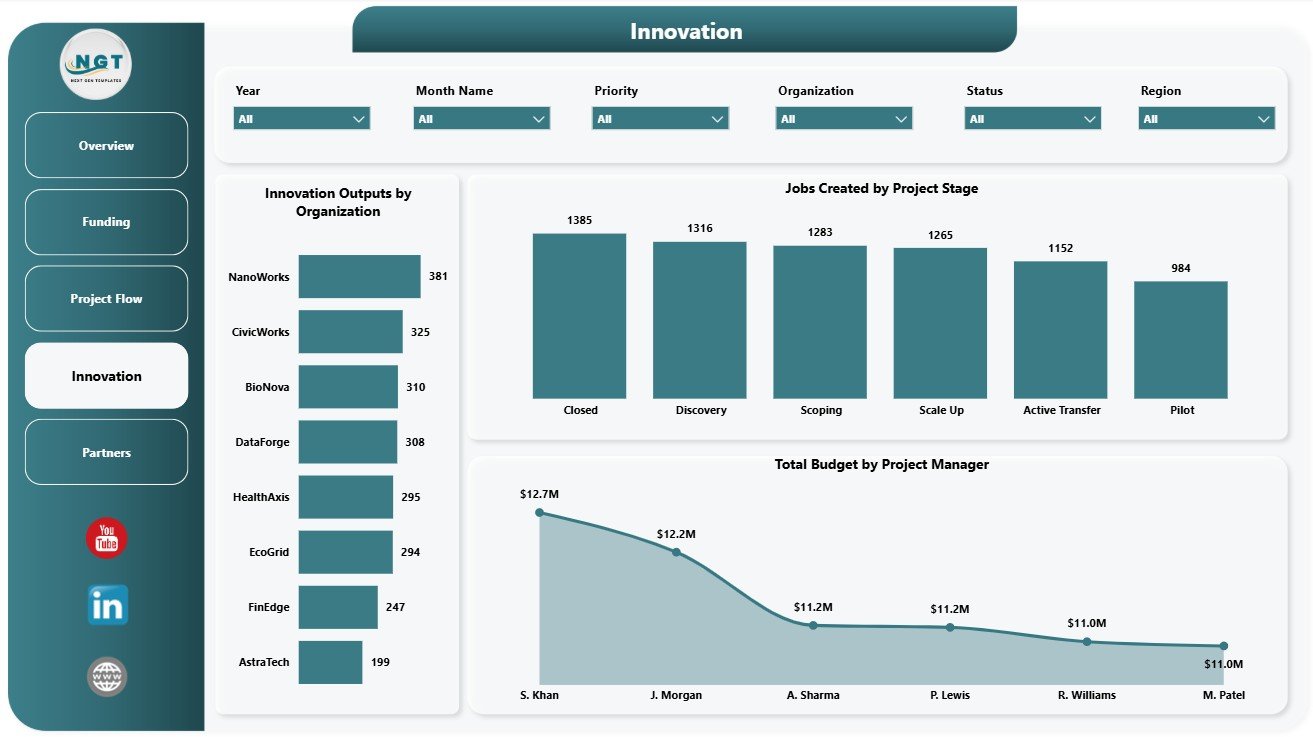
The Innovation page connects project activity with outputs, jobs, and management accountability. Innovation Outputs by Organization compares output volume across participating organizations and shows which partners are contributing strongly.
Jobs Created by Project Stage connects employment impact with project maturity. Total Budget by Project Manager helps review portfolio ownership, budget responsibility, and manager-level funding distribution.
Innovation
5. Partners
The Partners page supports relationship and impact review across regions, university partners, and organizations. Total Projects by Region shows where partnership activity is concentrated and where coverage may need attention.
Total Budget by University Partner compares budget allocation across academic partners. Jobs Created by Organization highlights employment impact by partner organization and helps demonstrate practical outcomes from the KTP portfolio.
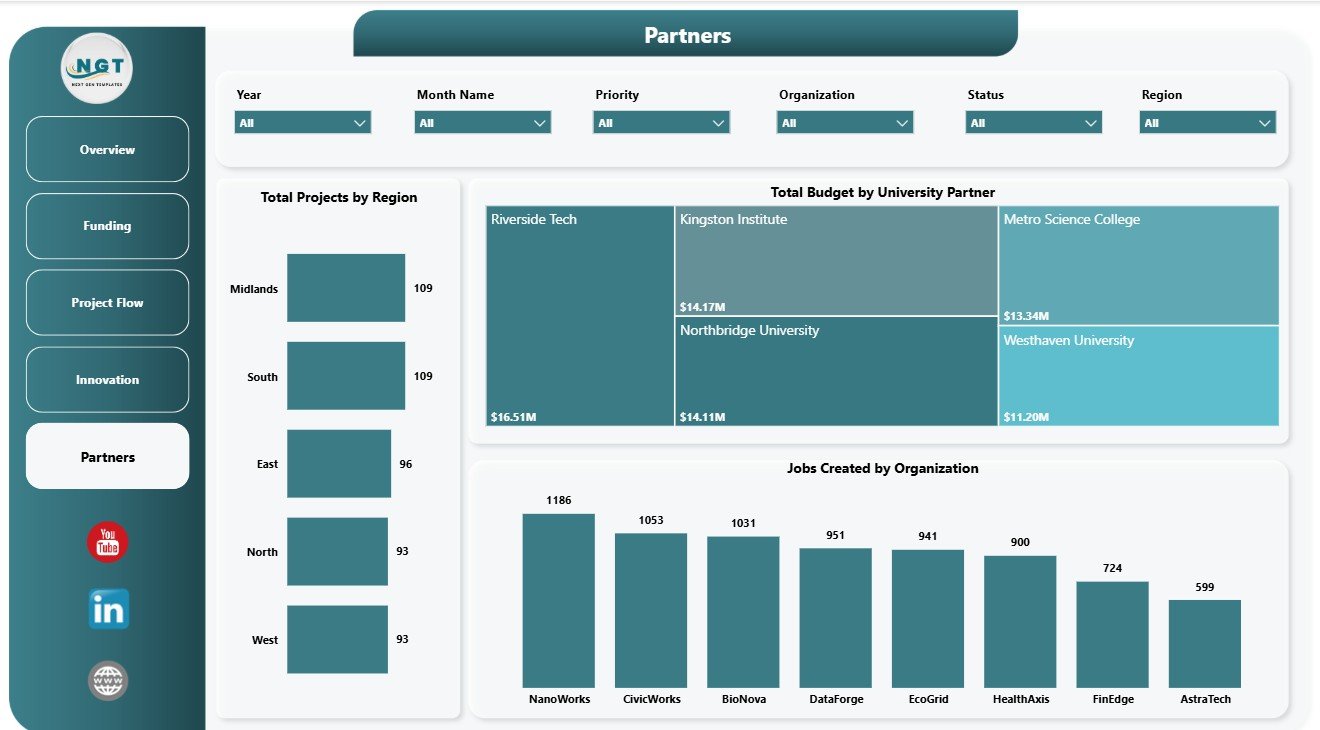
Partners
Knowledge Transfer Partnerships Dashboard in Power BI vs. Tableau vs. Paid CRM/SaaS – Where This Fits
| Feature | This Power BI dashboard | Tableau alternative | Paid project SaaS |
|---|---|---|---|
| Cost | $17.99 one-time template | License plus build time | Monthly or annual subscription |
| Platform | Power BI Desktop / Power BI Service | Tableau Desktop or Cloud | Vendor cloud platform |
| Setup time | Open PBIX, replace data, refresh | Build workbook and model | Configuration and onboarding |
| Customizable fields | Editable visuals, fields, measures, and slicers | Editable with Tableau skills | Depends on admin permissions |
| KTP reporting fit | Projects, budgets, spend, grants, milestones, outputs, jobs, and partners included | Must be designed | Often not KTP-specific |
| Year-1 cost at 5 users | $17.99 plus any Microsoft licensing | Usually higher license or development cost | Often hundreds or thousands |
Who This Template Is For – and Who It’s Not For
This template is for KTP managers, university partnership teams, innovation offices, business engagement teams, grant administrators, research commercialization teams, PMO analysts, and consultants who need a ready Power BI reporting structure for partnership performance. It works best when your data is already structured by project, partner, region, sector, stage, priority, budget, spend, grant funding, milestone status, innovation outputs, and jobs created.
It is not a grant application portal, CRM, accounting system, contract management system, or automated research impact tool. Use it as an analytics and reporting dashboard after your source data has been prepared.
How to Use the Knowledge Transfer Partnerships Dashboard in Power BI
- Download and unzip the product file.
- Open the PBIX file in Power BI Desktop.
- Review the Overview, Funding, Project Flow, Innovation, and Partners pages.
- Replace the sample source with your own KTP data using a similar field structure.
- Refresh the report and validate cards, slicers, and visual totals.
- Customize visuals, colors, fields, and measures before sharing internally.
Real-World Use Cases
Priya, KTP program manager: reviews milestone completion, project stage, and priority views before monthly steering meetings.
Daniel, university partnerships lead: compares grant funding and budget by university partner to prepare academic partner reviews.
Aisha, innovation impact analyst: uses outputs, jobs created, regions, and organizations to prepare impact reporting for leadership.
Frequently Asked Questions
What is included in this Power BI dashboard?
The PBIX includes 5 report pages, KPI cards, slicers, and visuals for projects, budgets, actual spend, grant funding, milestones, innovation outputs, jobs, regions, sectors, organizations, university partners, and project managers.
Do I need Power BI Desktop?
Yes. Open and edit the PBIX file in Power BI Desktop. Sharing through Power BI Service may require Microsoft licensing.
Can I replace the sample data?
Yes. Replace the sample source with your own structured KTP data, refresh the report, and validate the totals.
Can I customize the visuals?
Yes. You can edit charts, slicers, pages, measures, labels, colors, and data connections.
Is this a project management system?
No. It is a reporting dashboard template, not a task management, grant workflow, or accounting system.
Can it support university and business partner reporting?
Yes. The Partners, Funding, and Innovation pages are designed to compare university partners, organizations, jobs created, outputs, regions, and funding.
About the Author
Built by PK – Microsoft Certified Professional with 15+ years of Excel, Google Sheets, and Power BI experience. Founder of NextGenTemplates, reaching 300K+ subscribers across YouTube channels. Every template is hand-built and tested before release.
Explore Related Templates
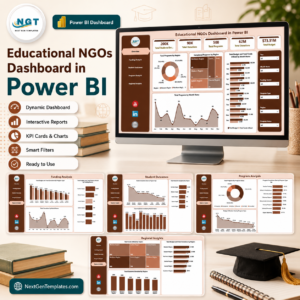
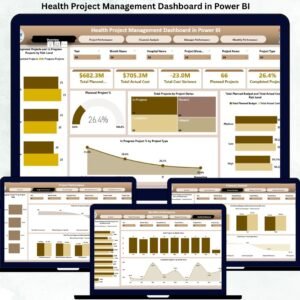
You may also like Educational NGOs Dashboard in Power BI, Health Project Management Dashboard in Power BI, and Knowledge Hubs Dashboard in Power BI. Browse more Power BI templates and Power BI dashboard templates.
Download the Knowledge Transfer Partnerships Dashboard in Power BI today and turn partnership projects, funding, milestones, outputs, jobs, and partner activity into an interactive report.
Last updated: June 29, 2026.


Reviews
There are no reviews yet.