

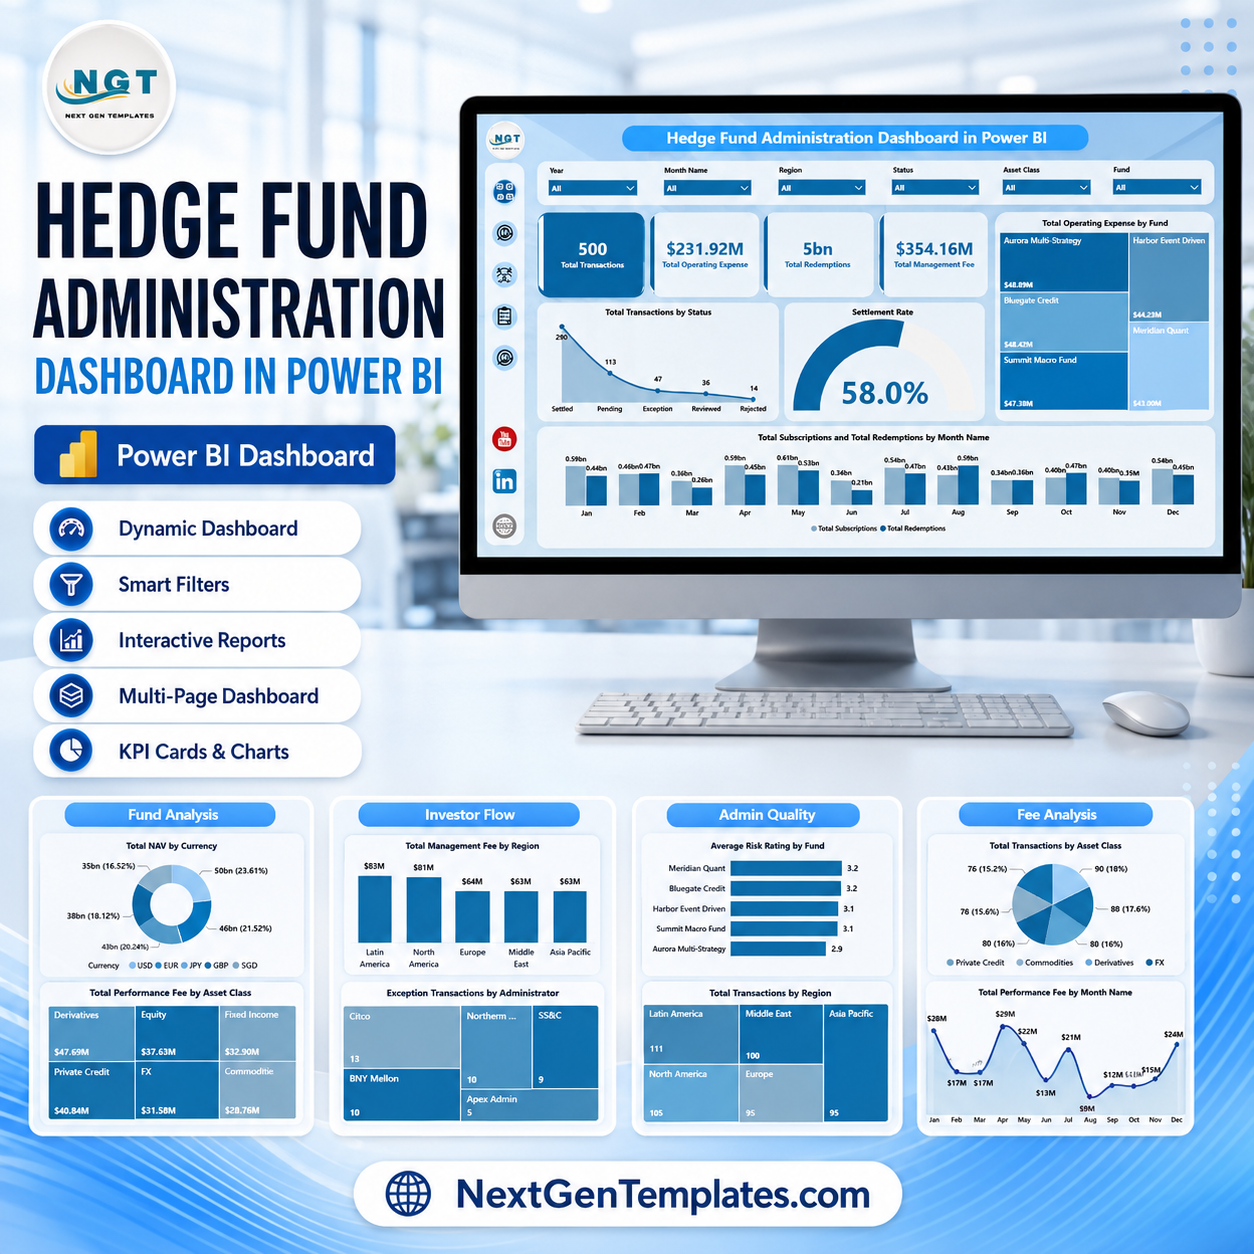

Hedge Fund Administration Dashboard in Power BI gives fund administrators, CFO teams, operations analysts, investor services teams, and finance consultants a ready-to-use PBIX report for tracking Total Transactions, Total Operating Expense, Total Redemptions, Total Management Fee, settlement performance, NAV, subscriptions, redemptions, fees, funds, regions, asset classes, and investor segments. Instead of rebuilding fund operations reporting from a blank Power BI canvas, open the file in Power BI Desktop, connect or replace the sample source, refresh, and review the dashboard through slicers and dedicated analysis pages. Join 10,000+ customers in 180+ countries using NextGenTemplates to replace recurring dashboard builds with one-time-purchase Excel, Google Sheets, Power BI, and HTML templates.
Key Features of Hedge Fund Administration Dashboard in Power BI
- Power BI report pages for Overview, Fund Analysis, Investor Flow, and Fee Analysis.
- 4 executive KPI cards for Total Transactions, Total Operating Expense, Total Redemptions, and Total Management Fee.
- Interactive slicers to filter the report quickly by available fund, investor, region, status, month, strategy, currency, and asset-class fields.
- Transaction monitoring using status breakdowns and settlement-rate visuals.
- Fund-level analysis for NAV, operating expense, management fee, performance fee, subscriptions, and redemptions.
- Investor flow reporting by segment, strategy, quarter, month, and region.
- Editable PBIX file so analysts can adjust visuals, measures, labels, fields, colors, and report pages in Power BI Desktop.
What’s Inside the Hedge Fund Administration Dashboard in Power BI
1. Overview Page
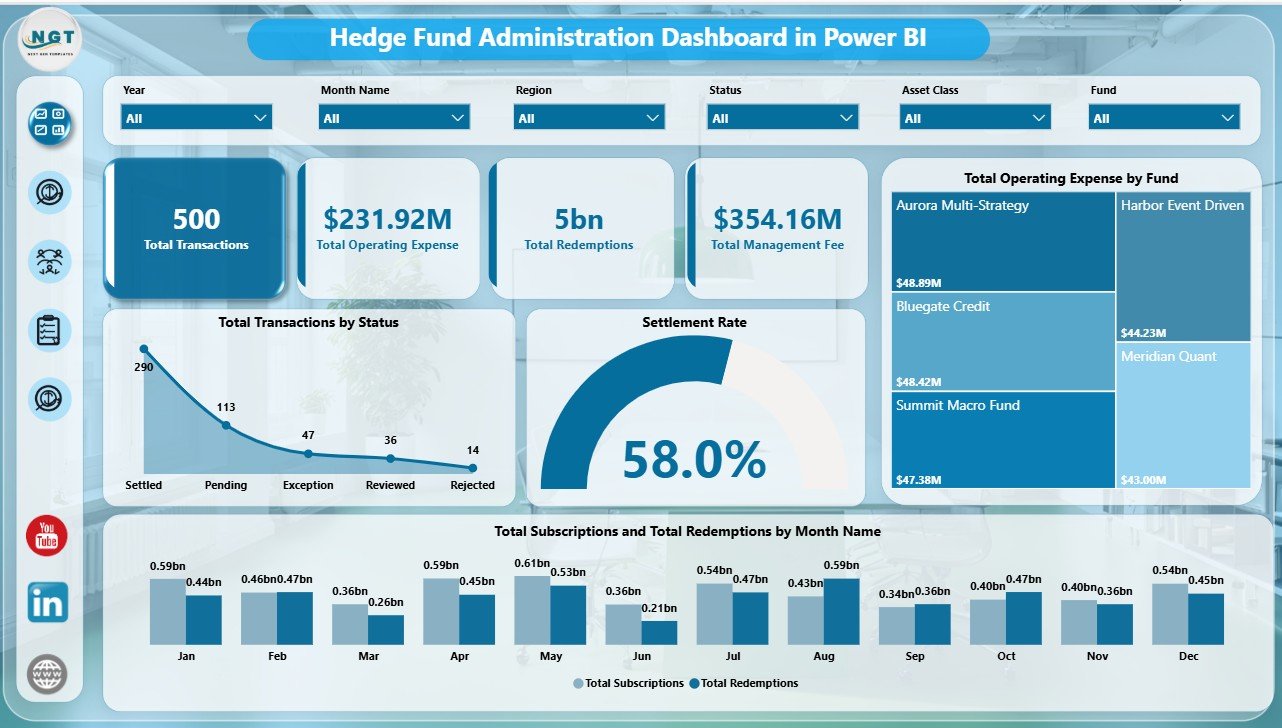
The Overview page gives a high-level fund administration snapshot. The top cards show Total Transactions, Total Operating Expense, Total Redemptions, and Total Management Fee so leadership can review activity volume, cost pressure, investor outflows, and recurring fee scale in one view.
Total Transactions by Status shows how transactions are distributed across processing states and helps teams spot pending, completed, rejected, or exception-heavy areas. Settlement Rate by Overall Transactions adds process-quality context by showing how effectively transaction activity is settling. Total Operating Expense by Fund compares expense pressure across funds, while Total Subscriptions and Total Redemptions by Month Name shows monthly investor flow movement.
2. Fund Analysis
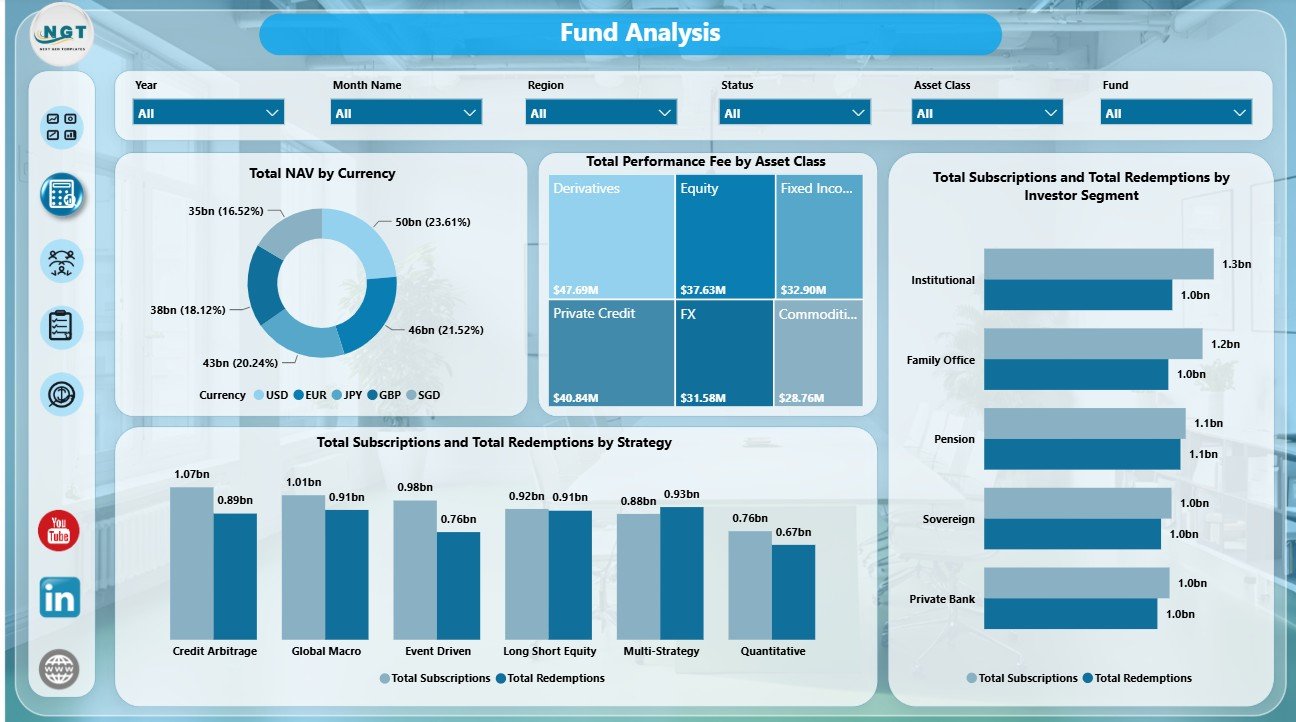
The Fund Analysis page focuses on portfolio value, fee generation, and capital-flow behavior. Total NAV by Currency shows currency-level exposure, Total Performance Fee by Asset Class identifies fee contribution by investment type, Total Subscriptions and Total Redemptions by Investor Segment explains capital movement by investor group, and Total Subscriptions and Total Redemptions by Strategy compares flow patterns across strategies.
3. Investor Flow
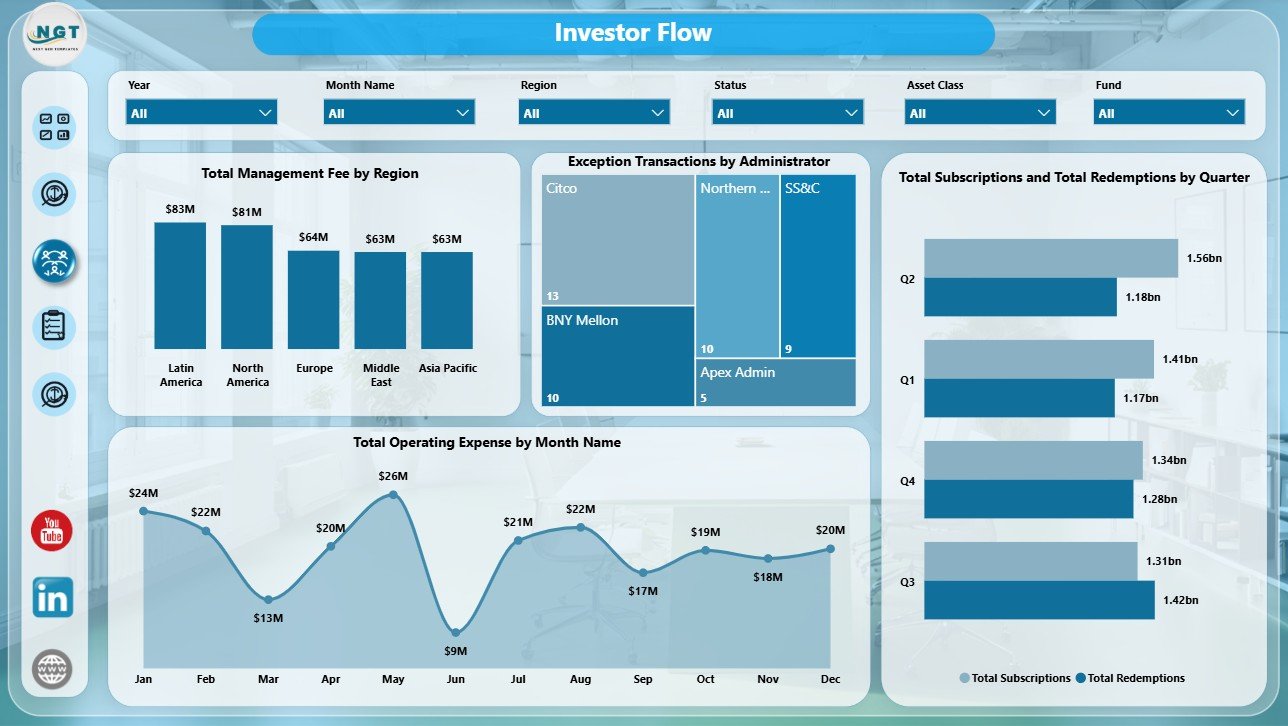
The Investor Flow page connects regional fees, administrator exceptions, quarterly subscriptions and redemptions, and monthly operating expense. It helps operations and investor services teams understand where capital movement, administration workload, and process issues are concentrated.
Total Management Fee by Region shows which regions contribute the most management fee. Exception Transactions by Administrator highlights processing ownership and follow-up areas. Total Subscriptions and Total Redemptions by Quarter summarizes capital movement across quarters, and Total Operating Expense by Month Name tracks cost trend changes over time.
4. Fee Analysis
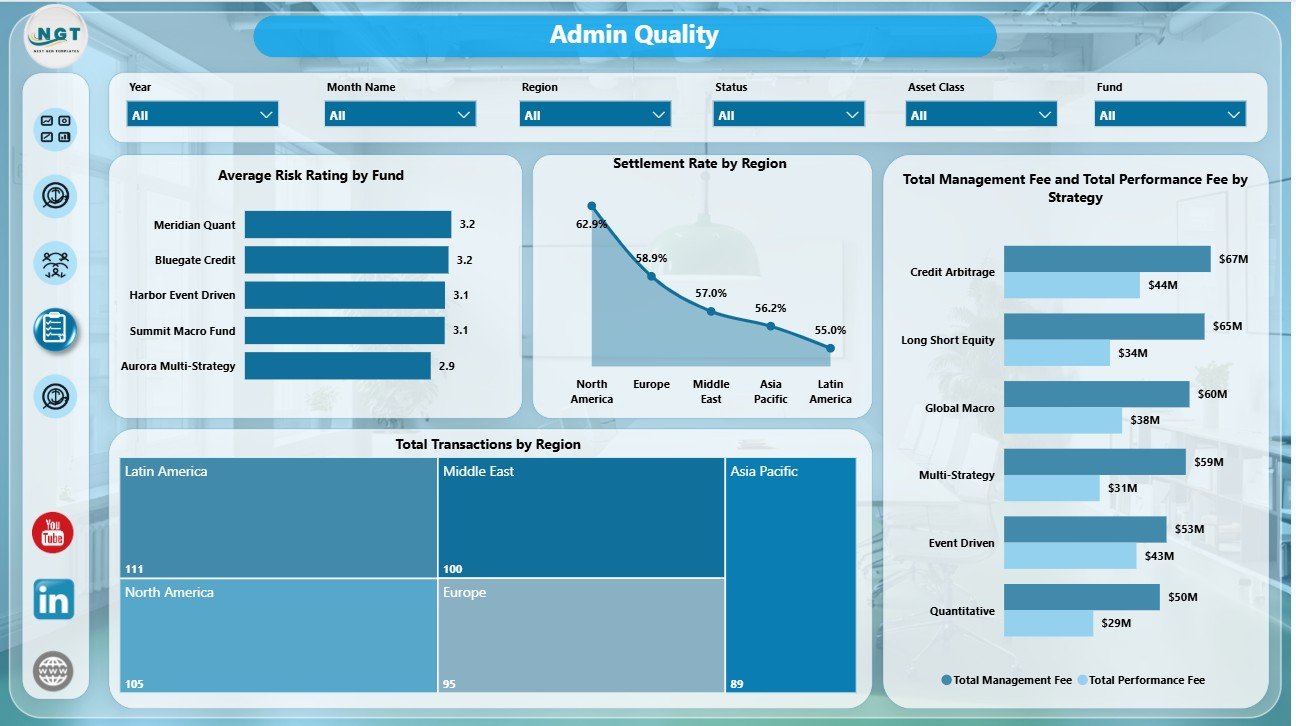
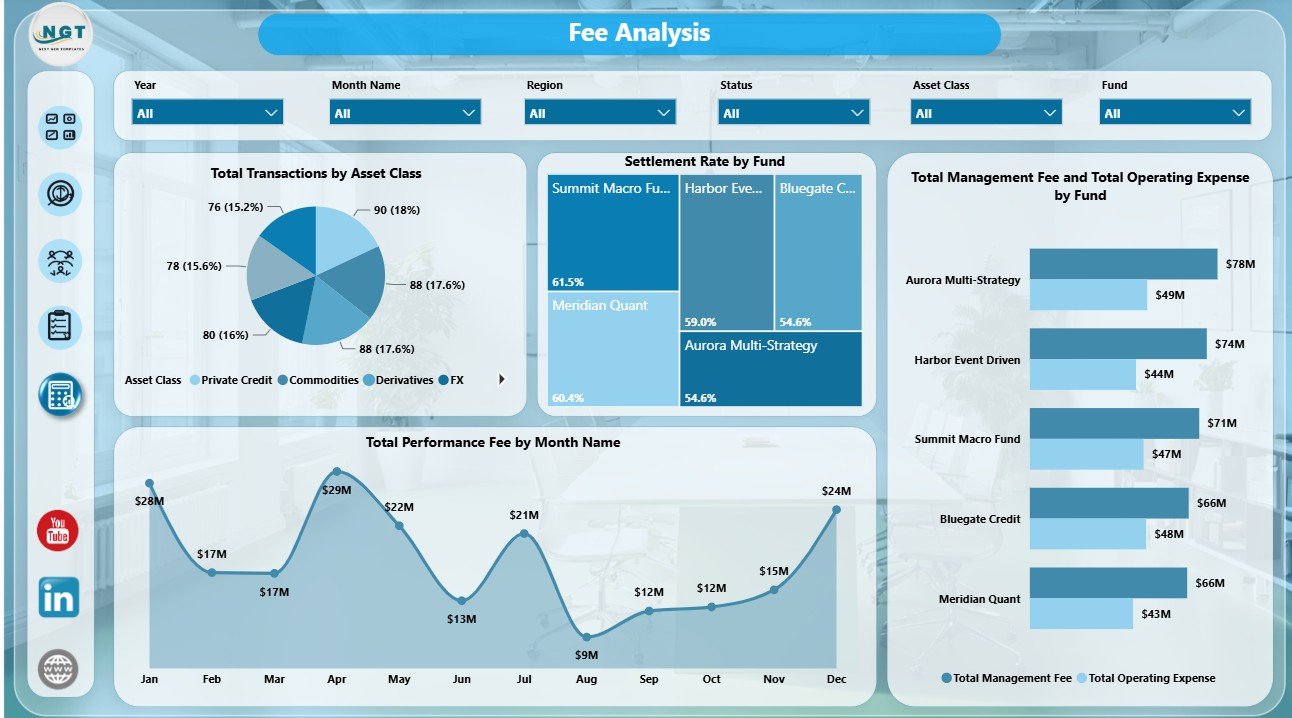
The Fee Analysis page is built for finance, fund accounting, and month-end review. Total Transactions by Asset Class explains activity by investment type, Settlement Rate by Fund compares processing quality across funds, Total Management Fee and Total Operating Expense by Fund shows fee-versus-cost pressure, and Total Performance Fee by Month Name tracks incentive-fee movement over time.
Hedge Fund Administration Dashboard in Power BI vs. Tableau vs. Paid Fund Admin SaaS – Where This Fits
| Feature | This Power BI Dashboard | Tableau Alternative | Paid Fund Admin SaaS |
|---|---|---|---|
| Cost | $17.99 one-time | License plus report build time | Monthly or annual subscription |
| Platform | Power BI Desktop and Power BI Service | Tableau Desktop or Cloud | Vendor cloud platform |
| Setup time | Open PBIX, connect data, refresh | Build model and visuals manually | Implementation and onboarding |
| Collaboration | Available through Power BI Service licensing | Available through Tableau publishing | Usually included by plan |
| Customizable fields | Editable visuals, measures, pages, and fields | Editable if you own the workbook | Limited by vendor permissions |
| Year-1 cost at 5 users | $17.99 plus Microsoft licensing if needed | License cost plus build time | Often hundreds or thousands |
| Fund administration views | Included across report pages | Requires custom design | Depends on module |
Who This Template Is For – and Who It’s Not For
This template is for hedge fund administrators, fund accounting teams, CFO and COO teams, investor relations analysts, operations managers, boutique fund consultants, and Power BI users who need a reusable analytics layer for transactions, fees, investor flows, expense, settlement, NAV, fund, strategy, and asset-class reporting.
It is not a live portfolio accounting system, investor portal, trade order management system, regulatory filing platform, or automated custodian reconciliation tool. It works best when you already have structured source data and want a clean Power BI report for recurring review.
How to Use the Hedge Fund Administration Dashboard in Power BI
- Download and unzip the product file.
- Open the PBIX file in Power BI Desktop.
- Use Transform Data to connect or replace the sample source with your own fund administration data.
- Click Refresh to update cards, charts, slicers, and report pages.
- Use slicers to review Overview, Fund Analysis, Investor Flow, and Fee Analysis from different angles.
- Publish to Power BI Service if your team wants shared online access.
Real-World Use Cases
A fund administration manager uses the Overview page to review transaction volume, settlement rate, redemptions, and operating expense before a weekly operations meeting.
A hedge fund CFO checks Fee Analysis to compare management fee, performance fee, operating expense, transaction mix, and settlement rate by fund.
An investor relations analyst uses Fund Analysis and Investor Flow to explain subscription and redemption movement by quarter, month, investor segment, and strategy.
Frequently Asked Questions
What does this Power BI dashboard track?
It tracks transactions, operating expense, redemptions, management fee, settlement rate, NAV, performance fee, subscriptions, redemptions, investor segments, strategies, regions, funds, asset classes, administrators, and time periods.
Do I need Power BI Desktop?
Yes. Power BI Desktop is needed to open, refresh, and customize the PBIX file. Power BI Service is optional for publishing and sharing.
Can I customize the dashboard?
Yes. The PBIX file is editable, so you can adjust visuals, measures, fields, slicers, colors, labels, and report pages.
Is this a complete fund administration platform?
No. It is an analytics dashboard template, not an investor portal, accounting system, custody reconciliation system, or regulatory filing tool.
Is this a subscription?
No. This is a one-time purchase from NextGenTemplates. Microsoft licensing is separate if you publish or share through Power BI Service.
About the Author
Built by PK – Microsoft Certified Professional with 15+ years of Excel, Google Sheets, and Power BI experience. Founder of NextGenTemplates, reaching 300K+ subscribers across YouTube channels. Every template is hand-built and tested before release.
Explore Related Templates
Explore more Power BI Dashboard templates and Financial Tools templates. You may also like the Hedge Fund Administration Dashboard in Excel, Hedge Funds KPI Dashboard in Power BI, VC Portfolio Dashboard in Power BI, and Credit Union Dashboard in Power BI.
Download the Hedge Fund Administration Dashboard in Power BI to review fund transactions, expenses, redemptions, fees, settlement quality, NAV, and investor flows in an editable PBIX report.
Last updated: June 19, 2026.
Watch the step-by-step video tutorial:
Compatibility and Requirements
- Works in Power BI Desktop, which is free. Power BI Service is optional for publishing and sharing.
- Microsoft explains how to install it in Get Power BI Desktop.
































Reviews
There are no reviews yet.