

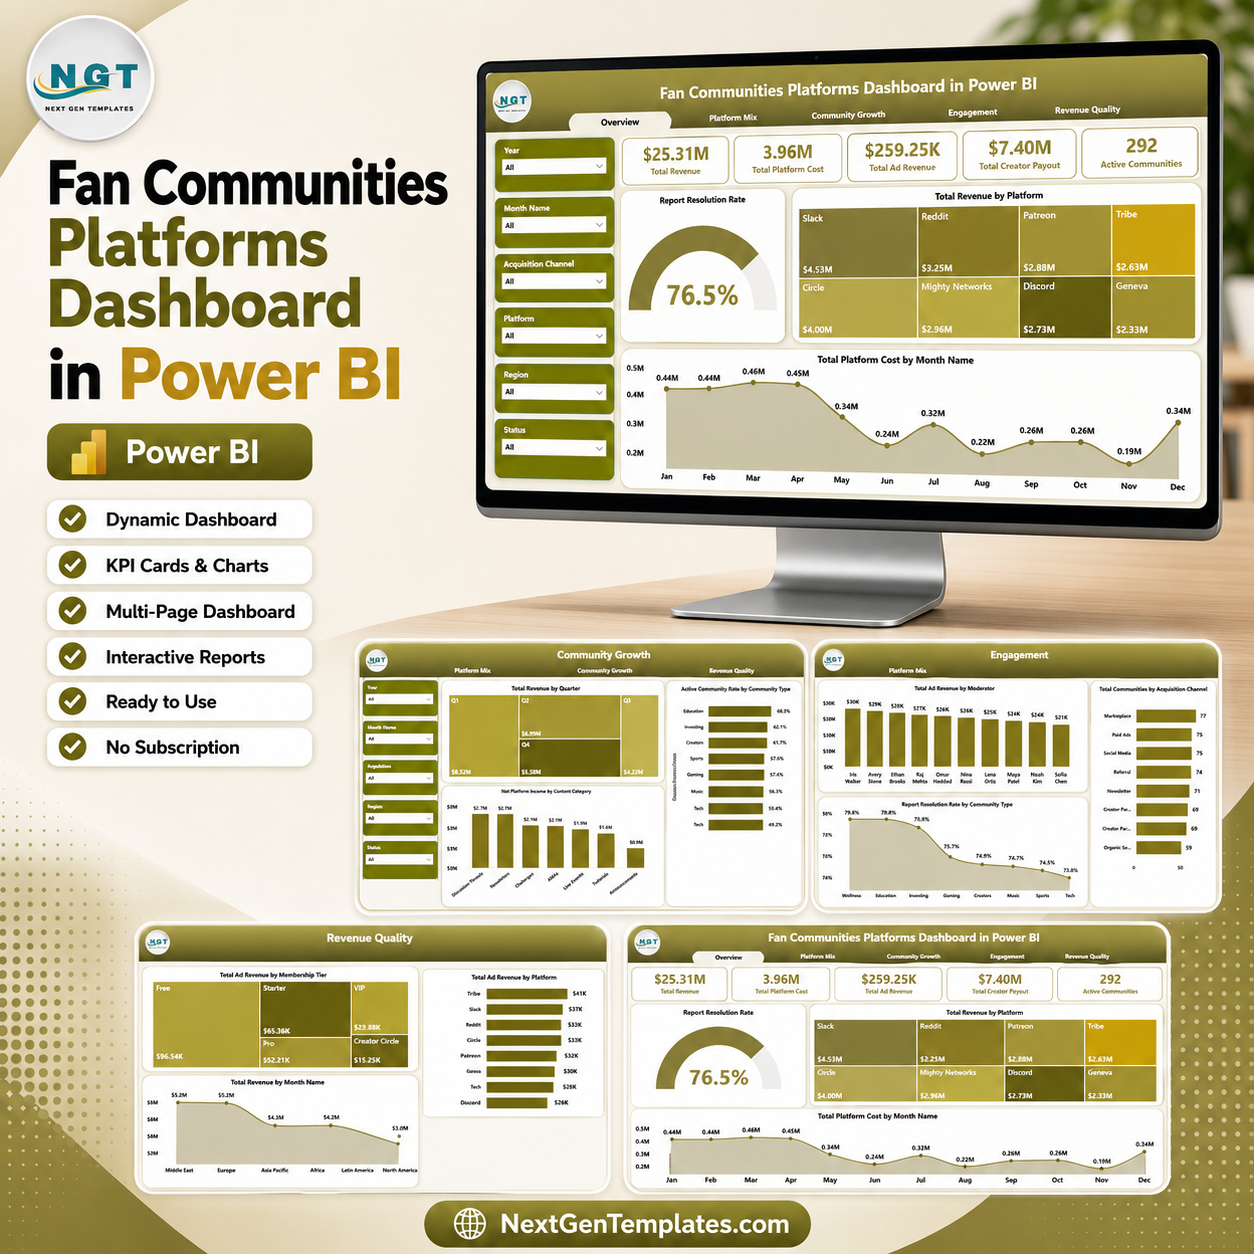


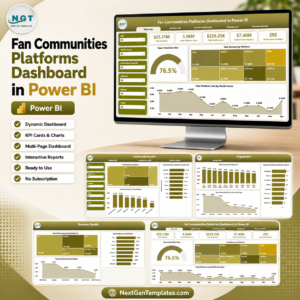
Fan Communities Platforms Dashboard in Power BI gives creator economy teams, community managers, membership operators, and platform analysts a ready .pbix reporting template with 4 Power BI pages, 5 executive KPI cards, 12 analytical visuals, and slicer-based filtering. For $17.99 one-time, users can review revenue, platform cost, ad revenue, creator payout, active communities, acquisition channels, community growth, engagement, moderators, and report resolution without building a report model from zero. Built by PK, Microsoft Certified Professional with 15+ years of Excel, Google Sheets, and Power BI experience and 300K+ YouTube subscribers, this dashboard is designed for faster reviews, clear platform reporting, and editable Power BI analysis.
Key Features of Fan Communities Platforms Dashboard in Power BI
- 4 Power BI report pages covering Overview, Platform Mix, Community Growth, and Engagement.
- 5 high-level KPI cards for Total Revenue, Total Platform Cost, Total Ad Revenue, Total Creator Payout, and Active Communities.
- Overview analytics for report resolution rate, total revenue by platform, and total platform cost by month name.
- Platform mix analysis by acquisition channel, platform, and monthly revenue movement.
- Community growth views by quarter, community type, and content category.
- Engagement reporting by moderator, acquisition channel, and community type.
- Multiple slicers help users filter the dashboard quickly during stakeholder reviews.
- Editable .pbix file for adjusting visuals, fields, colors, and Power BI pages.
What’s Inside the Fan Communities Platforms Dashboard in Power BI
1. Overview Page
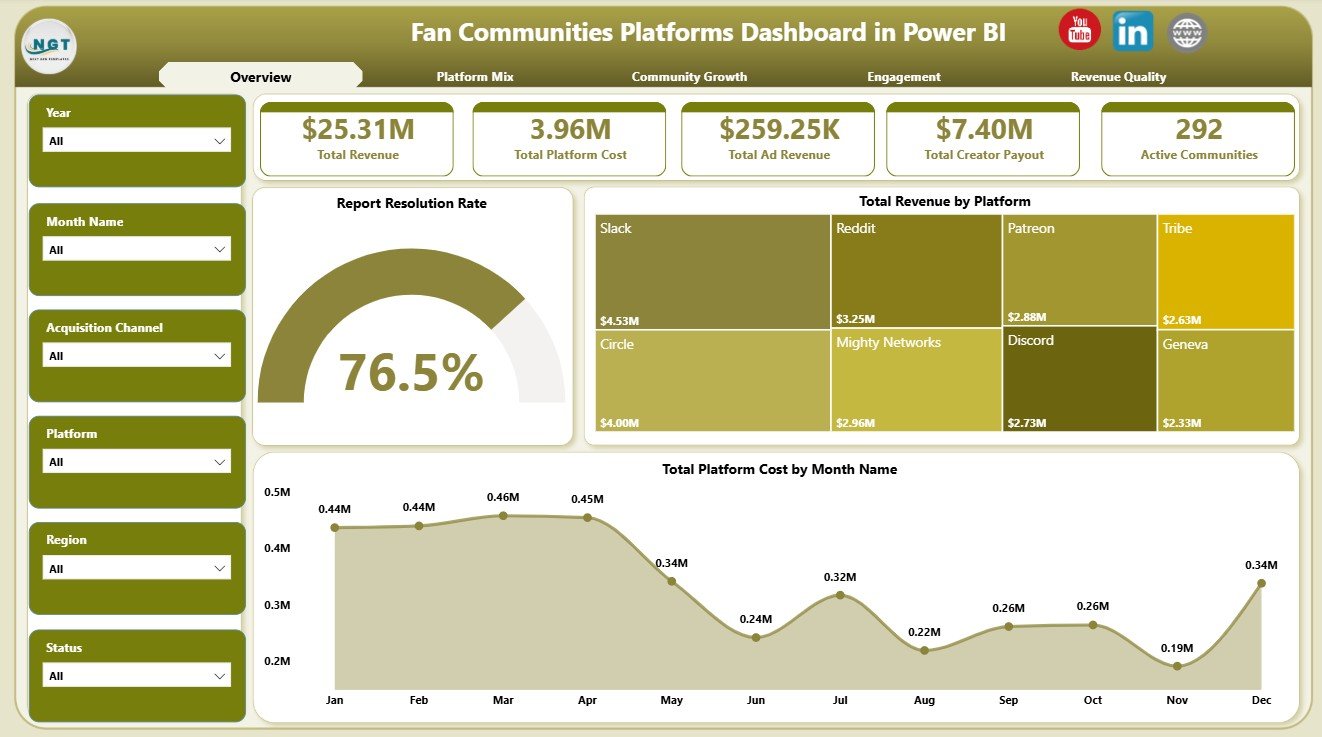
The Overview Page is the executive starting point. The top cards show Total Revenue, Total Platform Cost, Total Ad Revenue, Total Creator Payout, and Active Communities so users can quickly review financial performance, platform spending, creator economics, and community scale.
Report Resolution Rate: This chart tracks how effectively community reports are resolved. It helps moderation and operations teams see whether community issues are being handled at a healthy rate.
Total Revenue by Platform: This visual compares revenue across platforms. It helps teams identify the strongest fan community platforms and decide where to focus growth activity.
Total Platform Cost by Month Name: This trend shows monthly platform cost movement. It supports budget reviews and helps identify months where cost changes need deeper analysis.
2. Platform Mix
The Platform Mix page helps users compare platform income, active communities, and monthly revenue trends. Net Platform Income by Acquisition Channel shows which acquisition sources create stronger net value after platform economics are considered. Active Communities by Platform highlights where community activity is concentrated, while Total Revenue by Month Name shows revenue movement over time.

3. Community Growth
The Community Growth page focuses on quarterly performance, active community rate, and content category income. Total Revenue by Quarter helps teams compare growth across quarters. Active Community Rate by Community Type shows which community models stay active, while Net Platform Income by Content Category identifies content areas with stronger financial contribution.

4. Engagement
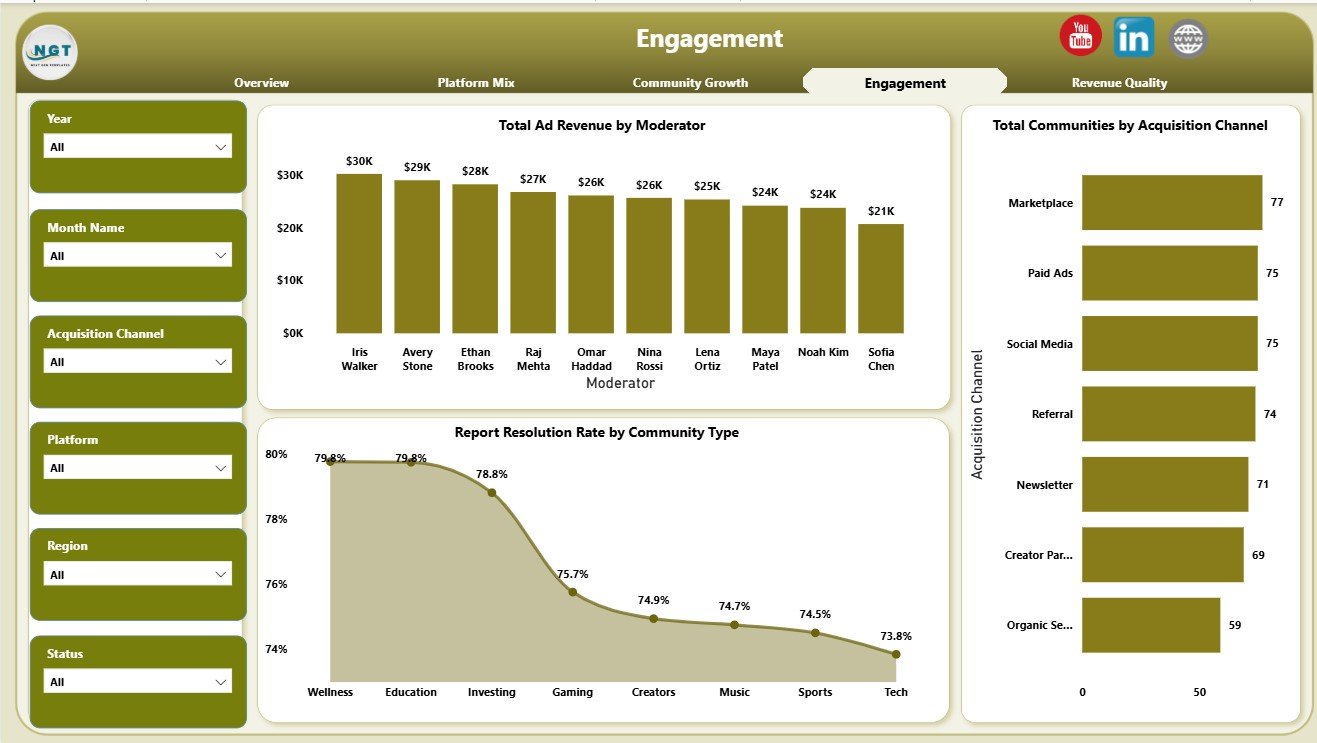
The Engagement page connects moderator performance, acquisition channels, and community type resolution patterns. Total Ad Revenue by Moderator helps compare monetization linked to moderation ownership. Total Communities by Acquisition Channel shows where communities are coming from, while Report Resolution Rate by Community Type helps identify community models that need better support workflows.
Fan Communities Platforms Dashboard in Power BI vs. Tableau vs. Paid CRM/SaaS – Where This Fits
| Feature | This Power BI Dashboard | Tableau Alternative | Paid Community SaaS |
|---|---|---|---|
| Cost | $17.99 one-time | Requires Tableau license or build effort | Monthly or annual subscription |
| Platform | Power BI Desktop | Tableau Desktop or Cloud | Vendor cloud platform |
| Setup time | Replace data source and refresh | Build or adapt workbook | Onboarding and configuration |
| Real-time collaboration | Available through Power BI Service setup | Available through Tableau Cloud | Usually included by license |
| Customizable fields | Editable Power BI model and visuals | Editable if you own the workbook | Limited by vendor settings |
| Year-1 cost at 5 users | $17.99 plus any Microsoft licensing | License and development cost | Often hundreds or thousands |
| Fan community analytics | 4 ready report pages | Requires custom build | Depends on plan and export access |
Who This Template Is For – and Who It’s Not For
This template is for community platform teams, creator economy operators, membership analysts, media businesses, moderation leads, finance teams, and Power BI users who need recurring reporting on fan community revenue, cost, acquisition, engagement, and active community performance.
It is not a live community platform, payment processor, CRM, moderation queue, or automated data connector. It works best when your source data is already available in clean tables that can be refreshed in Power BI Desktop.
How to Use the Fan Communities Platforms Dashboard in Power BI
- Download and unzip the dashboard package.
- Open the .pbix file in Power BI Desktop.
- Replace the sample source data with your own fan community records.
- Keep the same field structure where possible so visuals continue working.
- Refresh the report and review each page.
- Use slicers to filter by platform, month, quarter, acquisition channel, content category, community type, moderator, and other available fields.
Real-World Use Cases
Aditi, community operations manager: Uses the Overview page before monthly reviews to explain revenue, platform cost, creator payout, ad revenue, and active communities.
Rahul, creator economy analyst: Uses Platform Mix and Community Growth to compare acquisition channels, platforms, quarters, community types, and content categories.
Meera, moderation lead: Uses the Engagement page to compare moderators, acquisition channels, and report resolution rate by community type.
Frequently Asked Questions
What does this Power BI dashboard track?
It tracks total revenue, platform cost, ad revenue, creator payout, active communities, report resolution rate, platform mix, acquisition channels, content categories, community types, moderators, months, and quarters.
How many Power BI pages are included?
The report includes four pages: Overview, Platform Mix, Community Growth, and Engagement.
Do I need advanced Power BI skills?
No. The normal workflow is to open the .pbix file, replace or connect data, and refresh. Advanced users can still edit visuals, measures, relationships, slicers, and page layouts.
Can this dashboard be published online?
Yes. You can publish it to Power BI Service if you have the required Microsoft account and licensing. Sharing permissions are managed in your Power BI workspace.
Is the file editable?
Yes. The .pbix file is editable, so users can adjust visuals, fields, calculations, colors, slicers, and pages.
About the Author
Built by PK – Microsoft Certified Professional with 15+ years of Excel, Google Sheets, and Power BI experience. Founder of NextGenTemplates, reaching 300K+ subscribers across YouTube channels. Every template is hand-built and tested before release.
Explore Related Templates
- Fan Communities Platforms Dashboard in Excel
- Read the Power BI dashboard blog post
- Browse Power BI Dashboard Templates
- Browse Power BI Templates
Download the Fan Communities Platforms Dashboard in Power BI and turn fan community revenue, cost, acquisition, growth, and engagement data into clear Power BI reporting.
Last updated: June 10, 2026.
Watch the step-by-step video tutorial:
Compatibility and Requirements
- Works in Power BI Desktop, which is free from Microsoft. Download it from Get Power BI Desktop.
- The file is an editable .pbix with 4 report pages and slicers for filtering.
- Publishing to Power BI Service needs a Microsoft account with the right licensing.


























Reviews
There are no reviews yet.