

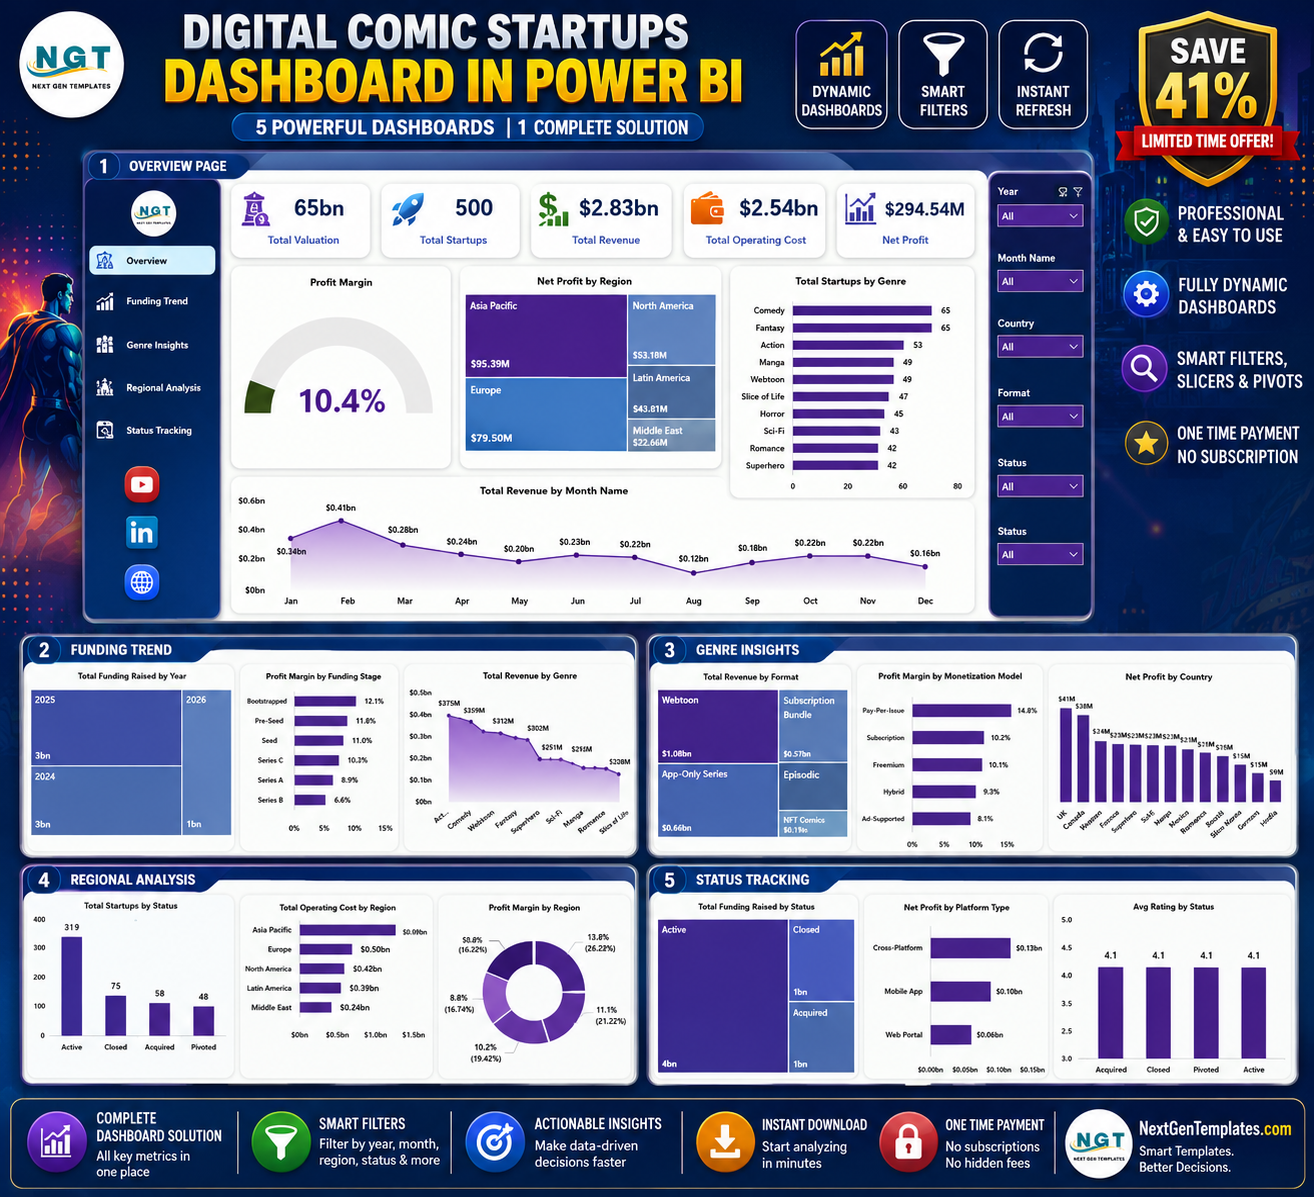

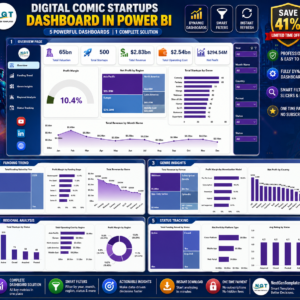
Digital Comic Startups Dashboard in Power BI helps digital comic founders, media analysts, venture researchers, publishing consultants, and entertainment investors review 5 Power BI report pages, 5 executive KPI cards, 15+ visual analysis views, and interactive slicers from one editable PBIX file. Instead of rebuilding startup reports manually or paying for a recurring BI template service, you can open the report in Power BI Desktop, connect or replace the sample data, refresh the model, and start reviewing valuation, revenue, operating cost, net profit, funding, genre, region, platform type, and status performance. Instant download, one-time purchase, no subscription, and lifetime access to the downloaded template.
Key Features of Digital Comic Startups Dashboard in Power BI
- 5 KPI cards: Total Valuation, Total Startups, Total Revenue, Total Operating Cost, and Net Profit.
- 5 Power BI pages: Overview Page, Funding Trend, Genre Insights, Regional Analysis, and Status Tracking.
- 15+ visual insights: Analyze margin, revenue, funding, status, platform type, country, region, genre, format, and monetization model.
- Interactive slicers: Filter the report quickly during founder reviews, investor updates, and portfolio analysis.
- Editable PBIX file: Customize visuals, measures, fields, titles, colors, and report pages inside Power BI Desktop.
- Startup-focused structure: Built for digital comics, webtoon platforms, creator-led publishing apps, and entertainment startup reporting.
What’s Inside the Digital Comic Startups Dashboard in Power BI
1. Overview Page
The Overview Page starts with Total Valuation, Total Startups, Total Revenue, Total Operating Cost, and Net Profit cards, giving leaders a fast read on scale, commercial performance, and financial health. Profit Margin shows how efficiently revenue turns into profit, while Net Profit by Region highlights markets where comic startups are producing stronger returns. Total Startups by Genre reveals which comic categories attract the most startup activity, and Total Revenue by Month Name tracks monthly revenue movement for growth reviews.
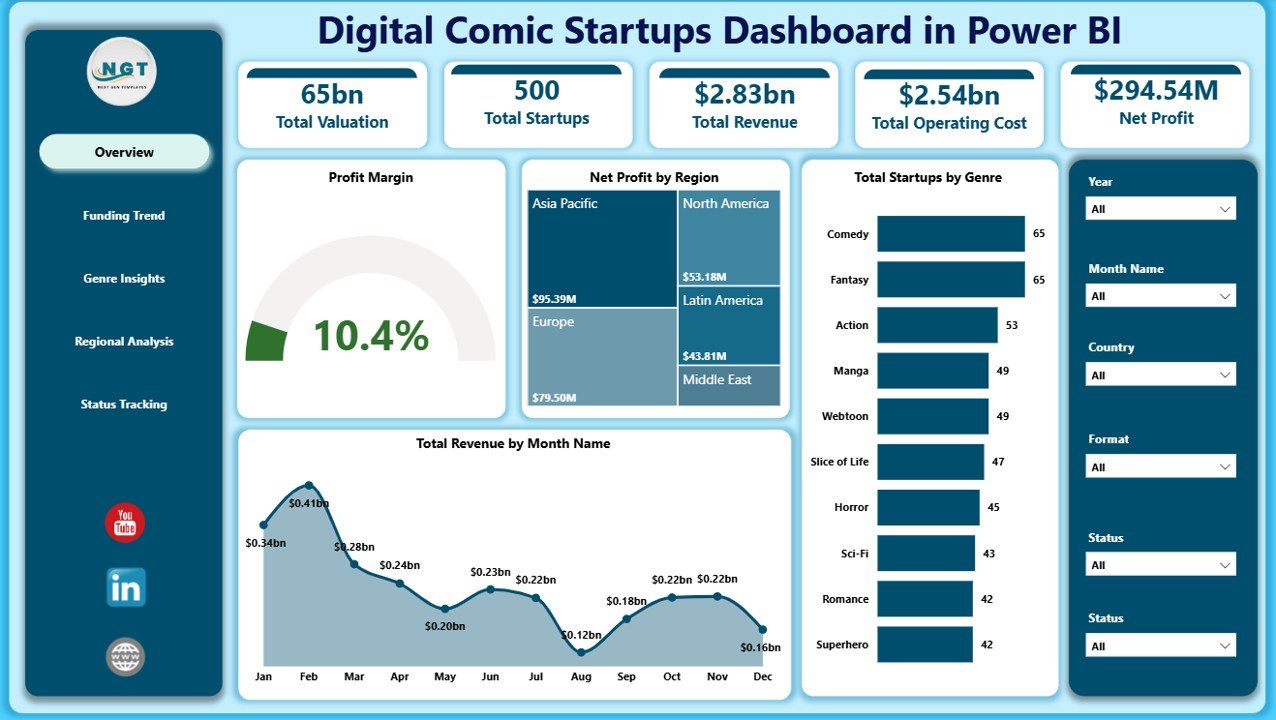
Digital Comic Startups Dashboard in Power BI
2. Funding Trend
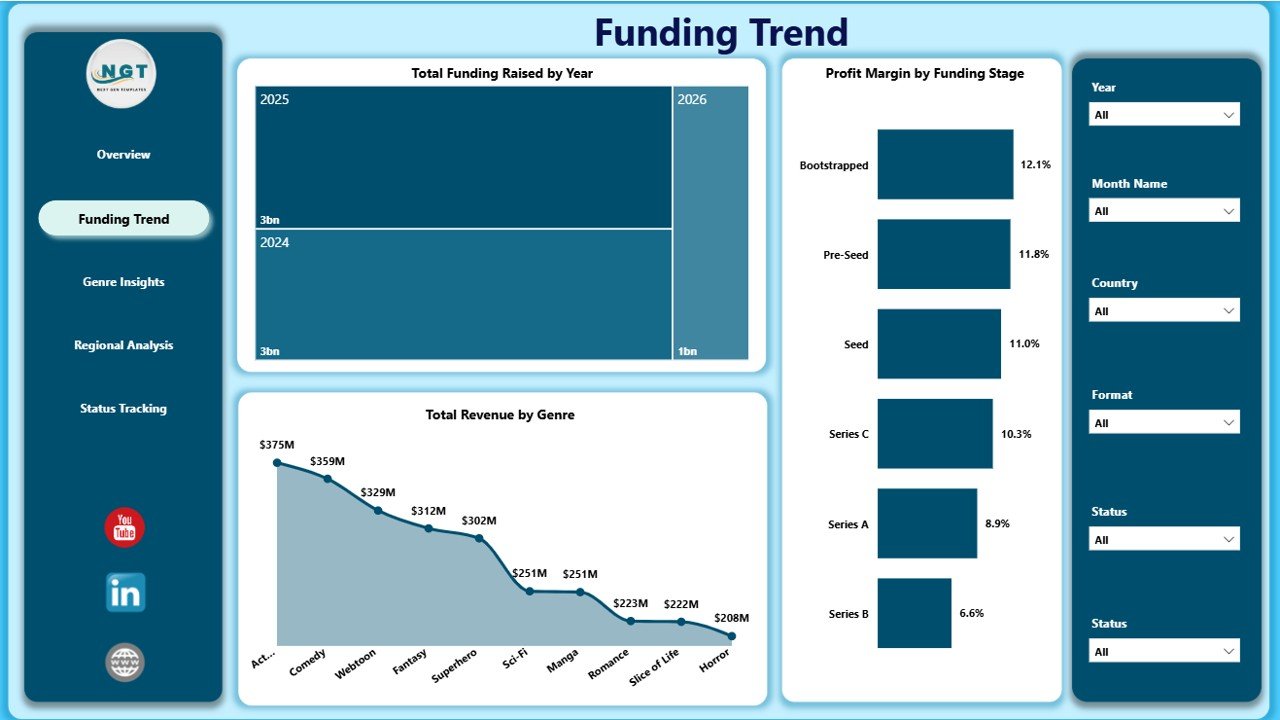
The Funding Trend page focuses on capital movement and startup maturity. Total Funding Raised by Year shows how funding changes year by year, helping analysts spot investment momentum or slower periods. Profit Margin by Funding Stage compares operating efficiency across seed, early, growth, and later-stage startups. Total Revenue by Genre connects content category strategy with commercial results.
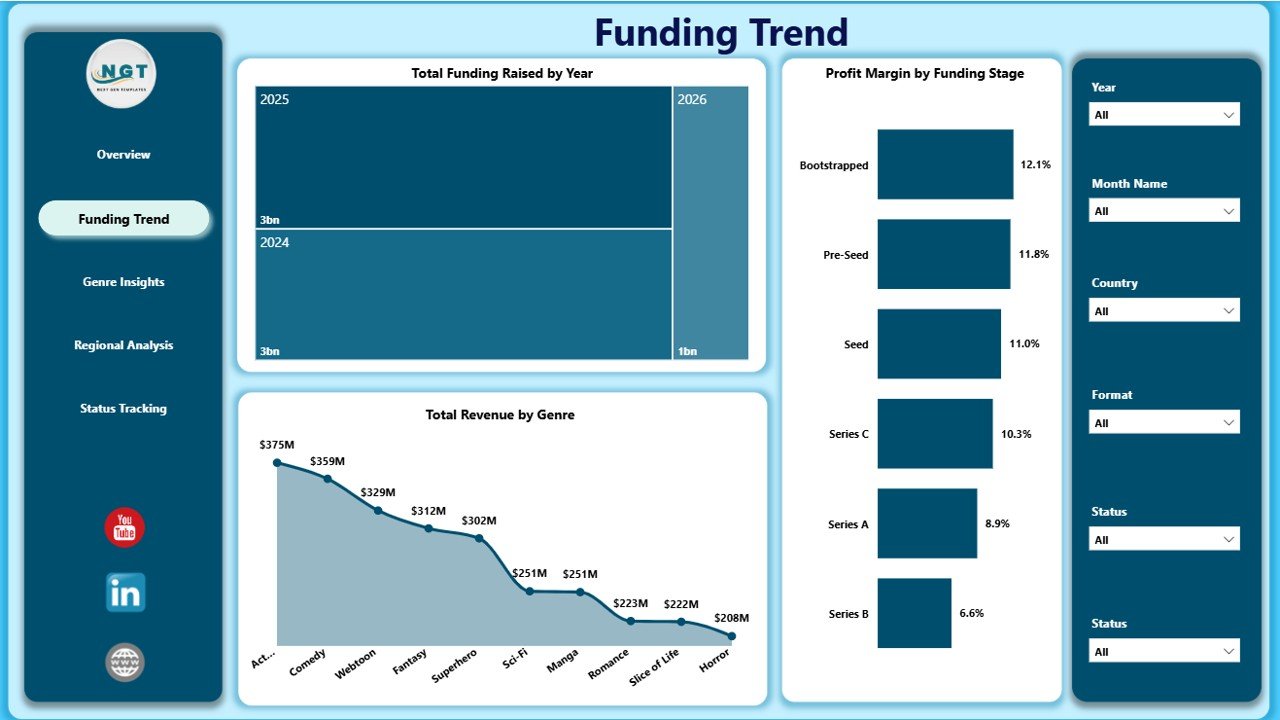
Funding Trend
3. Genre Insights
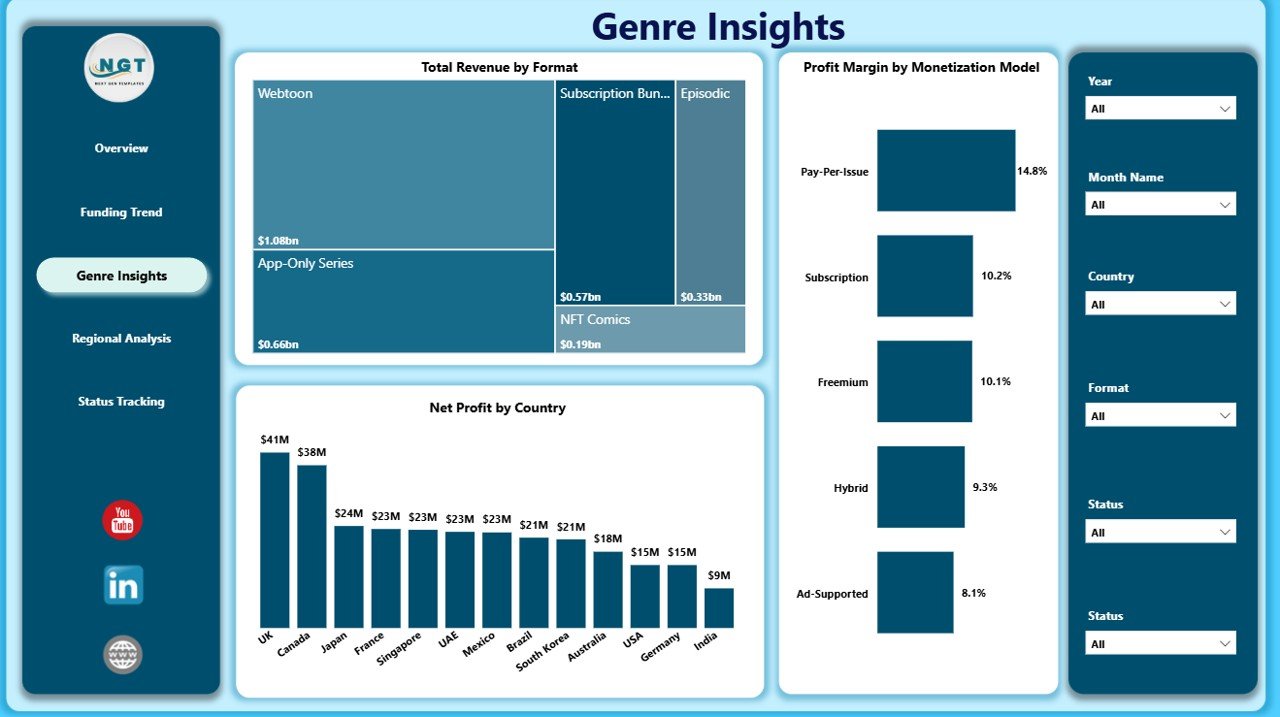
The Genre Insights page helps teams understand how format, monetization, and country affect financial performance. Total Revenue by Format compares revenue across formats such as webcomic, mobile-first, episodic, or graphic novel-style experiences. Profit Margin by Monetization Model helps compare subscription, ads, freemium, marketplace, and licensing approaches. Net Profit by Country shows where the strongest country-level returns are coming from.
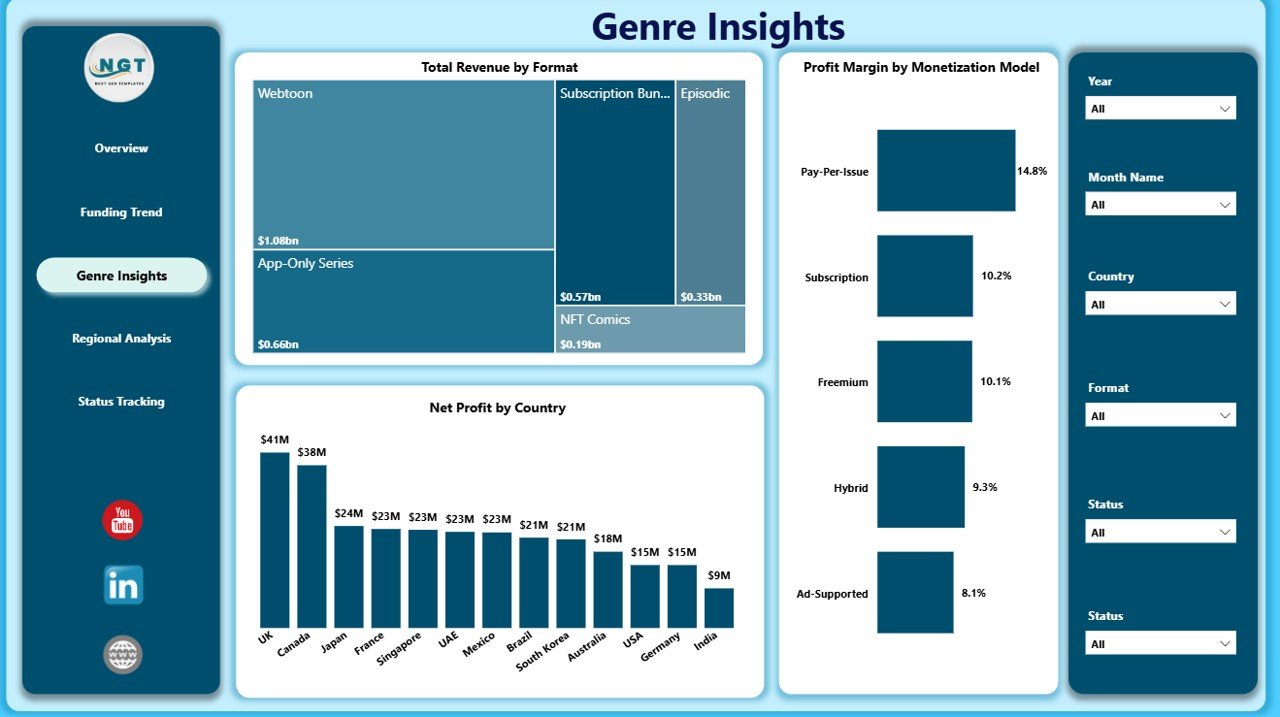
Genre Insights
4. Regional Analysis
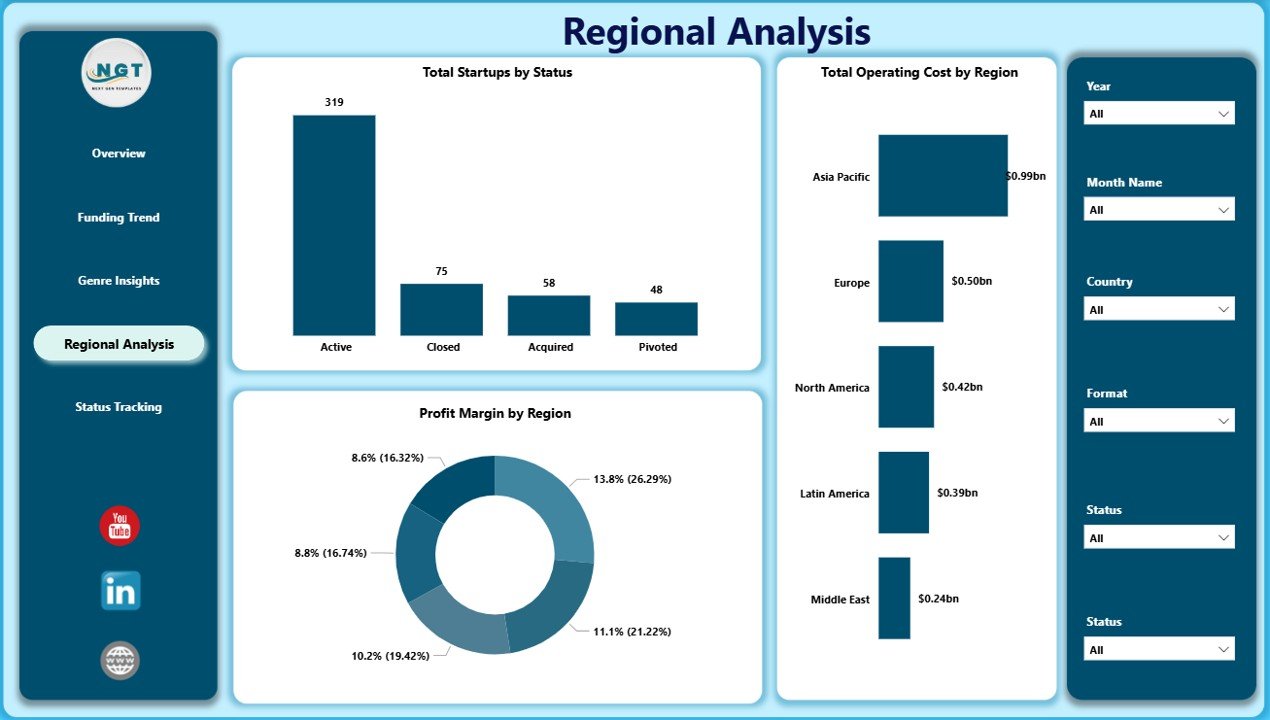
The Regional Analysis page compares operational status and regional performance. Total Startups by Status summarizes active, scaling, paused, acquired, or closed startups for portfolio review. Total Operating Cost by Region shows where cost is concentrated, while Profit Margin by Region helps identify efficient and under-pressure markets.
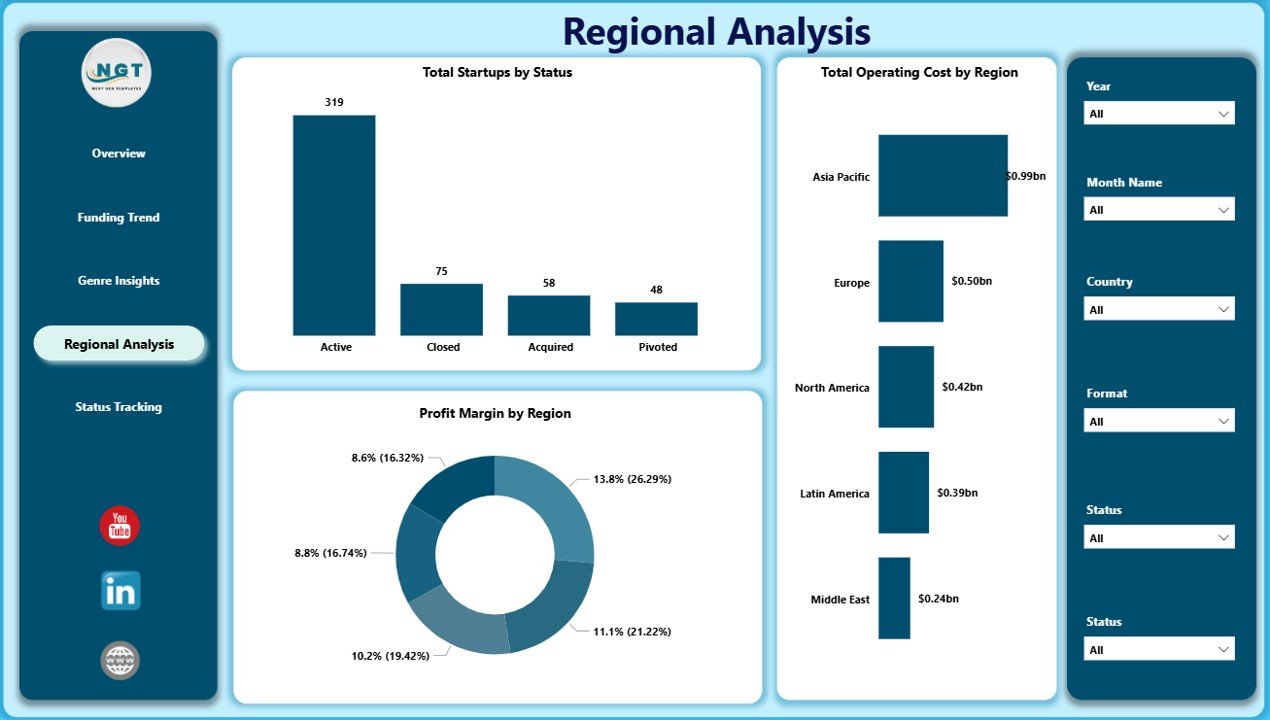
Regional Analysis
5. Status Tracking
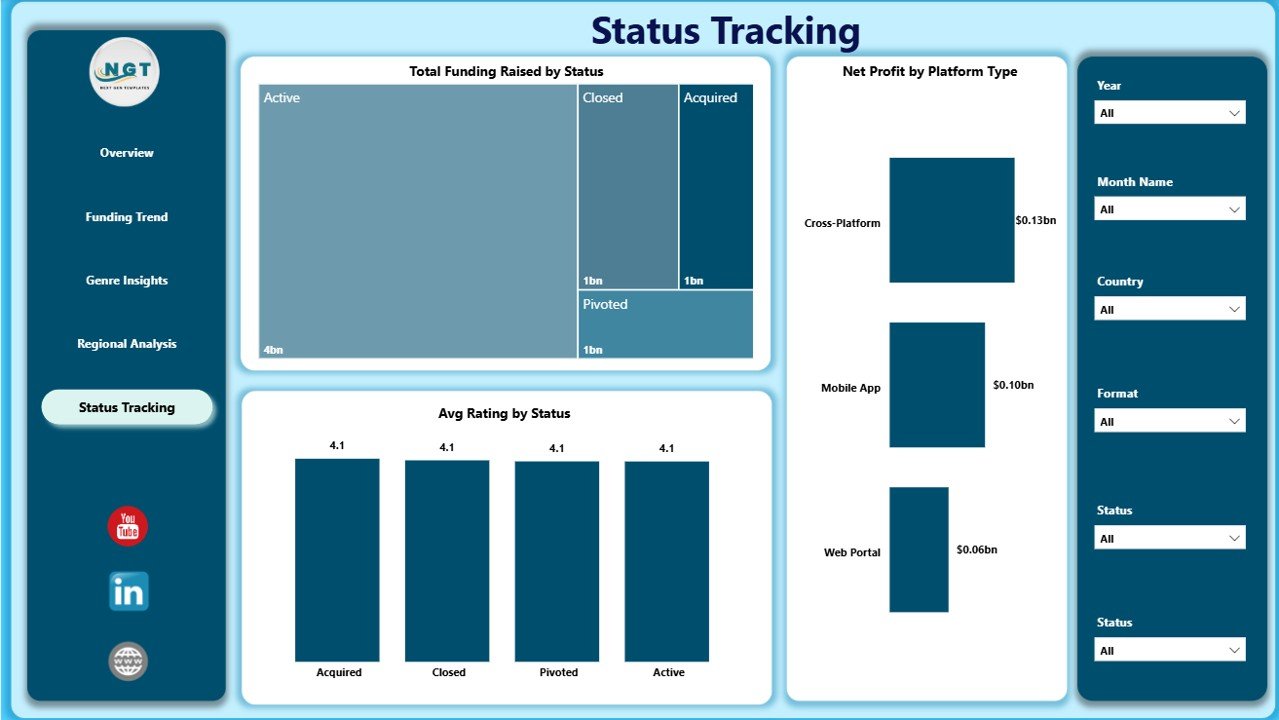
The Status Tracking page is built for lifecycle monitoring. Total Funding Raised by Status shows how investment is distributed across startup stages and operating states. Net Profit by Platform Type compares app, web, marketplace, and hybrid platforms by profitability. Avg Rating by Status helps teams see whether stable or scaling startups are also delivering stronger user satisfaction.
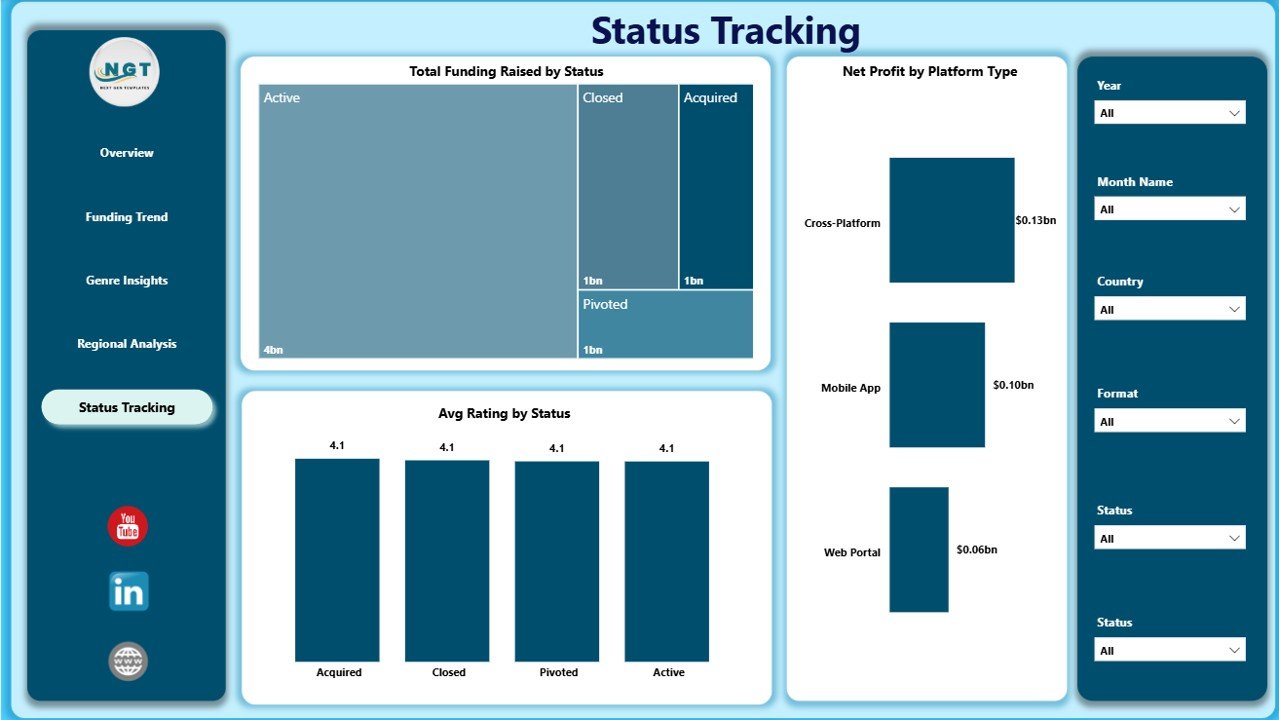
Status Tracking
Digital Comic Startups Dashboard in Power BI vs. Tableau vs. Paid CRM/SaaS – Where This Fits
| Feature | This Power BI Dashboard | Tableau or Qlik Alternative | Paid Analytics SaaS |
|---|---|---|---|
| Cost | $17.99 one-time | License or custom build cost | Monthly or annual subscription |
| Platform | Power BI Desktop / Service | BI platform setup required | Vendor cloud system |
| Setup time | Open PBIX, map data, refresh | Build model and visuals | Implementation and onboarding |
| Real-time team collaboration | Available through Power BI Service if published | Available through cloud setup | Usually seat-based |
| Mobile access | Possible through Power BI mobile/service | Possible through vendor apps | Usually included |
| Customizable fields | Editable report and model | Editable with BI skills | Limited by vendor settings |
| Share with link | Possible through Power BI Service permissions | Possible with cloud setup | Login controlled |
| Year-1 cost at 5 users | $17.99 plus Microsoft licensing you already use | Usually much higher | Often hundreds or thousands |
| Comic startup analysis | Built in across 5 pages | Must be designed | Usually generic |
Who This Template Is For – and Who It’s Not For
This template is for digital comic founders, webtoon startup teams, comic platform operators, media investors, entertainment analysts, startup accelerators, and consultants who need an editable Power BI report for valuation, funding, revenue, cost, profit, genre, region, country, format, platform type, monetization model, and status tracking.
It is not a live product analytics connector, CRM, payment system, publishing workflow tool, or investor database. Use it as a reporting layer after your operational data has been exported, cleaned, or prepared for Power BI.
How to Use the Digital Comic Startups Dashboard in Power BI
- Download and unzip the product file.
- Open the PBIX file in Power BI Desktop.
- Review the sample pages, fields, slicers, and visuals.
- Replace or connect the sample source with your own startup dataset.
- Refresh the report and validate totals against your source data.
- Use slicers to filter by genre, region, country, funding stage, platform type, monetization model, status, or month.
- Publish to Power BI Service if your team wants browser or mobile sharing.
Real-World Use Cases
Ana, digital comic founder: Ana reviews valuation, monthly revenue, operating cost, net profit, and genre mix before quarterly investor updates.
Rahul, venture analyst: Rahul uses the Funding Trend and Regional Analysis pages to compare funding stage, margin, and regional cost across entertainment startups.
Maya, publishing consultant: Maya refreshes client data and uses Genre Insights to show which formats, monetization models, and countries generate the strongest profit.
Frequently Asked Questions
What KPI cards are included?
The Overview Page includes Total Valuation, Total Startups, Total Revenue, Total Operating Cost, and Net Profit.
Do I need Power BI Desktop?
Yes. Open and edit the PBIX file in Power BI Desktop, which is available from Microsoft.
Can I customize the report?
Yes. You can edit visuals, pages, fields, measures, slicers, colors, labels, and data connections in Power BI Desktop.
Can this support investor reporting?
Yes. It is useful for founder updates, portfolio reviews, market analysis, and investor-facing performance summaries.
Does it connect live to comic platforms or payment tools?
No prebuilt live connector is included. Use exported or prepared data, then connect or replace the source in Power BI.
Is this a one-time purchase?
Yes. The template is sold as a one-time download with no template subscription fee.
About the Author
Built by PK – Microsoft Certified Professional with 15+ years of Excel, Google Sheets, and Power BI experience. Founder of NextGenTemplates, reaching 300K+ subscribers across YouTube channels. Every template is hand-built and tested before release.
Explore Related Templates
Browse more Power BI templates and Power BI Dashboard templates. Related downloads include Digital Comic Startups Dashboard in Excel, Content Personalization Startups Dashboard in Power BI, and Cloud Hosting Services Dashboard in Power BI.
Ready to analyze digital comic startup performance in Power BI? Download the Digital Comic Startups Dashboard in Power BI, replace the sample data, refresh the report, and start reviewing valuation, funding, revenue, cost, profit, genre, region, and status today.
Last updated: June 2026
Watch the step-by-step video tutorial:
Compatibility and Requirements
- Works in Power BI Desktop, which is free from Microsoft. Open the PBIX file there to edit the report, change fields and refresh the data.
- Microsoft explains how to install it in Get Power BI Desktop.
- Publishing to Power BI Service is optional and only needed if your team wants browser or mobile sharing.
































Reviews
There are no reviews yet.