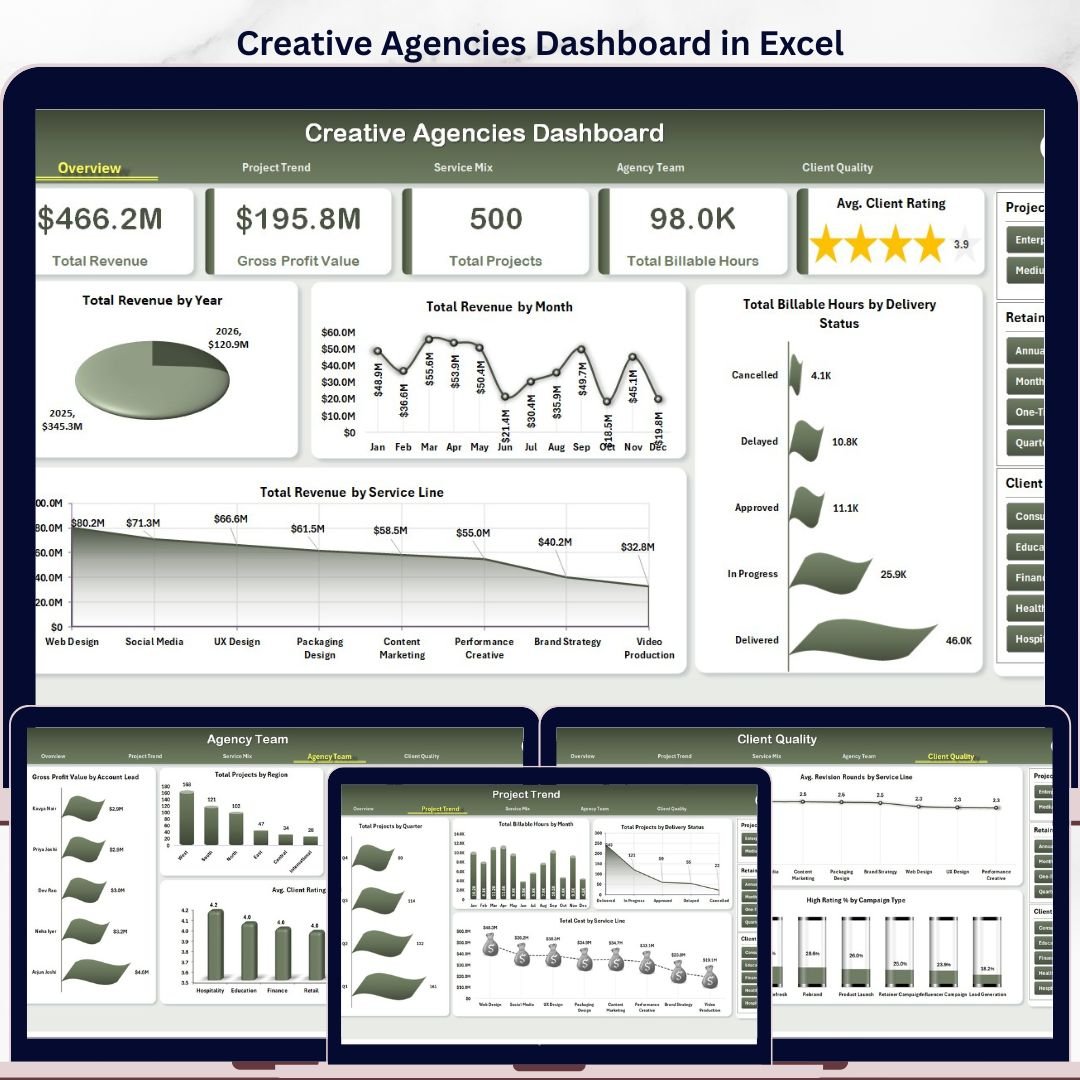


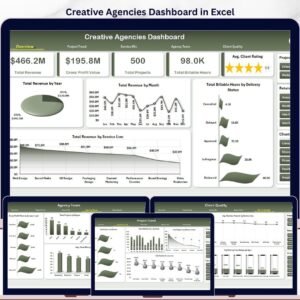
The Creative Agencies Dashboard in Excel gives agency owners, account leads, operations managers, and finance teams a 7-tab reporting workbook with 5 executive KPI cards, 5 analysis pages, a structured Data sheet, and a Support sheet powered by pivot tables. Creative service teams often manage dozens of campaigns, retainers, billable hours, revision cycles, delivery statuses, and client ratings every month; when that data sits across emails and separate trackers, revenue leakage becomes hard to see. This Excel dashboard turns that activity into slicer-driven views for revenue, profit, project load, team performance, client quality, and service mix while keeping your data fully editable in Microsoft Excel.
Key Features of Creative Agencies Dashboard in Excel
- 5 high-level KPI cards for Total Revenue, Gross Profit Value, Total Projects, Total Billable Hours, and Avg. Client Rating.
- 5 dashboard analysis pages covering Overview, Project Trend, Service Mix, Agency Team, and Client Quality.
- Multiple slicers to filter the dashboard quickly by fields such as year, month, service line, client industry, campaign type, region, retainer type, delivery status, and agency details.
- 20+ chart views for revenue, projects, billable hours, cost, gross profit, rating, revisions, acquisition channels, project size, and delivery analysis.
- Data Sheet included so you can replace the sample records with your own agency data in the same format.
- Support Sheet included with pivot tables that power the full dashboard dynamically.
- Excel-based workflow with no subscription, no per-user reporting fee, and no external SaaS dependency.
What’s Inside the Creative Agencies Dashboard in Excel
1. Overview Page
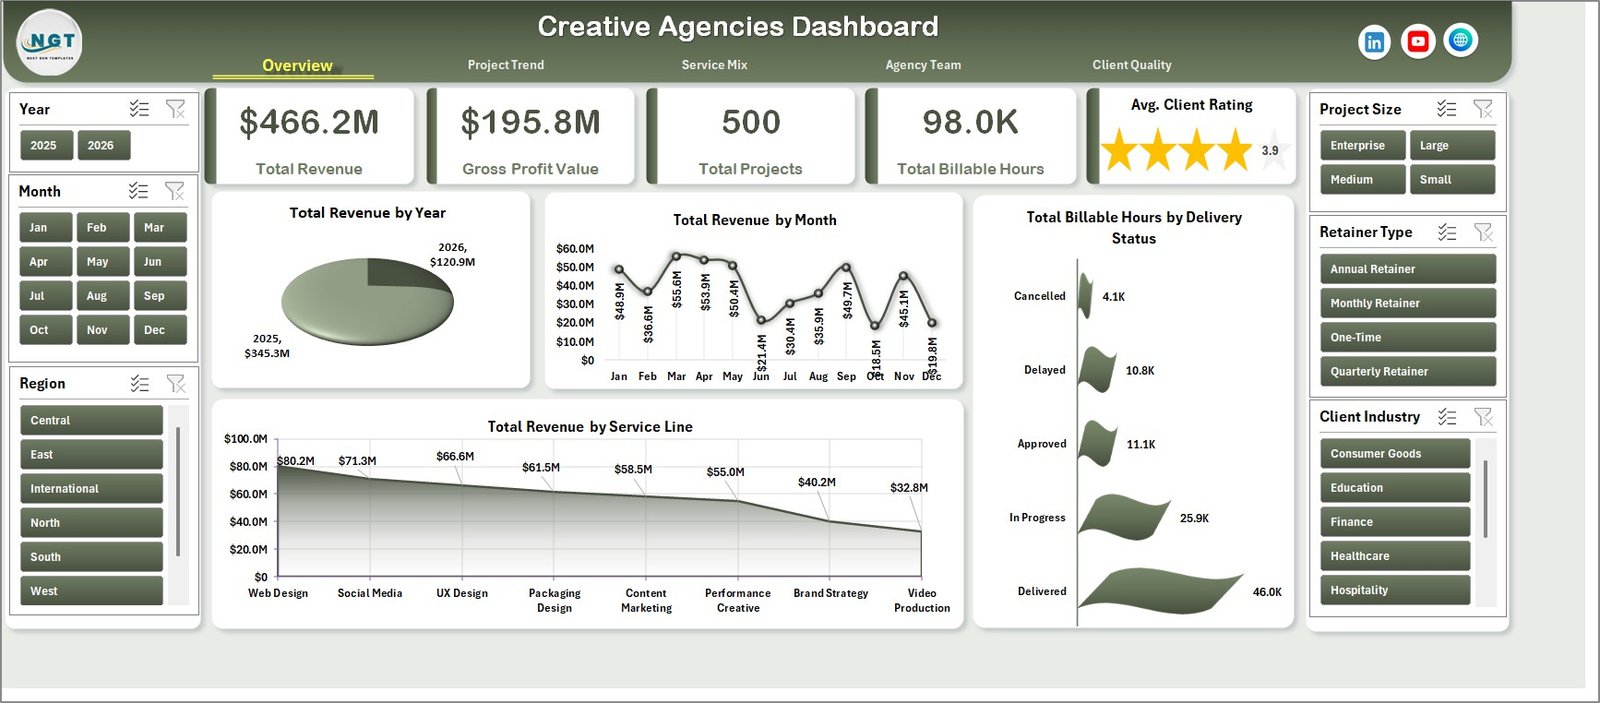
The Overview page is the leadership summary of the workbook. The top cards show Total Revenue, Gross Profit Value, Total Projects, Total Billable Hours, and Avg. Client Rating so you can quickly understand business volume, profitability, workload, effort, and client satisfaction.
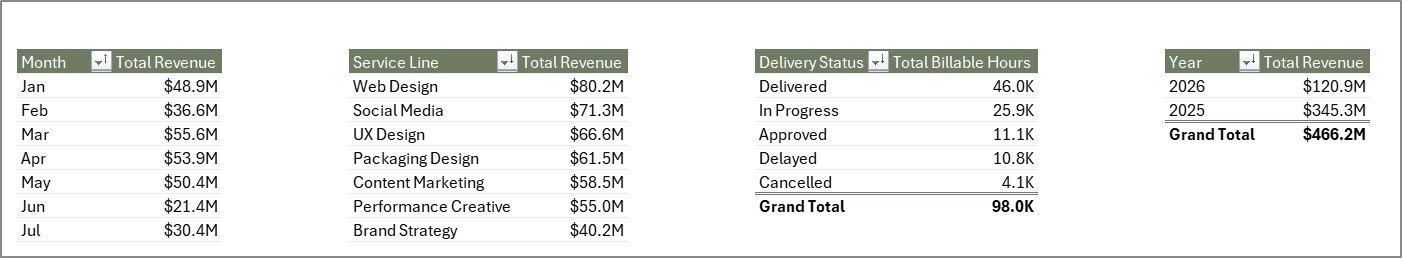
Total Revenue by Year: This chart shows how agency revenue changes across years. Use it to review long-term growth, compare annual performance, and support strategic planning.
Total Revenue by Month: This chart highlights monthly movement in revenue. It helps agency teams spot seasonality, campaign peaks, and months that need stronger pipeline attention.
Total Revenue by Service Line: This chart compares revenue across creative services such as branding, paid media, design, content, strategy, and production. It helps leaders identify the service lines that deserve more focus.
Total Billable Hours by Delivery Status: This chart links team effort to delivery status. It helps operations managers see whether hours are concentrated in completed, pending, delayed, or active work.
2. Project Trend
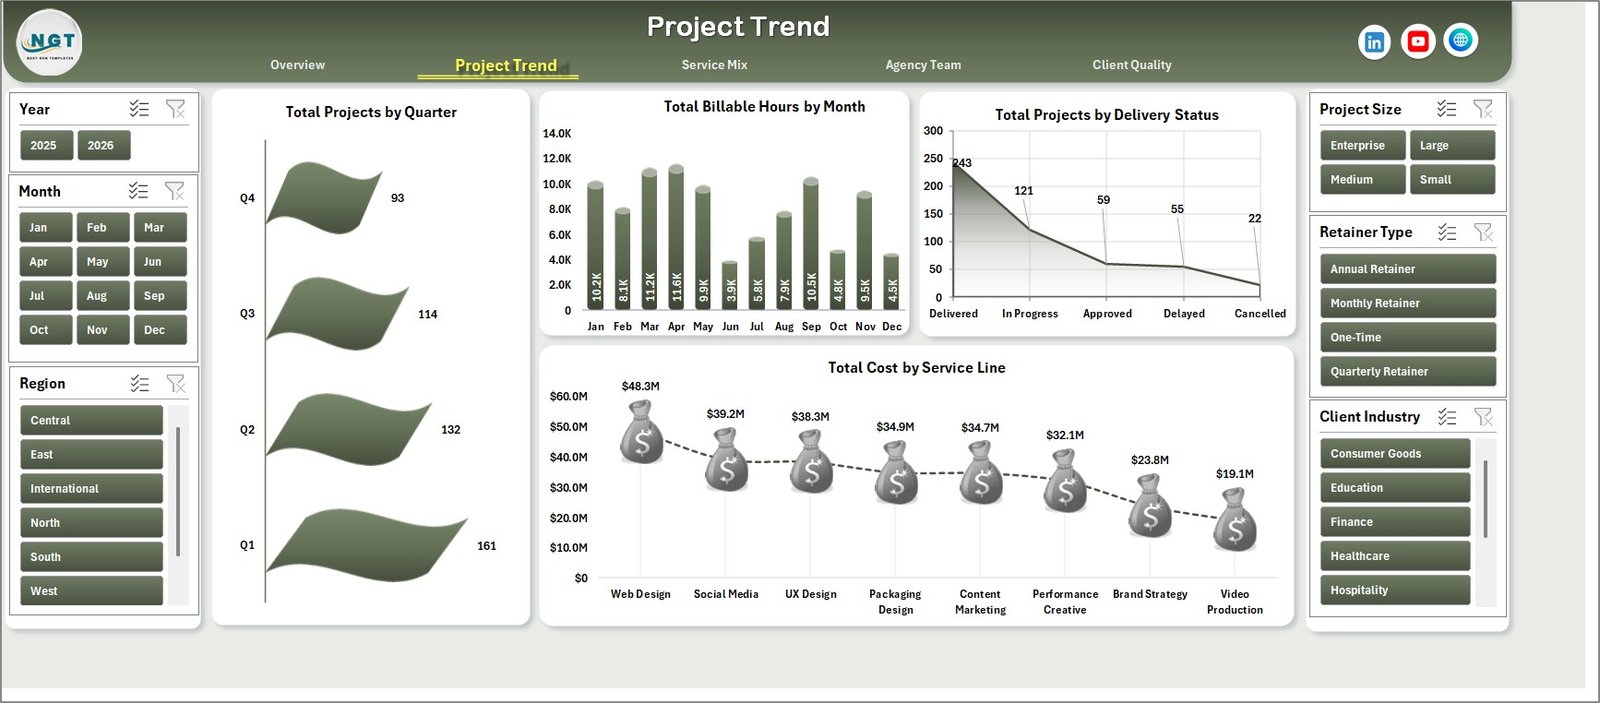
The Project Trend page focuses on workload and delivery movement. Total Projects by Quarter shows project volume over time, while Total Billable Hours by Month helps identify capacity pressure and busy delivery periods. Total Projects by Delivery Status reveals workflow health, and Total Cost by Service Line shows where project spend is concentrated.
3. Service Mix
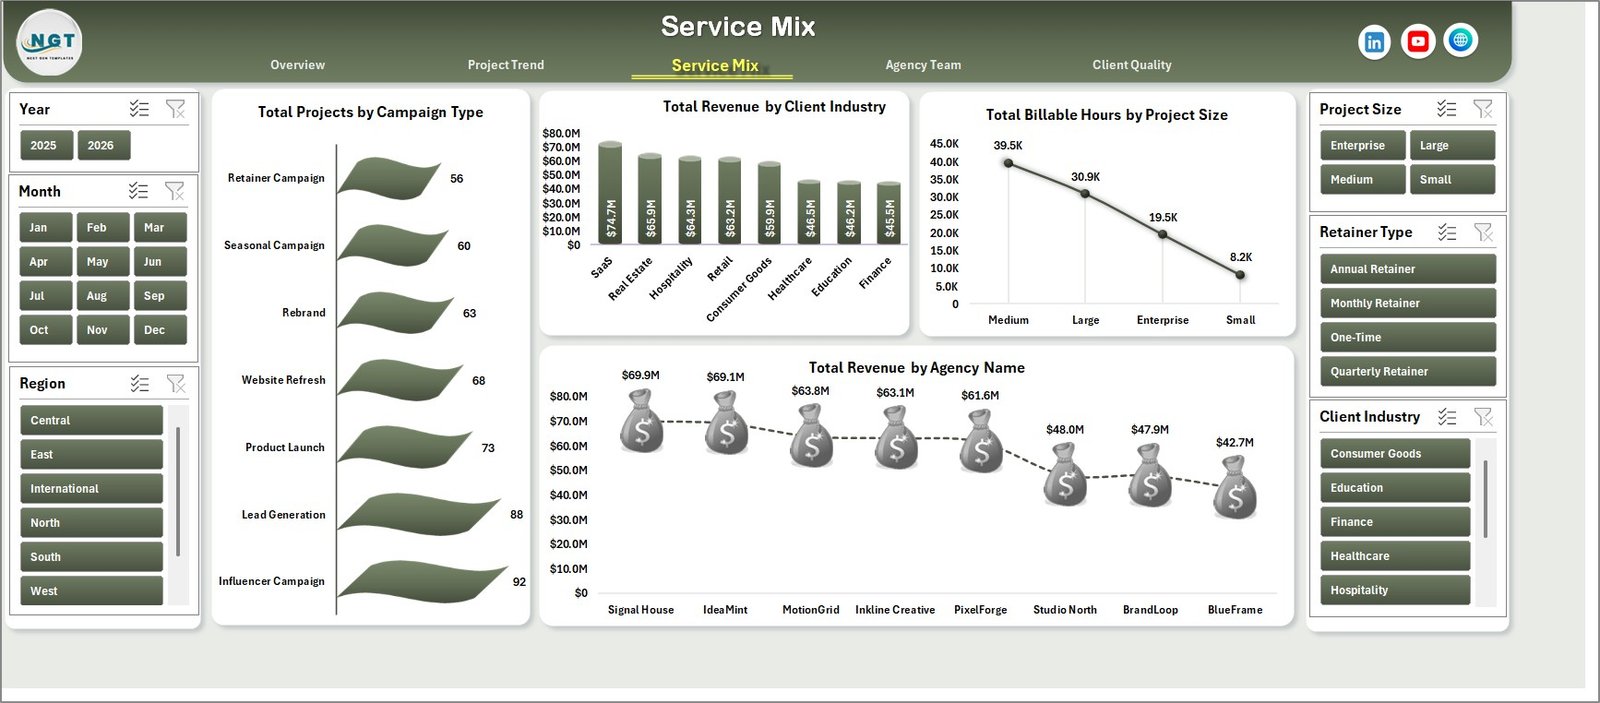
The Service Mix page explains what type of work is driving the agency. Total Projects by Campaign Type shows project mix, Total Revenue by Client Industry highlights industry contribution, Total Billable Hours by Project Size reveals effort by project scale, and Total Revenue by Agency Name compares performance across agency entities or brands.
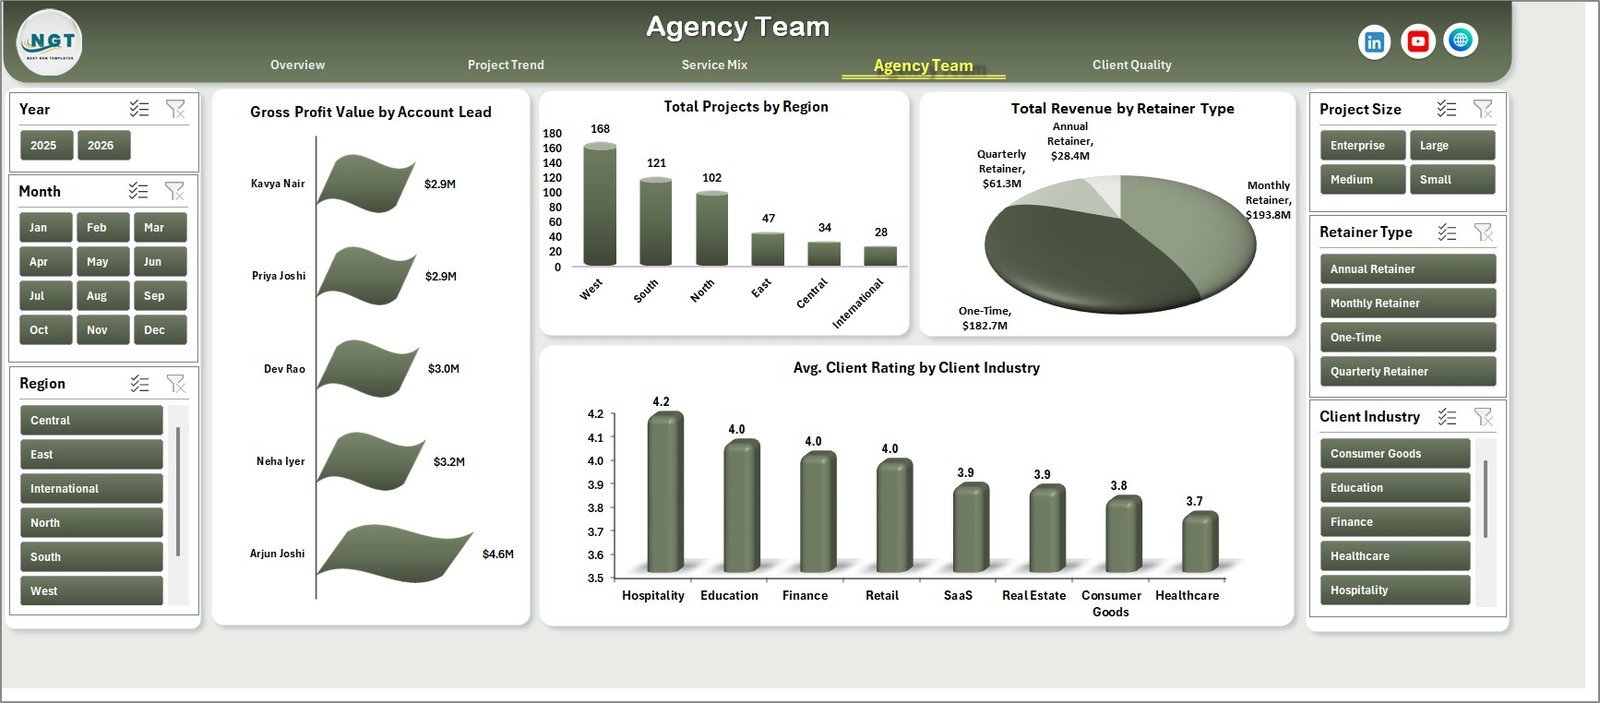
4. Agency Team
The Agency Team page connects profitability and client results with people and markets. Gross Profit Value by Account Lead shows which leads contribute the most margin, Total Projects by Region shows where delivery activity is concentrated, Total Revenue by Retainer Type compares recurring and project-based work, and Avg. Client Rating by Client Industry helps review service quality by market segment.

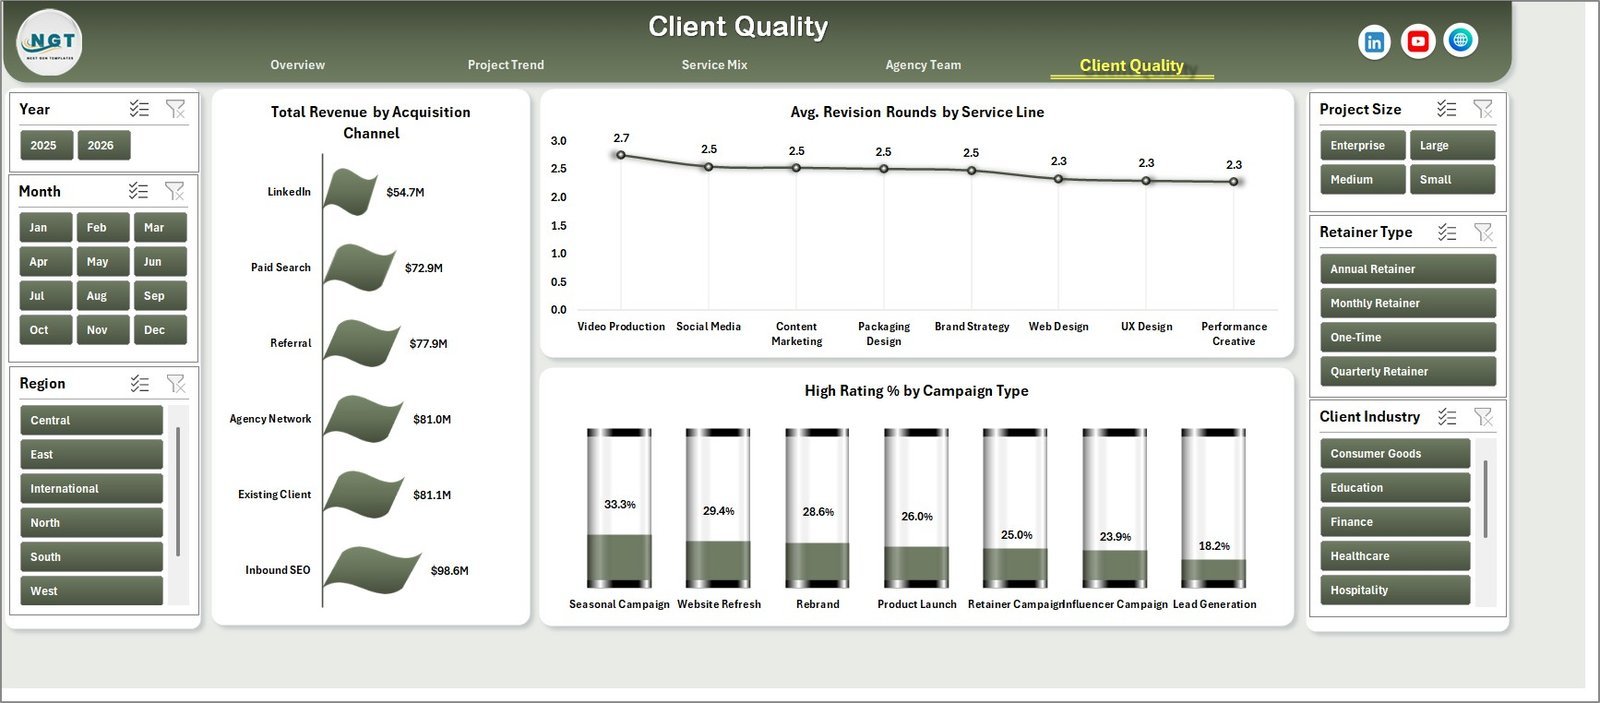
5. Client Quality
The Client Quality page is built for acquisition and satisfaction analysis. Total Revenue by Acquisition Channel shows which channels bring higher-value clients, Avg. Revision Rounds by Service Line points to services that may need better scoping, and High Rating % by Campaign Type highlights the campaign types with stronger client response.

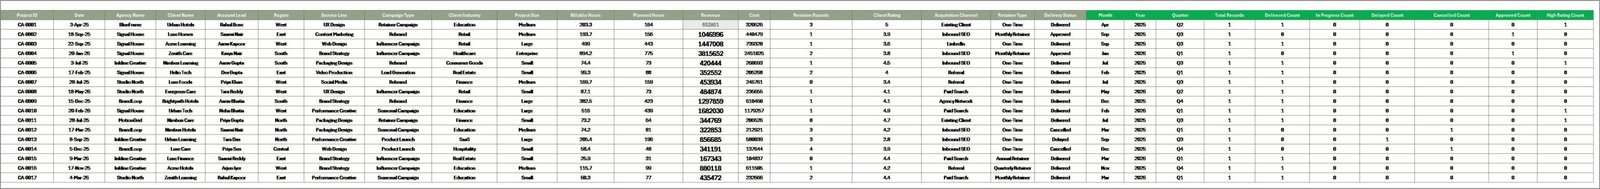
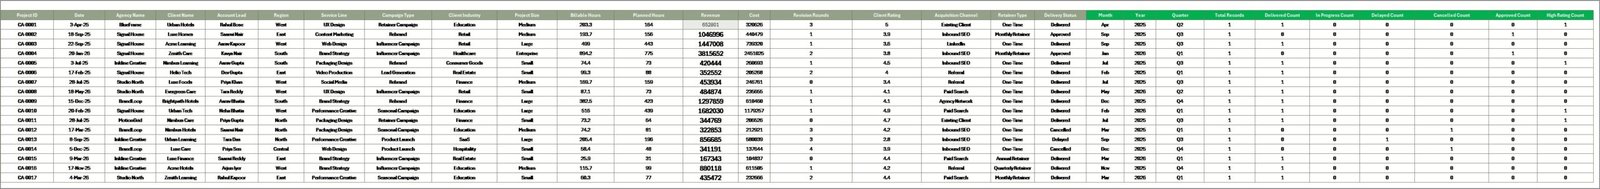
6. Data Sheet Tab
The Data sheet is where you add your own creative agency records in the same format as the sample data. Keep the column structure consistent, then refresh the workbook so KPI cards, slicers, pivot tables, and charts update properly.
7. Support Sheet
The Support sheet contains the pivot tables used to build the entire dashboard dynamically. After updating the Data sheet, go to the Data tab in the Excel Ribbon and click Refresh All. All pivots and charts will refresh, and you can keep this sheet hidden during normal use.
Creative Agencies Dashboard in Excel vs. Google Sheets vs. Paid Agency SaaS – Where This Fits
| Feature | Creative Agencies Dashboard in Excel | Google Sheets Alternative | Paid Agency SaaS |
|---|---|---|---|
| Cost | $17.99 one-time sale price | Manual build or template cost | Monthly per-user subscription |
| Platform | Microsoft Excel | Google Sheets in browser | Vendor cloud app |
| Setup time | Replace data and click Refresh All | Depends on sheet design | Onboarding and configuration |
| Offline access | Yes, in Excel desktop | Limited | No |
| Customizable fields | Editable workbook, charts, and pivots | Editable sheet | Plan dependent |
| Year-1 cost at 5 users | $17.99 plus Excel access | Template cost plus Google account | Often hundreds or thousands per year |
Who This Template Is For – and Who It’s Not For
This template is best for creative agencies, branding studios, digital marketing agencies, design teams, account managers, project managers, and finance leads who already track project data in spreadsheets and want a cleaner reporting layer.
It is not a replacement for a full project management system, time tracker, CRM, invoicing platform, or automated resource planning tool. If you need live task boards, client portals, automated billing, or approval workflows, use this dashboard as the reporting companion beside those systems.
How to Use the Creative Agencies Dashboard in Excel
- Download and unzip the file after purchase.
- Open the workbook in Microsoft Excel.
- Go to the Data sheet and replace the sample rows with your own agency project records.
- Keep the same field structure for clean pivot refreshes.
- Click Data > Refresh All in the Excel Ribbon.
- Use the slicers on each dashboard page to filter by time, service, client, region, status, and team fields.
Real-World Use Cases
Maya, agency founder: Maya reviews Total Revenue by Service Line and Gross Profit Value by Account Lead before monthly leadership meetings to see which services and leads are driving margin.
Daniel, operations manager: Daniel uses Total Billable Hours by Delivery Status and Total Projects by Delivery Status to spot delayed work and rebalance team workload.
Priya, client services lead: Priya checks Avg. Revision Rounds by Service Line and High Rating % by Campaign Type to improve scoping, briefs, and client handoffs.
Frequently Asked Questions
What does this dashboard track?
It tracks revenue, gross profit, projects, billable hours, client ratings, campaign type, service line, industry, project size, account lead, region, retainer type, acquisition channel, revision rounds, and delivery status.
Do I need advanced Excel skills?
No. Basic Excel use is enough for data replacement, slicer filtering, and Refresh All. Advanced users can edit pivots, charts, and formulas if needed.
Can I use my own service lines and campaign types?
Yes. Replace the sample values in the Data sheet while keeping the same column layout. The dashboard will refresh around your records.
Does this template use macros?
No special macro workflow is required for the dashboard refresh process. It is built around Excel data, pivots, charts, and slicers.
Can I hide the Support sheet?
Yes. The Support sheet contains pivot tables that power the dashboard. You can keep it hidden for day-to-day use and unhide it only for customization.
About the Author
Built by PK – Microsoft Certified Professional with 15+ years of Excel, Google Sheets, and Power BI experience. Founder of NextGenTemplates, reaching 300K+ subscribers across YouTube channels. Every template is hand-built and tested before release.
Explore Related Templates
- Creative Agencies KPI Dashboard in Excel
- Digital Advertising Calendar in Google Sheets
- Browse Excel Dashboard Templates
- Browse Sales and Marketing Excel Templates
- Read the detailed blog post for Creative Agencies Dashboard in Excel
Use the Creative Agencies Dashboard in Excel to turn project, revenue, team, and client quality data into a clear reporting workbook.
Last updated: May 22, 2026
🔗 Click here to read the Detailed blog post


Reviews
There are no reviews yet.