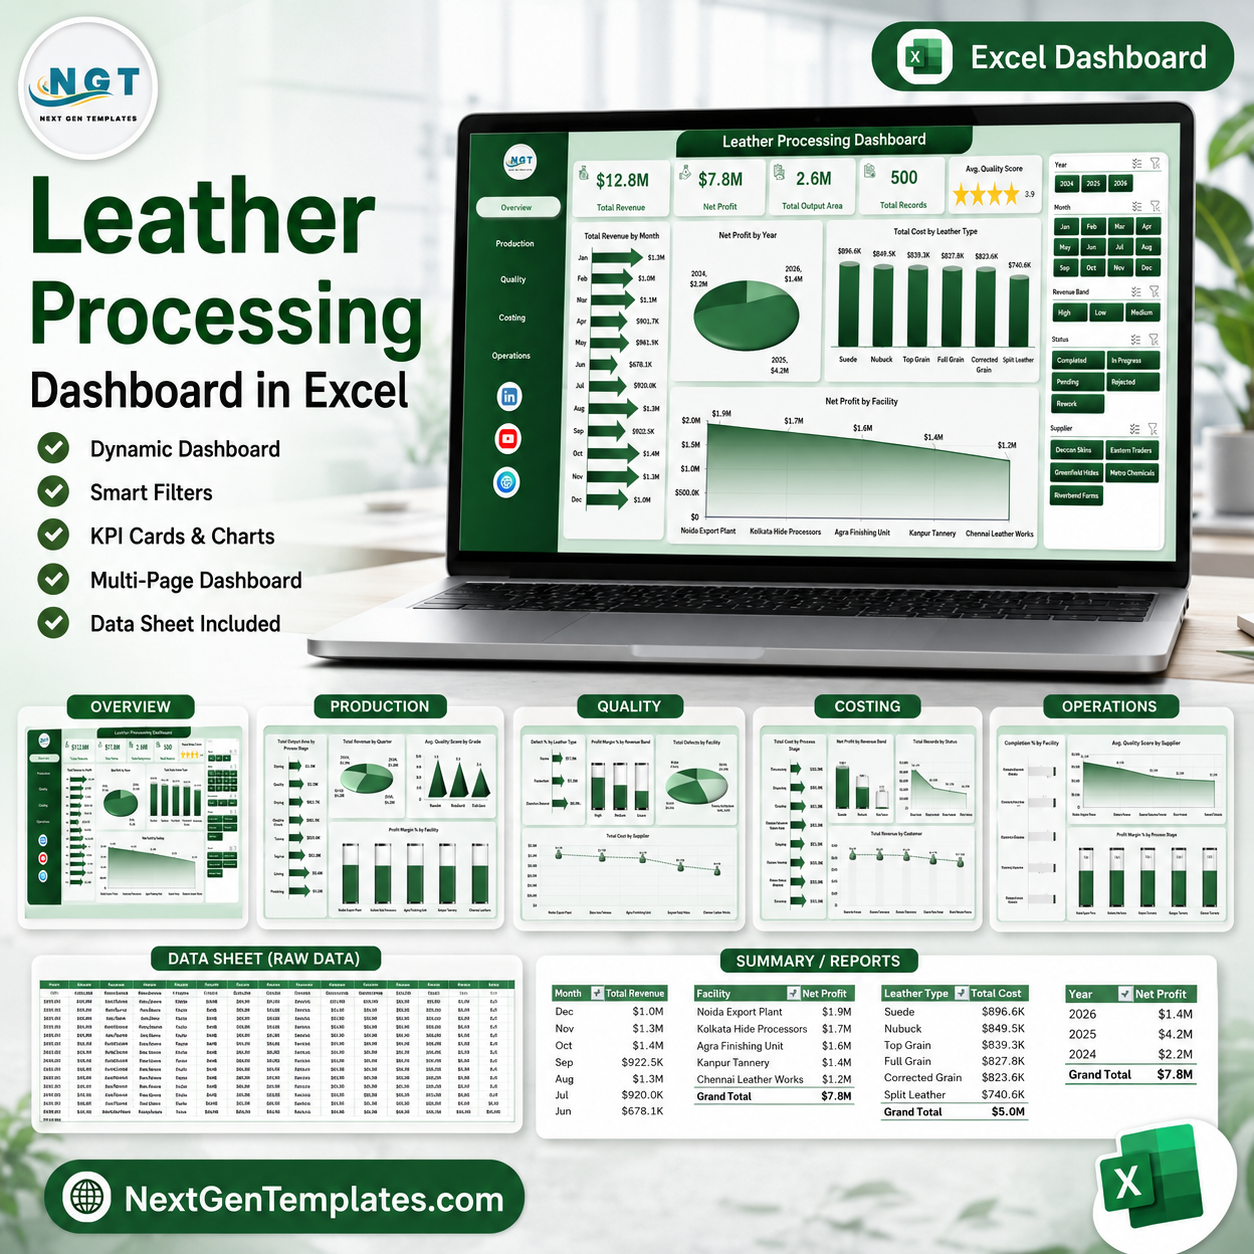


Leather Processing Dashboard in Excel gives tannery, leather finishing, quality, costing, and operations teams a ready Excel workbook with 7 worksheet tabs, 5 high-level KPI cards, 19 analysis charts, and slicers for fast filtered review. Built by PK, a Microsoft Certified Professional with 15+ years of Excel experience and 300K+ YouTube subscribers, this one-time download helps you review revenue, profit, output area, defects, cost, quality score, process stages, grades, facilities, suppliers, customers, and status without building a dashboard from scratch. Instant download, no subscription, lifetime access.
Key Features of Leather Processing Dashboard in Excel
- 7 worksheet tabs: Overview, Production, Quality, Costing, Operations, Data, and Support.
- 5 KPI cards: Total Revenue, Net Profit, Total Output Area, Total Records, and Avg. Quality Score.
- 19 ready analysis charts: Review revenue, cost, profit, output area, defects, quality, completion, customers, suppliers, status, facilities, leather type, grade, and process stage.
- Multiple slicers: Filter the dashboard quickly and review specific leather processing segments.
- Editable data sheet: Replace the sample records with your own data in the same format.
- Pivot-powered support sheet: Refresh all pivots and charts after updating data.
What’s Inside the Leather Processing Dashboard in Excel
1 – Overview Page
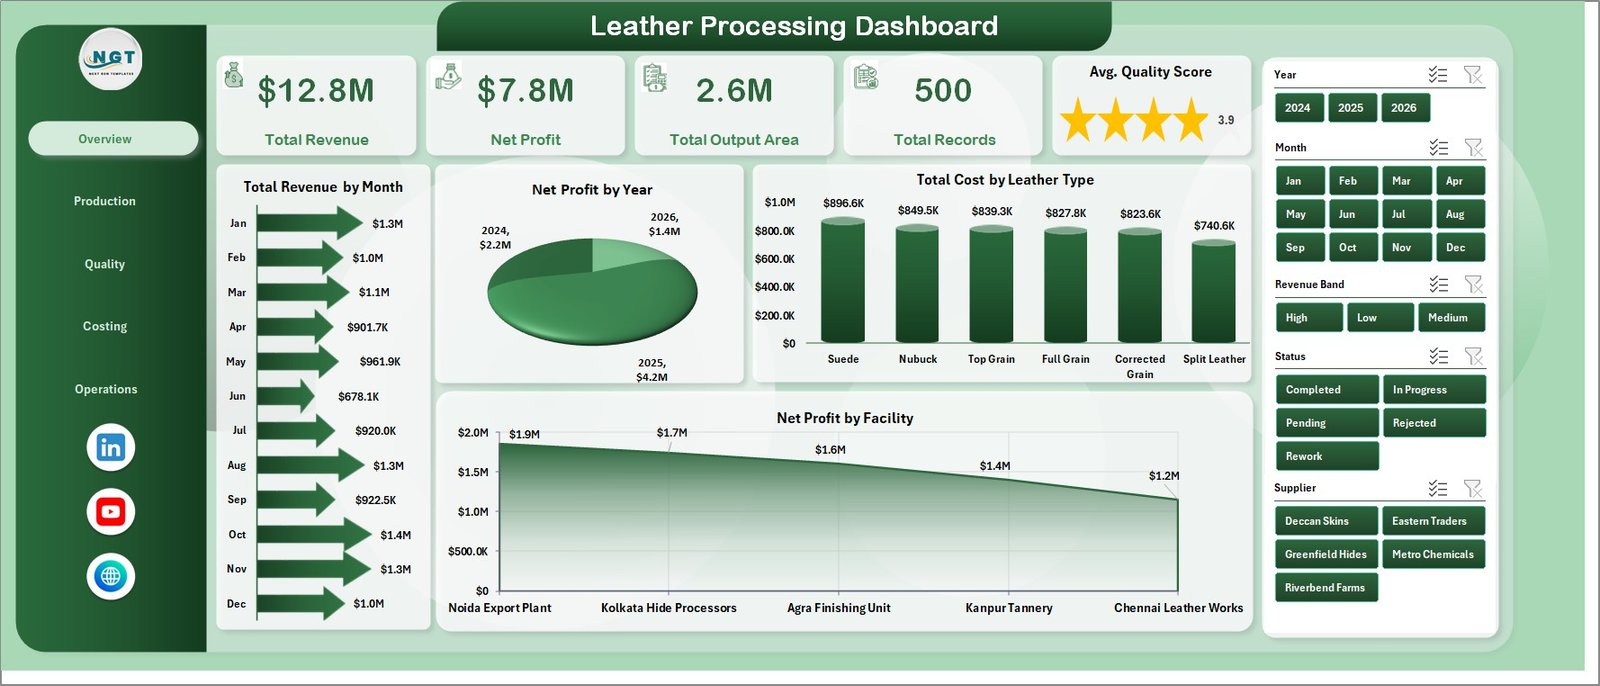
The Overview Page gives management a quick view of overall business performance through Total Revenue, Net Profit, Total Output Area, Total Records, and Avg. Quality Score cards. Slicers help users filter the report and instantly see the dashboard for the selected period, facility, leather type, supplier, or other available fields.
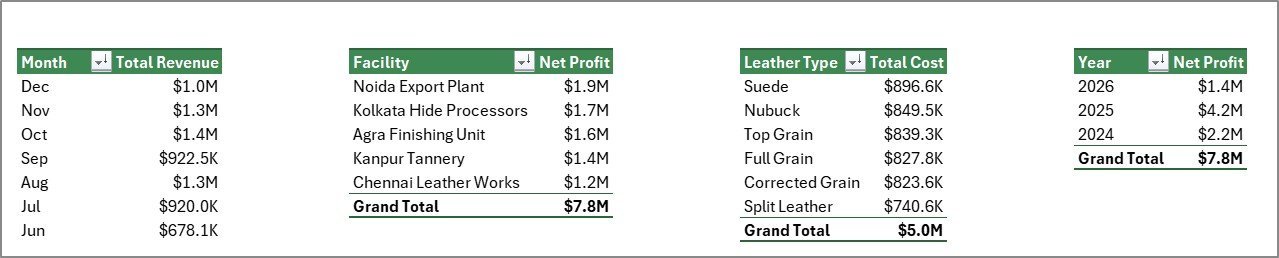
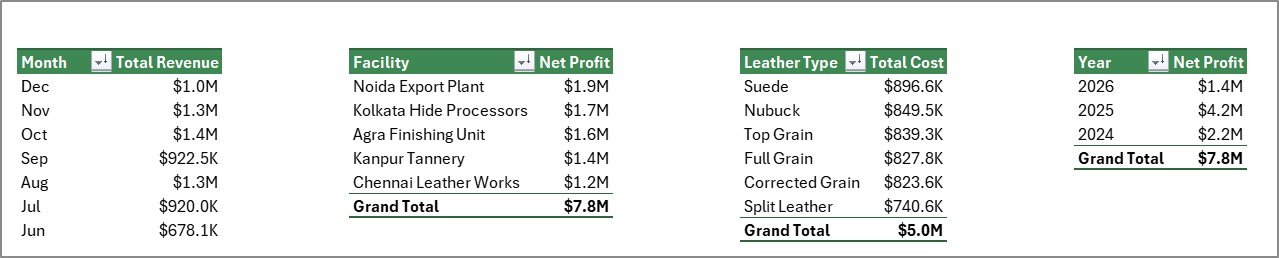
Total Revenue by Month: This chart shows how revenue moves month by month. It helps identify seasonal demand, strong sales periods, and months that need deeper follow-up.
Net Profit by Year: This chart compares profit performance across years. It helps management see whether the processing business is improving its bottom line over time.
Total Cost by Leather Type: This chart breaks down cost by leather category. It helps costing teams identify which leather types consume the highest production spend.
Net Profit by Facility: This chart compares profitability across facilities. It helps leaders find the plants or locations contributing the strongest margin.
Leather Processing Dashboard in Excel
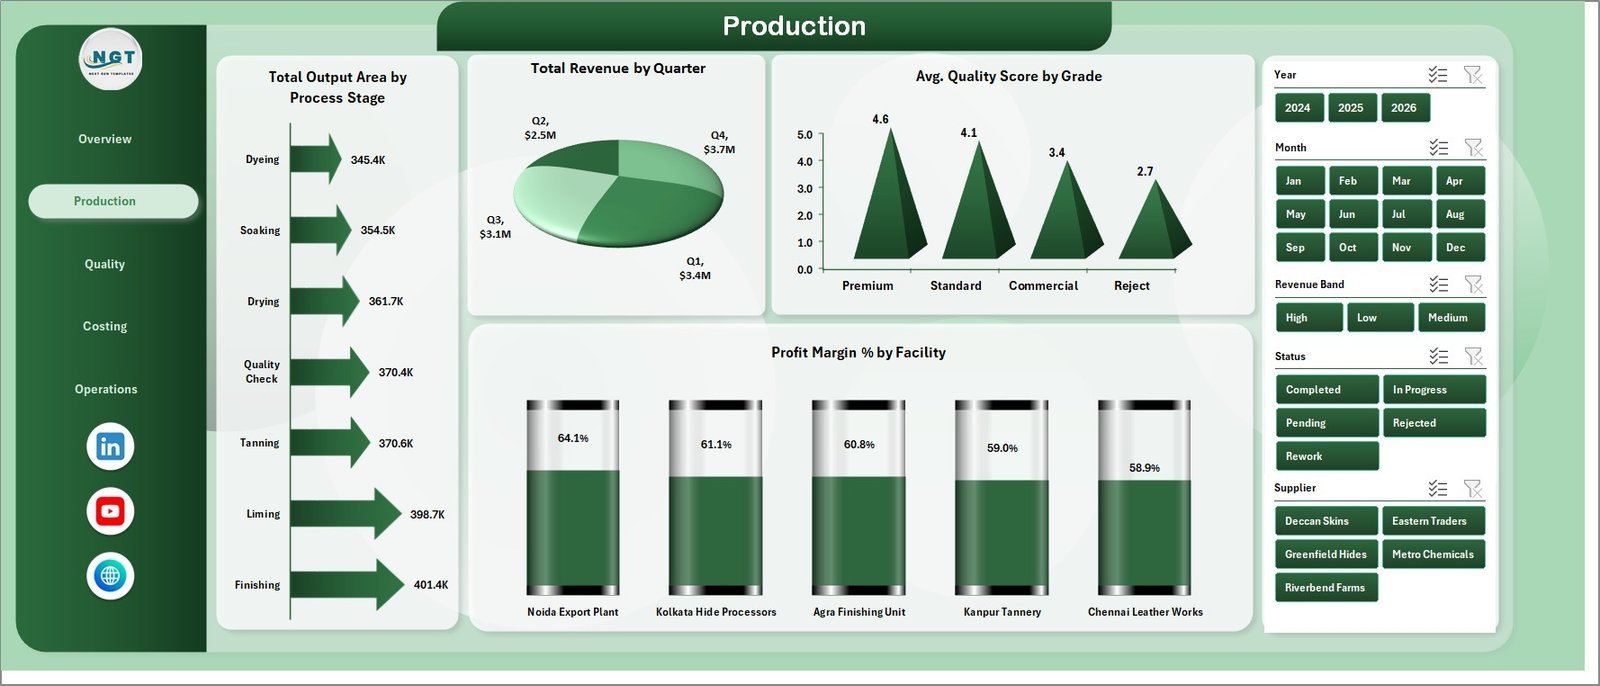
2 – Production
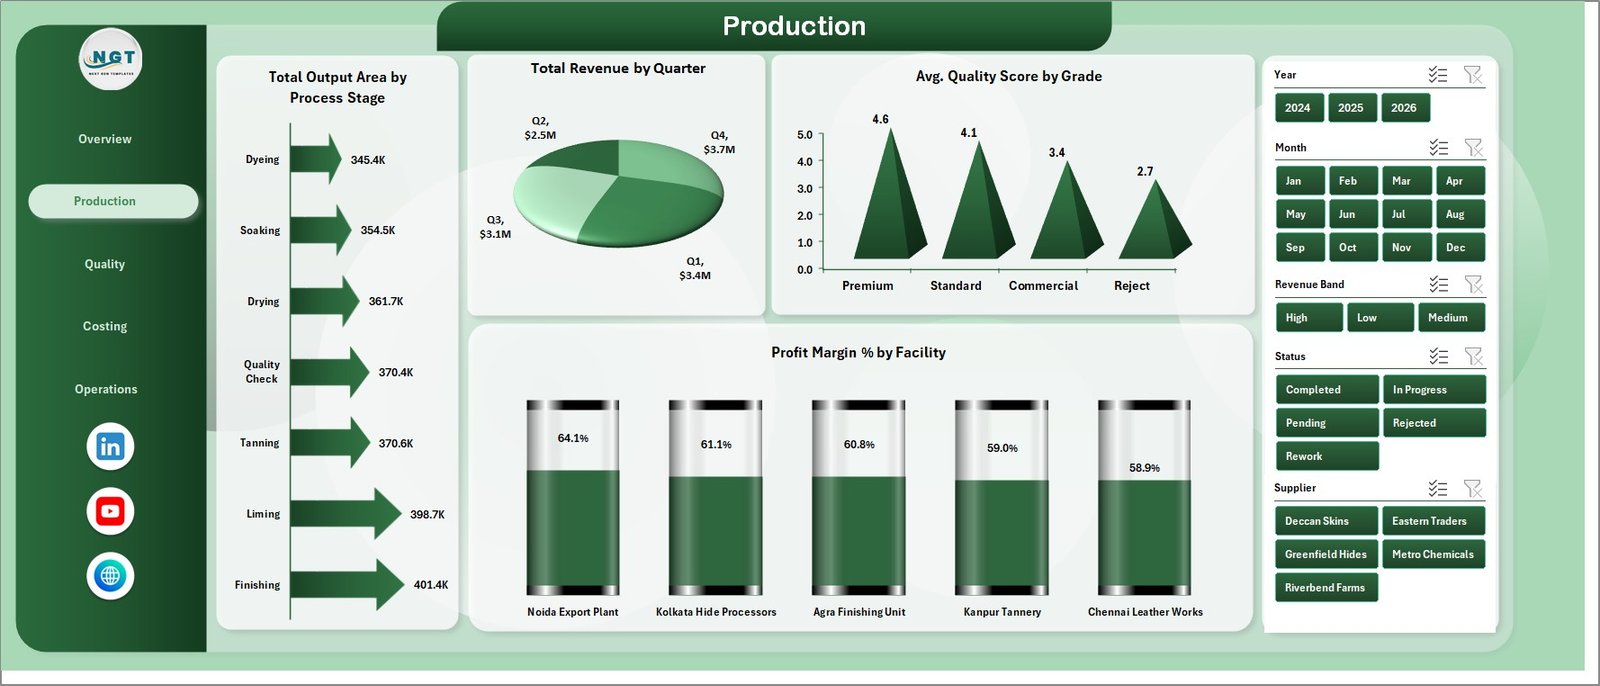
The Production tab focuses on output, revenue, quality, and margin analysis across the manufacturing flow.
Total Output Area by Process Stage: This chart shows output area across leather processing stages. It helps teams identify stages with higher throughput and possible bottlenecks.
Total Revenue by Quarter: This chart summarizes revenue by quarter. It helps managers compare quarterly performance and plan production capacity.
Avg. Quality Score by Grade: This chart compares average quality scores across grades. It helps quality teams understand which grades are meeting expectations.
Profit Margin % by Facility: This chart compares margin by facility. It helps operations teams review which locations convert production into profit most efficiently.
Production Sheet
3 – Quality
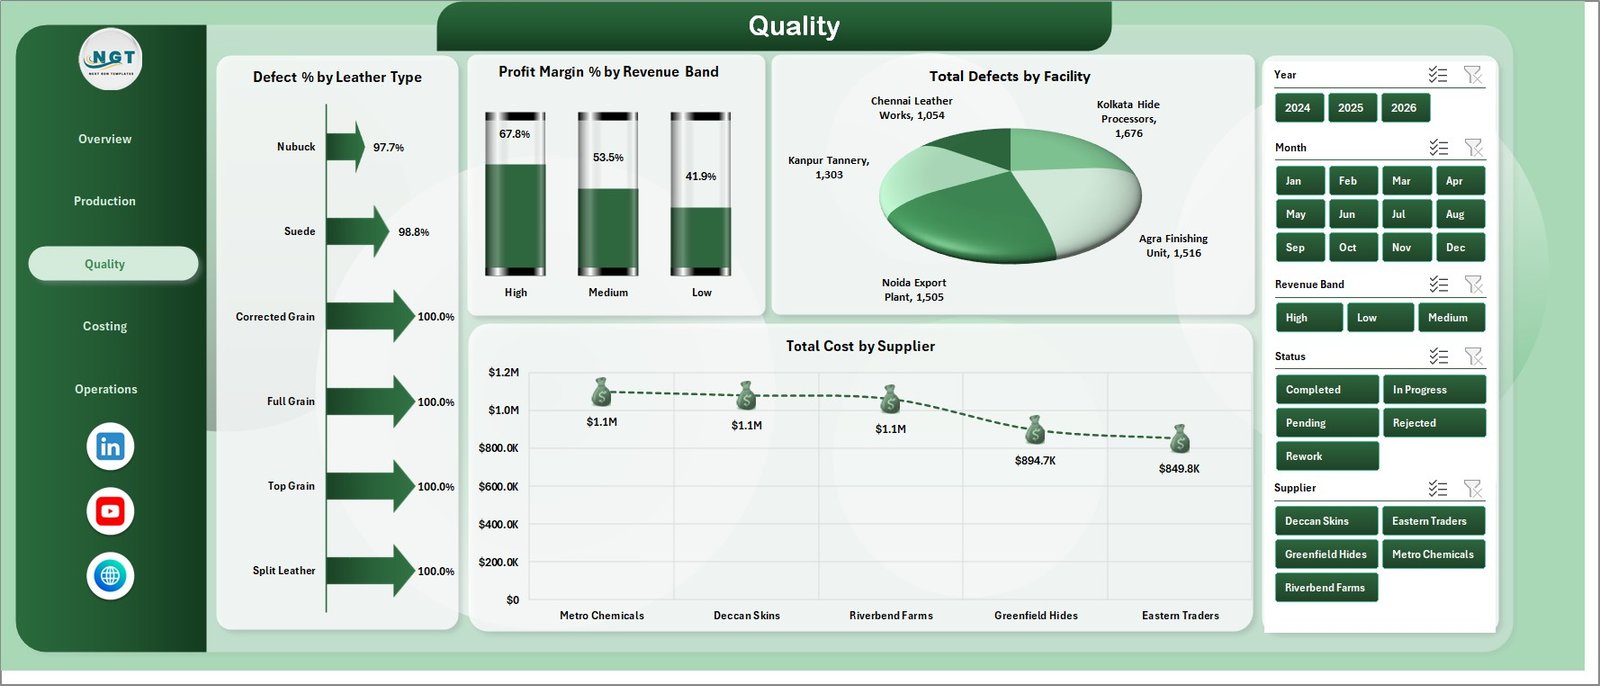
The Quality tab helps teams review defect trends, supplier cost, and profit margin patterns.
Defect % by Leather Type: This chart compares defect percentage by leather type. It helps identify material categories that need stronger inspection or process control.
Profit Margin % by Revenue Band: This chart shows margin performance across revenue bands. It helps users understand whether higher-value orders are producing better margins.
Total Defects by Facility: This chart compares total defects across facilities. It helps quality teams target locations where corrective action may be needed.
Total Cost by Supplier: This chart compares supplier-level cost contribution. It helps procurement and production teams review supplier impact on total spend.
Quality Sheet
4 – Costing
The Costing tab is built for cost control and customer revenue review.
Total Cost by Process Stage: This chart shows which stages carry the highest processing cost. It helps costing teams prioritize savings opportunities.
Net Profit by Revenue Band: This chart compares net profit across revenue ranges. It helps finance users see where the most profitable order sizes sit.
Total Records by Status: This chart shows record volume by status. It helps teams track completed, pending, or in-progress processing records.
Total Revenue by Customer: This chart compares customer revenue contribution. It helps sales and operations teams identify important accounts.
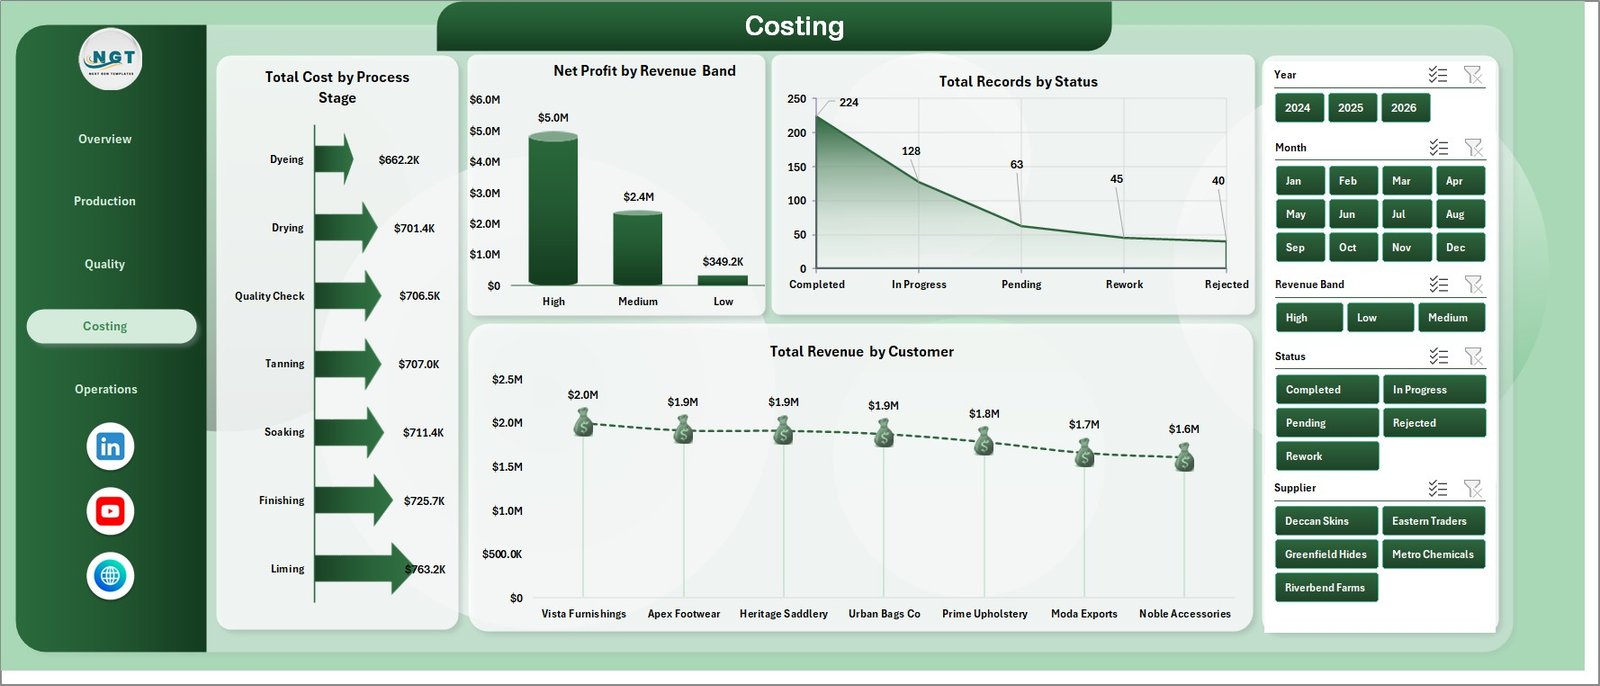
Costing Sheet
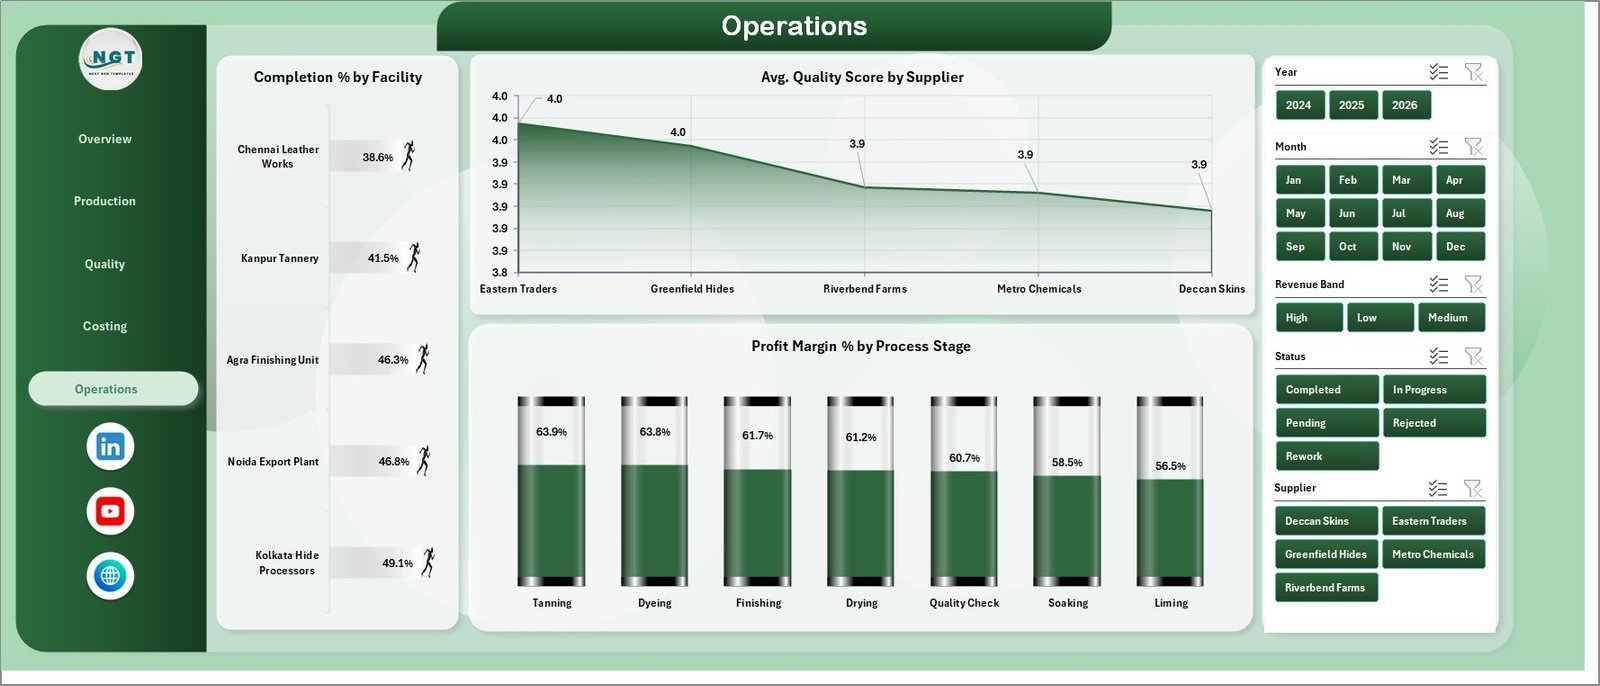
5 – Operations
The Operations tab reviews completion, supplier quality, and process-stage margin.
Completion % by Facility: This chart compares completion rate by facility. It helps identify locations that are finishing work efficiently and locations that need follow-up.
Avg. Quality Score by Supplier: This chart compares supplier quality performance. It helps procurement teams connect supplier choices with finished leather quality.
Profit Margin % by Process Stage: This chart shows margin by process stage. It helps users understand which stages support or reduce overall profitability.

Operations Sheet
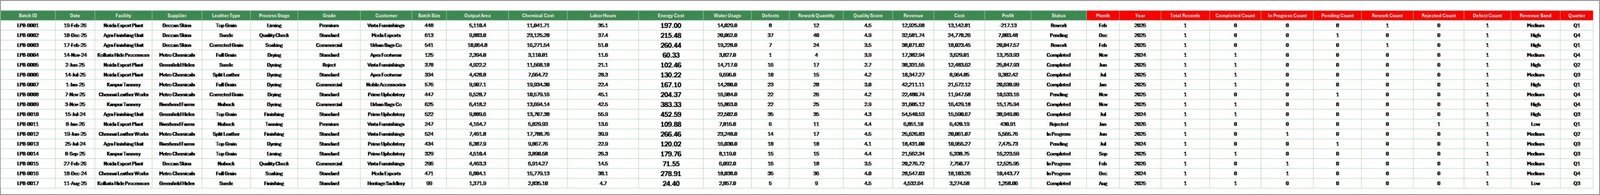
6 – Data Sheet Tab
The Data sheet is where you add or replace records in the same format as the sample data. After the data is updated, the connected pivots and dashboard visuals can be refreshed.
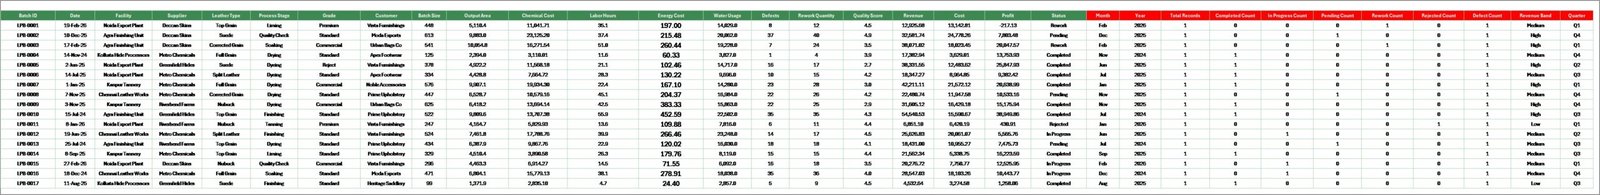
Data Sheet tab
7 – Support Sheet
The Support sheet contains the pivot tables used to make the dashboard dynamic. After updating the Data sheet, go to the Data tab in the Excel Ribbon and click Refresh All. You can keep this sheet hidden after setup.
Support sheet tab
Leather Processing Dashboard in Excel vs. Google Sheets vs. Paid CRM/SaaS – Where This Fits
| Feature | This Excel dashboard | Google Sheets alternative | Paid SaaS / ERP analytics |
|---|---|---|---|
| Cost | $17.99 one-time | Free to build manually | Monthly or annual subscription |
| Platform | Microsoft Excel | Browser + Google account | Vendor-hosted system |
| Setup time | Replace data and refresh | Build charts and formulas | Implementation project |
| Real-time team collaboration | Possible via shared workbook/OneDrive | Native collaboration | Usually included |
| Mobile access | Excel mobile or shared file | Browser/mobile app | Usually included |
| Customizable fields | Editable workbook | Editable sheet | Limited by vendor setup |
| Share with link | Possible via OneDrive | Yes | Login controlled |
| Year-1 cost at 5 users | $17.99 plus existing Excel licensing | $0 plus build time | Often hundreds or thousands |
| Leather processing pages | 7 ready worksheet tabs | Must be built | Depends on module |
Who This Template Is For – and Who It’s Not For
This template is for tannery owners, leather processing managers, production heads, quality teams, costing analysts, facility managers, procurement teams, and Excel users who need a practical dashboard for revenue, cost, profit, defects, output area, and supplier review. It is not a full ERP, inventory transaction system, laboratory information system, approval workflow, or live production machine integration.
How to Use the Leather Processing Dashboard in Excel
- Download and unzip the product file.
- Open the workbook in Microsoft Excel.
- Go to the Data sheet and replace the sample records using the same column format.
- Open the Data tab in the Excel Ribbon and click Refresh All.
- Use slicers on the dashboard pages to filter performance.
- Review the Overview, Production, Quality, Costing, and Operations pages.
Real-World Use Cases
Ramesh, tannery operations manager: Ramesh uses the Overview and Production pages each week to compare output area, revenue, and profit margin by facility before scheduling the next production run.
Anita, quality head: Anita reviews defect percentage by leather type and total defects by facility to focus inspection efforts where they matter most.
Marco, finance analyst: Marco uses the Costing page to compare cost by process stage and revenue by customer before monthly margin review.
Frequently Asked Questions
What software do I need?
You need Microsoft Excel to open, update, refresh, and customize the workbook.
How many sheets are included?
The workbook includes 7 sheets: Overview, Production, Quality, Costing, Operations, Data, and Support.
Can I add my own data?
Yes. Add or replace records in the Data sheet using the same format, then refresh all pivots and charts.
Can I hide the Support sheet?
Yes. The Support sheet contains pivot tables and can be hidden after setup.
Is this a full leather ERP system?
No. It is a reporting dashboard template, not a full ERP, inventory system, or production execution system.
Can I customize the dashboard?
Yes. Since it is an Excel workbook, you can adjust charts, fields, colors, formulas, and layout as needed.
About the Author
Built by PK – Microsoft Certified Professional with 15+ years of Excel, Google Sheets, and Power BI experience. Founder of NextGenTemplates, reaching 300K+ subscribers across YouTube channels. Every template is hand-built and tested before release.
Explore Related Templates
Explore more Excel dashboard templates and manufacturing Excel templates. You may also like the Leather Processing KPI Dashboard in Excel, Leather Processing KPI Dashboard in Power BI, and Industrial Gas Production Dashboard in Excel.
Ready to review leather processing performance in Excel? Download the Leather Processing Dashboard in Excel, update the data sheet, refresh all pivots, and start analyzing today.
Last updated: July 2, 2026


Reviews
There are no reviews yet.