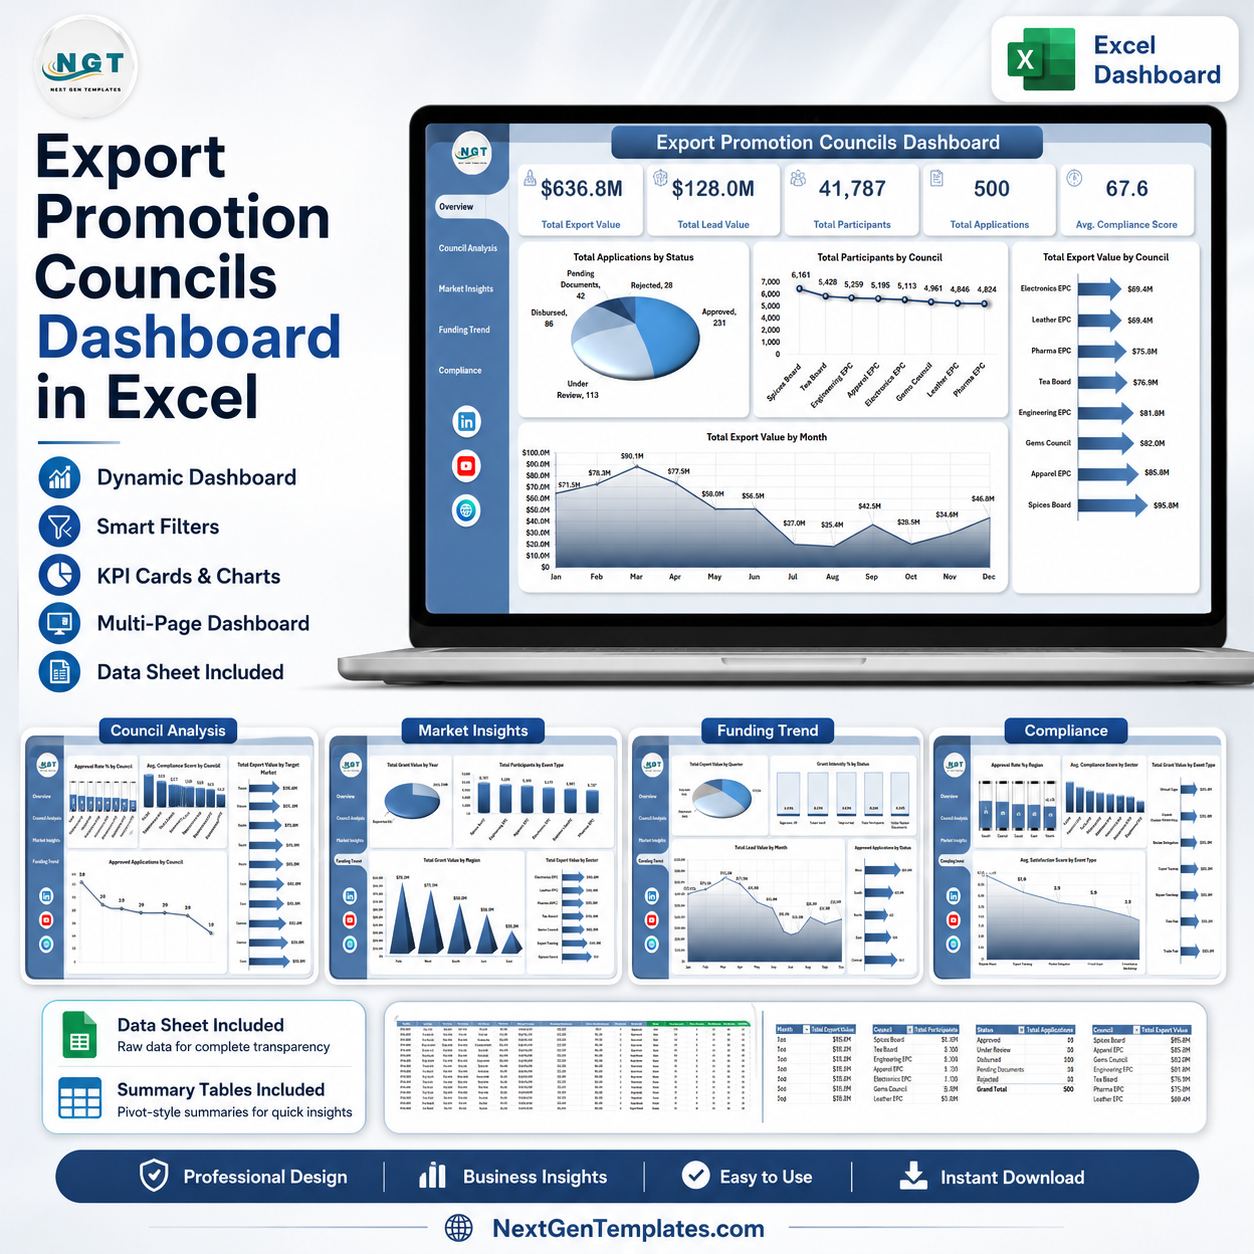


Export Promotion Councils Dashboard in Excel gives export promotion teams, trade bodies, government departments, and analysts a ready reporting workbook with 7 worksheet tabs, 5 executive KPI cards, 20 chart views, slicer-based filtering, and pivot-driven refresh. For $17.99 one-time, you get an editable Excel dashboard for export value, lead value, participants, applications, grant value, compliance, satisfaction, target markets, sectors, regions, and funding trends. Built by PK, Microsoft Certified Professional with 15+ years of Excel, Google Sheets, and Power BI experience and 300K+ YouTube subscribers, this template is designed for faster monthly reviews, clear stakeholder reporting, and practical customization without a dashboard SaaS subscription.
Key Features of Export Promotion Councils Dashboard in Excel
- 7 Excel worksheet tabs covering Overview, Council Analysis, Market Insights, Funding Trend, Compliance, Data Sheet, and Support Sheet.
- 5 high-level cards for Total Export Value, Total Lead Value, Total Participants, Total Applications, and Avg. Compliance Score.
- 20 chart views to analyze applications, participants, export value, grants, sectors, regions, status, markets, quarters, and months.
- Multiple slicers help users filter the dashboard quickly by the available export promotion dimensions.
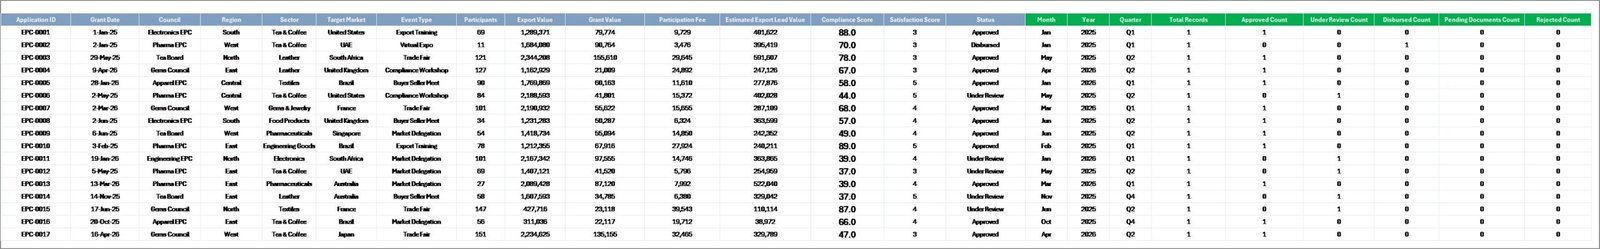
- Editable Data Sheet lets users replace sample records with their own export promotion council data in the same format.
- Pivot-driven Support Sheet powers dynamic cards and charts and can be hidden in the final user copy.
- No macros required; the workbook uses Excel tables, pivot tables, charts, and slicers.
What’s Inside the Export Promotion Councils Dashboard in Excel
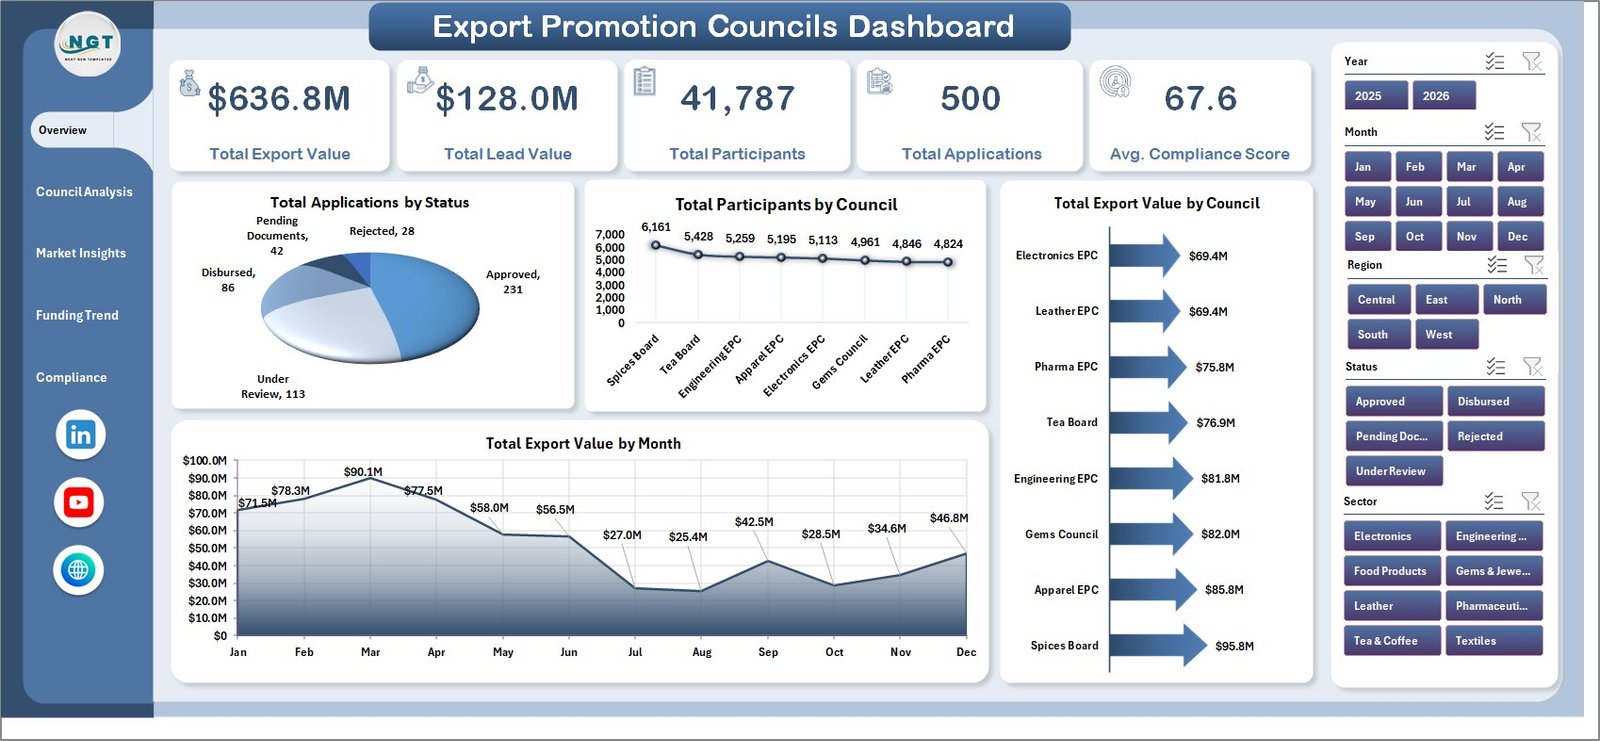
1. Overview Page
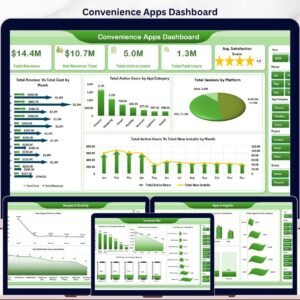
The Overview Page gives leadership a quick summary of export promotion performance. The top cards show Total Export Value, Total Lead Value, Total Participants, Total Applications, and Avg. Compliance Score so users can review scale, pipeline, engagement, application volume, and governance quality in one view.
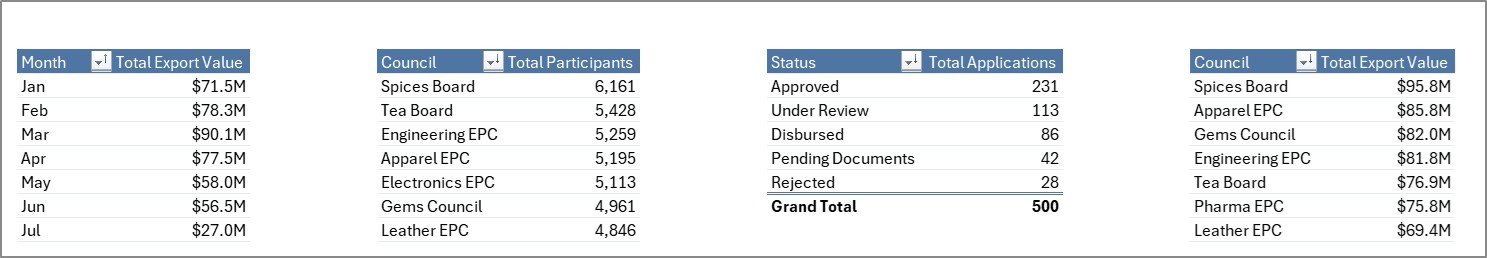
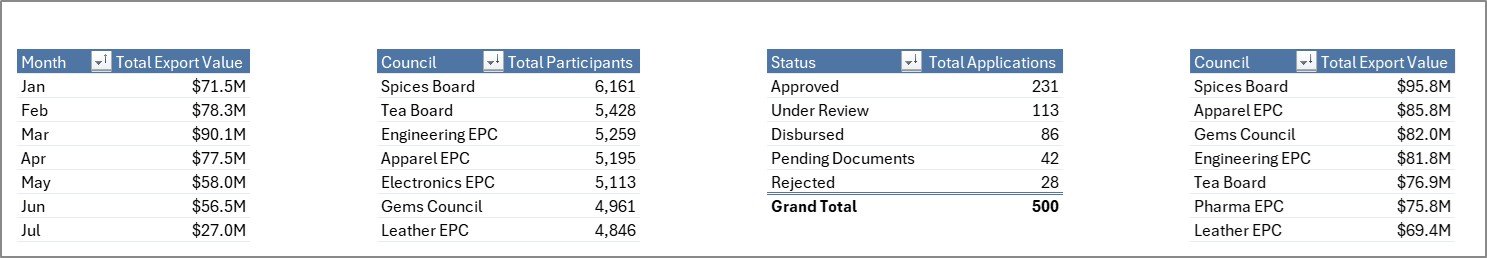
Total Applications by Status: This chart separates applications by approval or processing status. It helps teams see bottlenecks, pending workload, and completed application flow without scanning raw rows.
Total Participants by Council: This chart compares participant reach across councils. It helps identify councils with strong engagement and councils that may need additional outreach.
Total Export Value by Council: This visual shows which councils are contributing the highest export value. It supports performance comparison and budget discussion across council portfolios.
Total Export Value by Month: This monthly trend highlights export value movement over time. It helps users detect growth, seasonality, and periods requiring follow-up analysis.
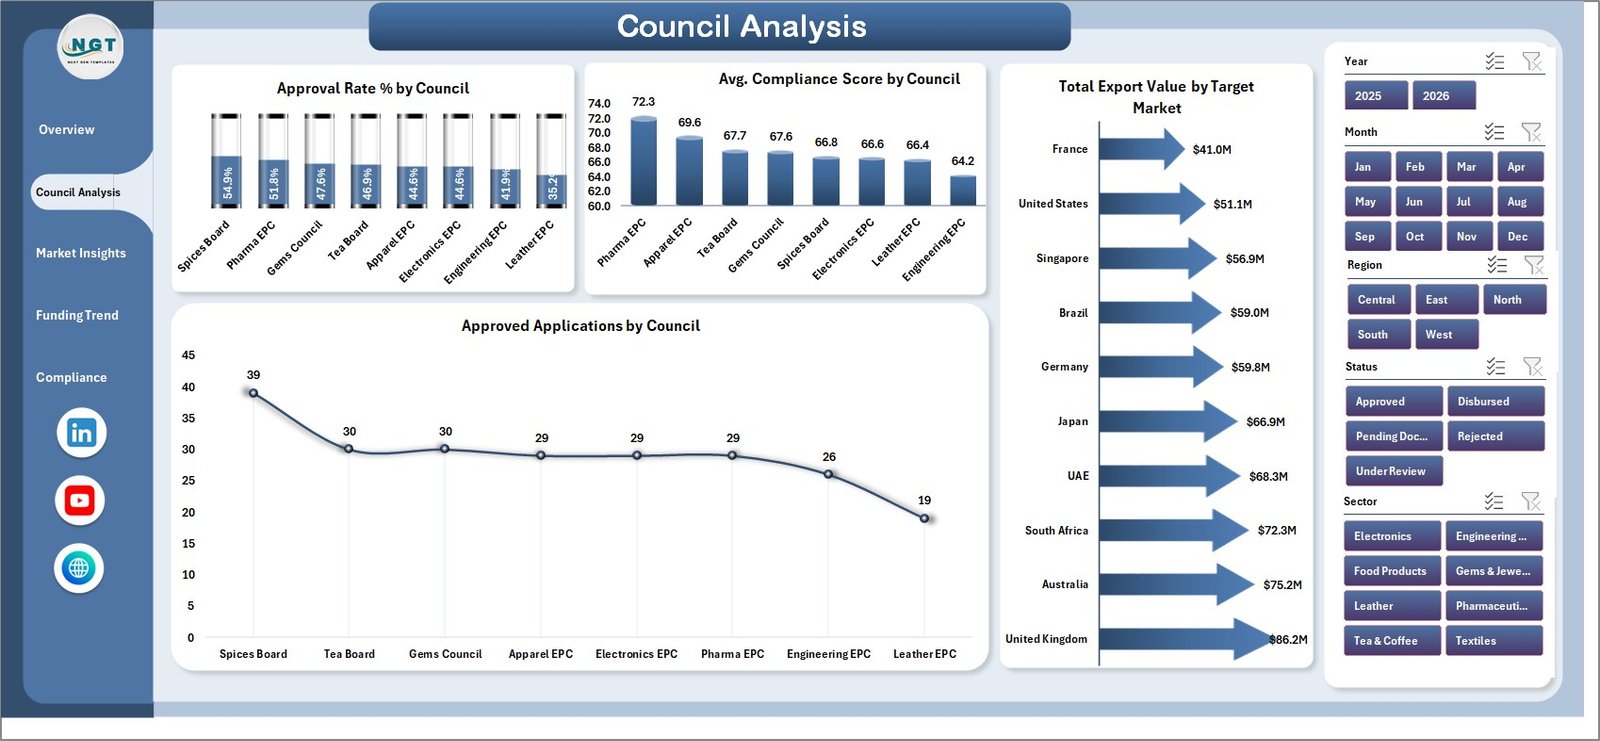
2. Council Analysis
The Council Analysis tab compares council-level approval, compliance, export value, and approved application performance. It includes Approval Rate % by Council, Avg. Compliance Score by Council, Total Export Value by Target Market, and Approved Applications by Council.
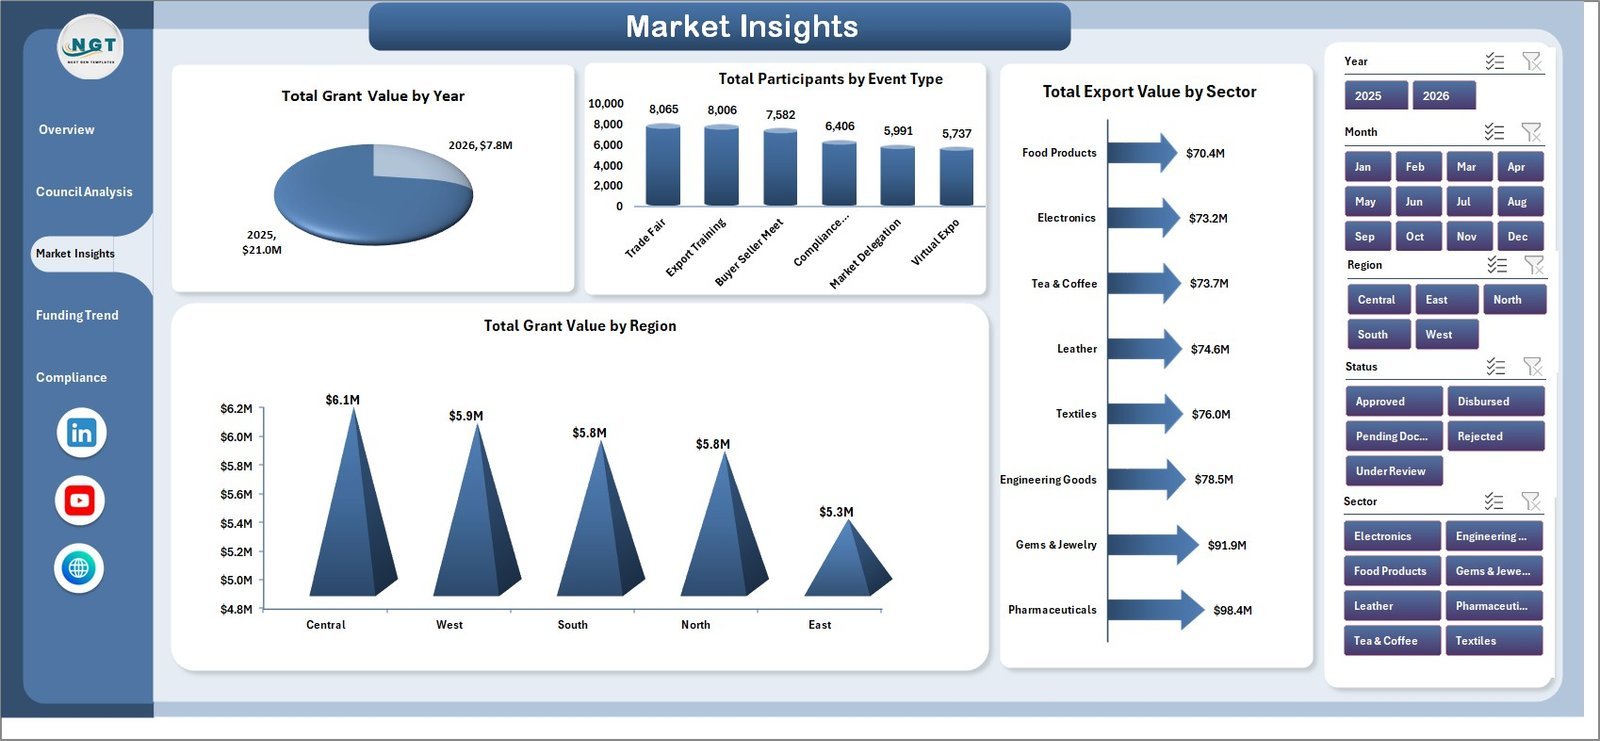
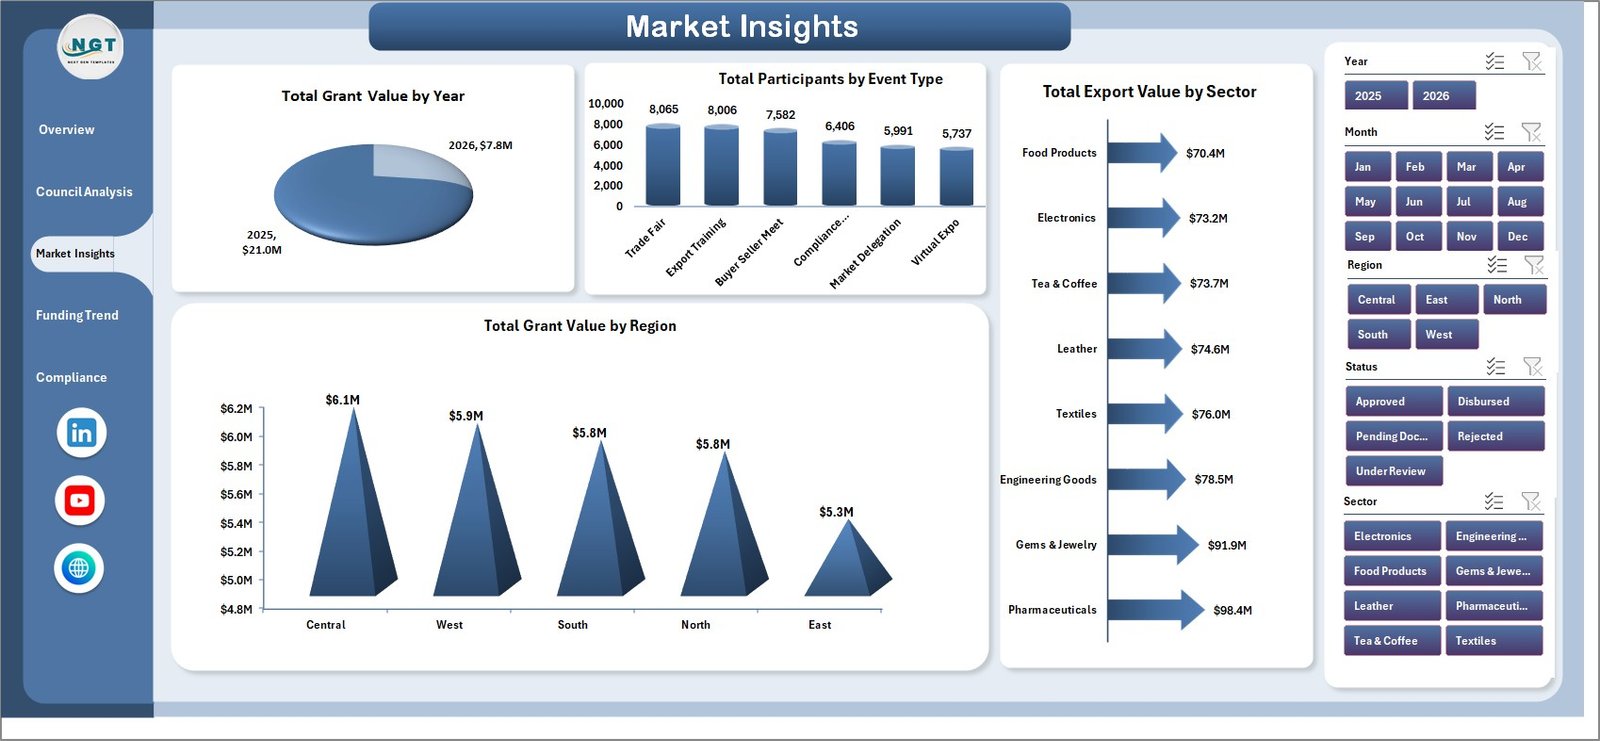
3. Market Insights
The Market Insights page shows where funding, participation, export value, and regional activity are concentrated. It includes Total Grant Value by Year, Total Participants by Event Type, Total Export Value by Sector, and Total Grant Value by Region.
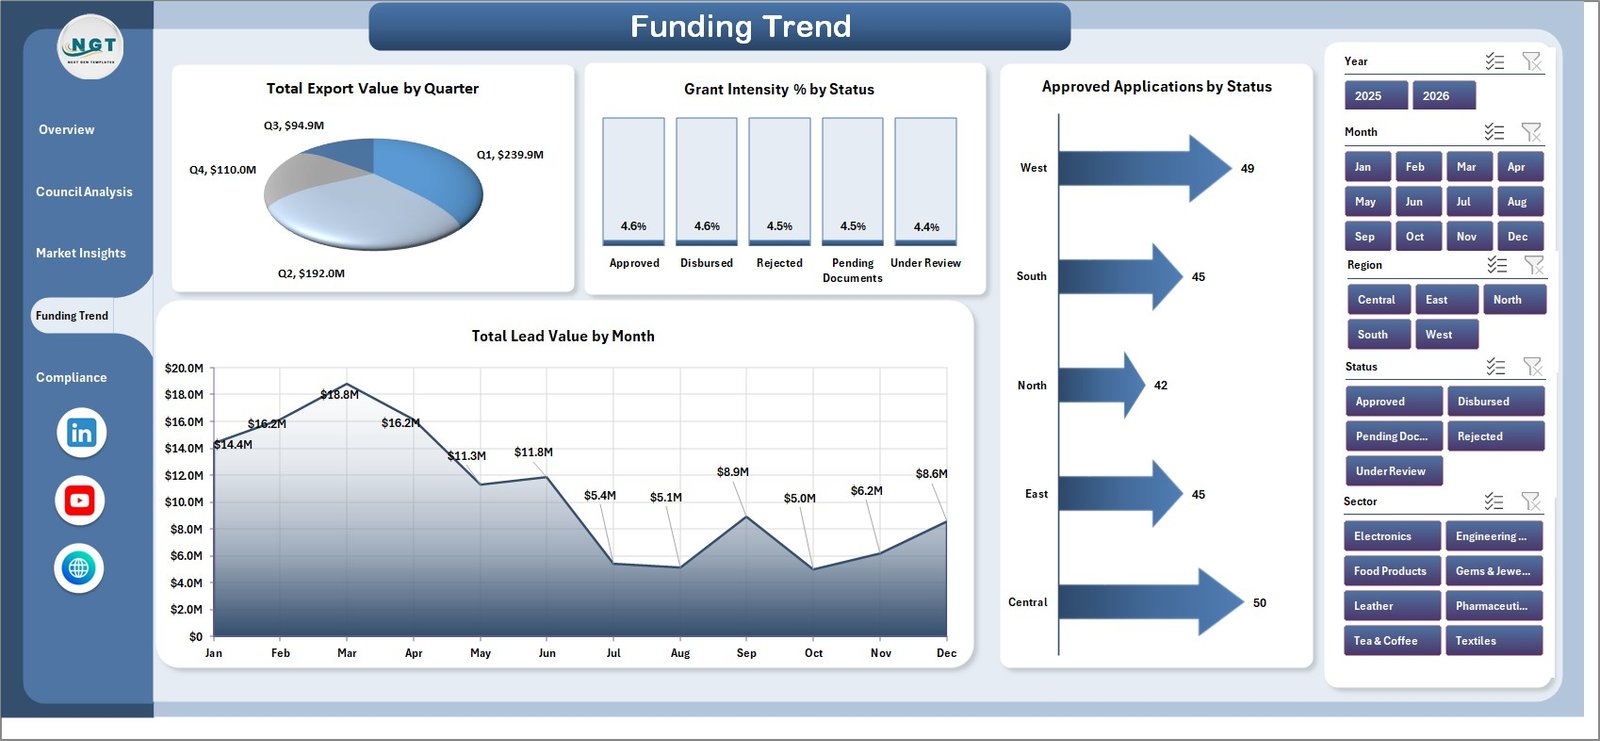
4. Funding Trend
The Funding Trend tab focuses on export value and grant movement over time and status. It includes Total Export Value by Quarter, Grant Intensity % by Status, Approved Applications by Status, and Total Lead Value by Month.
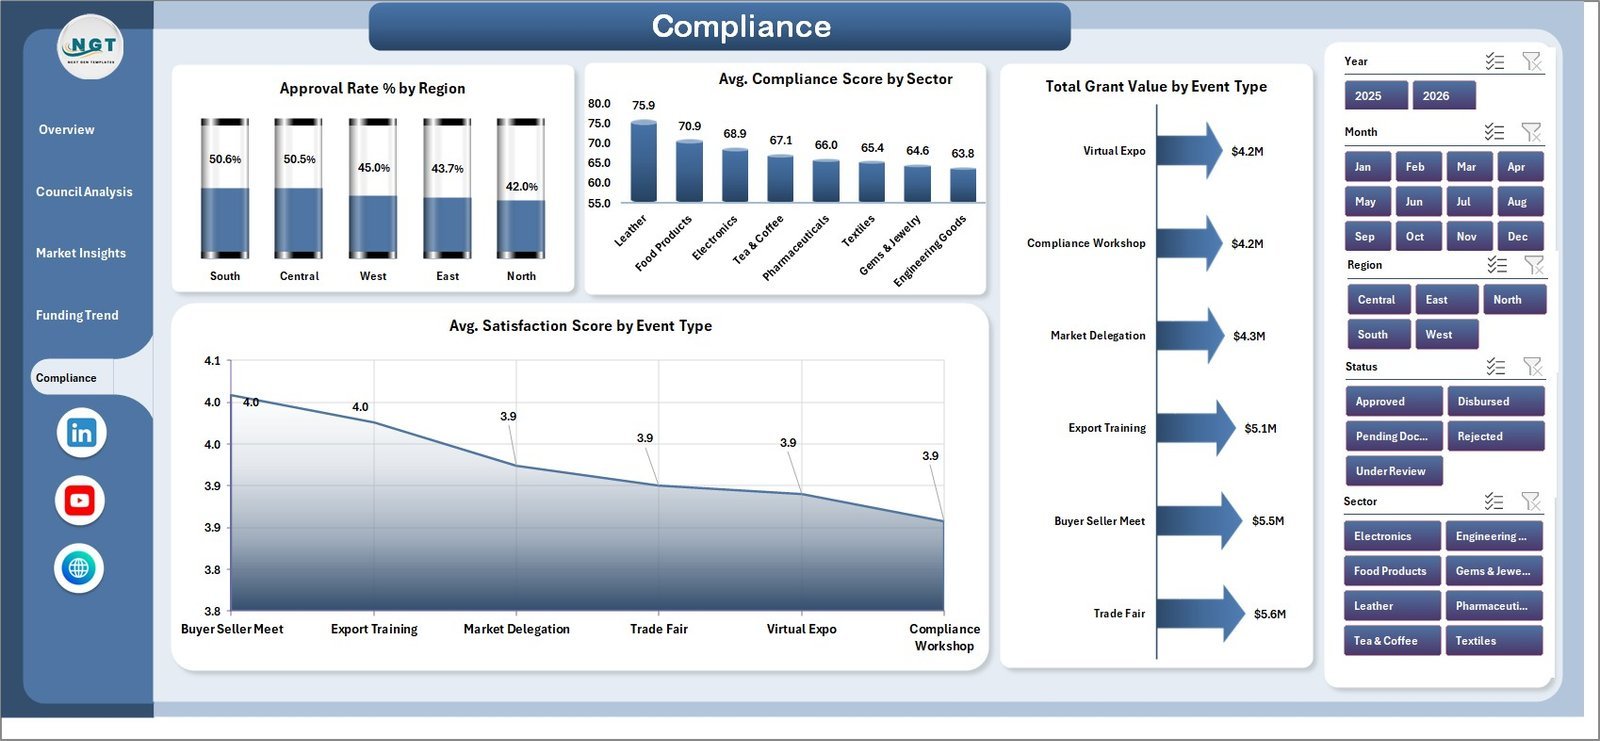
5. Compliance
The Compliance page helps users connect approval rates, compliance scores, grant value, and satisfaction results. It includes Approval Rate % by Region, Avg. Compliance Score by Sector, Total Grant Value by Event Type, and Avg. Satisfaction Score by Event Type.

6. Data Sheet Tab
The Data Sheet is where users enter export promotion records in the same structured format. Replace the sample rows, keep the headers consistent, and refresh the workbook to update all dashboard pages.

7. Support Sheet
The Support Sheet contains the pivot tables used to create the dashboard dynamically. After updating the Data Sheet, go to the Data tab in the Excel Ribbon and click Refresh All. All pivots, cards, and charts refresh together, and this sheet can be hidden for regular users.
Export Promotion Councils Dashboard in Excel vs. Google Sheets vs. Paid CRM/SaaS – Where This Fits
| Feature | This Excel Dashboard | Google Sheets Alternative | Paid CRM/SaaS |
|---|---|---|---|
| Cost | $17.99 one-time | Low software cost, manual build time | Monthly or annual subscription |
| Platform | Microsoft Excel | Google Sheets | Vendor cloud platform |
| Setup time | Replace data and refresh pivots | Build charts, formulas, and slicers manually | Configuration and onboarding |
| Real-time team collaboration | Available through OneDrive or SharePoint | Native browser collaboration | Usually included by license |
| Mobile access | Possible through Excel mobile or cloud storage | Available in browser and app | Usually available |
| Customizable fields | Fully editable workbook | Editable if built manually | Limited by vendor settings |
| Share with link | Possible through Microsoft cloud storage | Built in | Usually login controlled |
| Year-1 cost at 5 users | $17.99 plus existing Excel access | Low software cost, higher build effort | Often hundreds or thousands |
| Export council reporting | Included across 5 dashboard pages | Requires custom build | Depends on plan and configuration |
Who This Template Is For – and Who It’s Not For
This template is for export promotion councils, trade promotion agencies, government export departments, chambers of commerce, sector councils, grant managers, program managers, and analysts who need recurring reporting on applications, export value, grants, markets, regions, sectors, participants, approval rates, compliance, and satisfaction.
It is not a live trade portal, application submission system, grant payment platform, CRM replacement, or automated policy workflow. It works best as a reporting dashboard when the source data is already available in clean rows and columns.
How to Use the Export Promotion Councils Dashboard in Excel
- Download and unzip the Excel dashboard package.
- Open the workbook in Microsoft Excel.
- Go to the Data Sheet and replace sample records with your own export promotion data.
- Keep the same headers and field structure where possible.
- Open the Data tab in the Excel Ribbon and click Refresh All.
- Use slicers across the Overview, Council Analysis, Market Insights, Funding Trend, and Compliance pages.
- Hide the Support Sheet when sharing the workbook with end users.
Real-World Use Cases
Anita, export council program manager: Anita reviews the Overview and Council Analysis pages before monthly governance meetings to explain total export value, participant reach, application status, and approval rates.
Rahul, trade data analyst: Rahul updates the Data Sheet each month, refreshes pivots, and uses Market Insights to identify strong sectors, target markets, regions, and event types.
Meera, grant operations lead: Meera uses Funding Trend and Compliance to connect grants, lead value, approval status, satisfaction score, and compliance results before funding review calls.
Frequently Asked Questions
What does this Excel dashboard track?
It tracks export value, lead value, participants, applications, approval rate, compliance score, grant value, satisfaction score, councils, sectors, regions, target markets, event types, statuses, months, quarters, and years.
How many worksheet tabs are included?
The workbook includes seven tabs: Overview, Council Analysis, Market Insights, Funding Trend, Compliance, Data Sheet, and Support Sheet.
Does this dashboard require macros?
No. It is built with Excel tables, pivot tables, slicers, cards, and charts.
Can I use my own council names, sectors, and regions?
Yes. Replace the sample records in the Data Sheet while keeping the same structure. The dashboard refreshes from the updated fields.
How do I refresh the dashboard?
After updating the Data Sheet, go to the Data tab in Excel and click Refresh All. The pivots, cards, and charts update together.
Can the dashboard be customized?
Yes. You can edit chart titles, colors, slicers, pivot fields, formulas, sheet names, and layout elements.
About the Author
Built by PK – Microsoft Certified Professional with 15+ years of Excel, Google Sheets, and Power BI experience. Founder of NextGenTemplates, reaching 300K+ subscribers across YouTube channels. Every template is hand-built and tested before release.
Explore Related Templates
- Export Promotion Councils KPI Dashboard in Excel
- ERP SaaS Startups Dashboard in Excel
- Browse Excel Dashboard Templates
- Browse MS Excel Templates
Download the Export Promotion Councils Dashboard in Excel and turn council applications, export value, grants, compliance, and market data into clear monthly reporting.
Last updated: June 10, 2026.


Reviews
There are no reviews yet.