

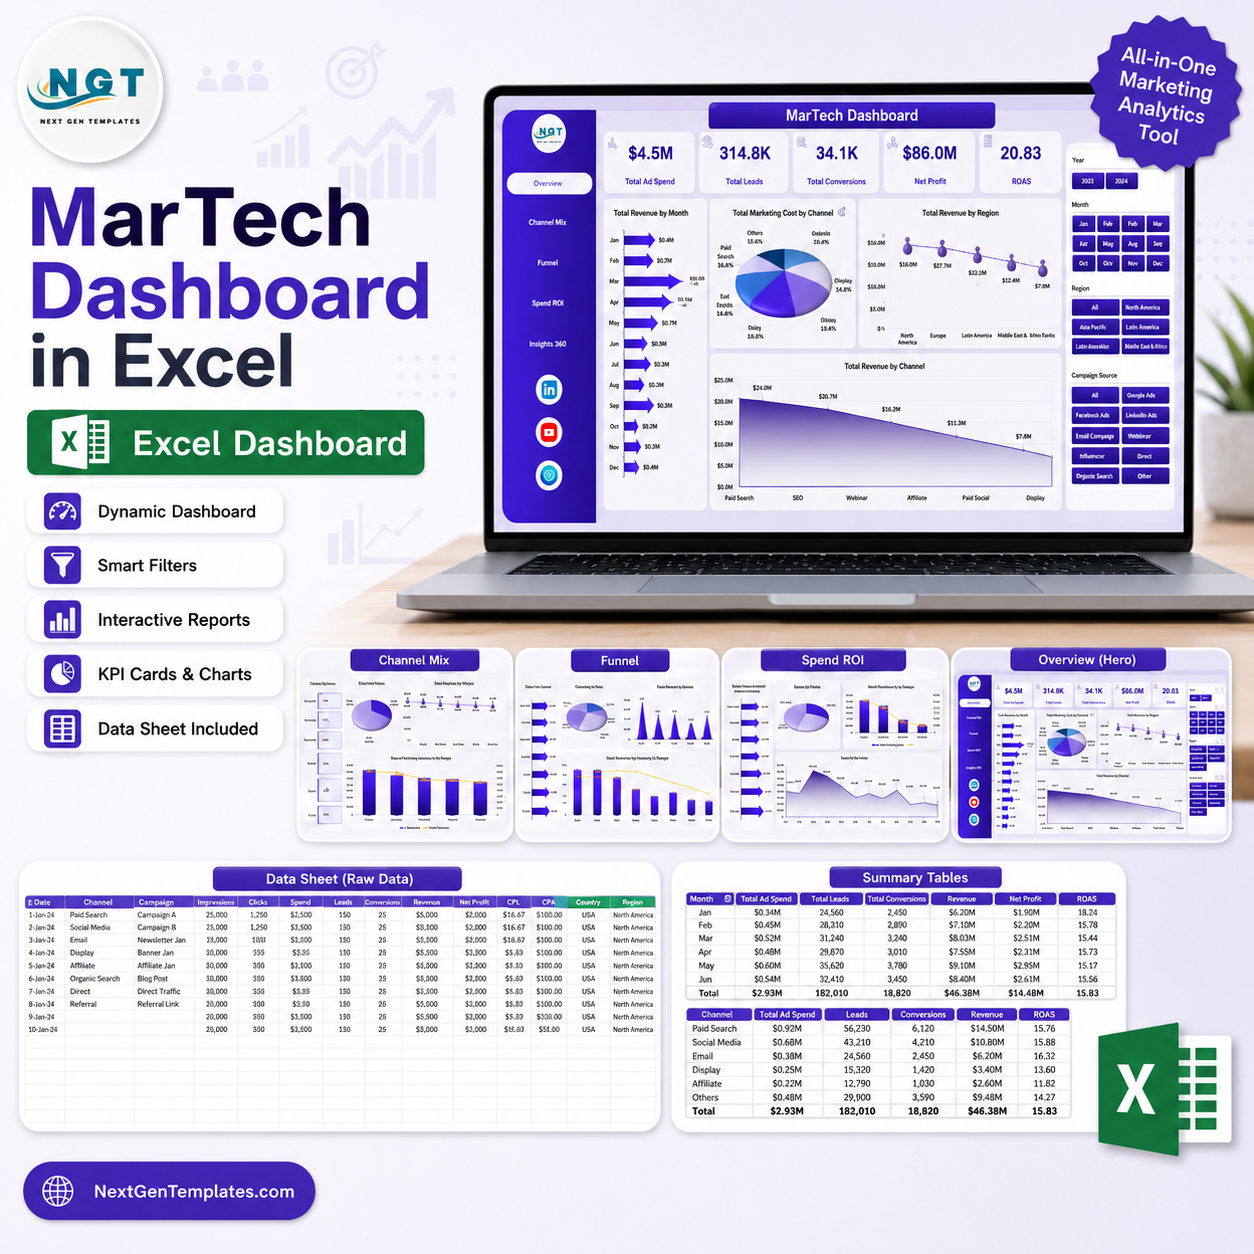


MarTech Dashboard in Excel helps marketing leaders track ad spend, leads, conversions, net profit, ROAS, revenue, channel cost, regional performance, funnel movement, and campaign ROI in one editable workbook. Instead of paying monthly SaaS fees for a reporting view your team may still export to Excel, you get a one-time $17.99 dashboard that can be updated from your own campaign data. Replace the sample records, click Data > Refresh All, and the cards, charts, slicers, and pivot-driven pages refresh together.
Instant download. One-time payment. No subscription. No per-user fees. Lifetime access.
Key Features of MarTech Dashboard in Excel
- 5 KPI cards for Total Ad Spend, Total Leads, Total Conversions, Net Profit, and ROAS.
- 5 analysis pages covering Overview, Channel Mix, Funnel, Regional, and Spend ROI reporting.
- 20 chart views for revenue, cost, clicks, conversions, campaign status, regions, owners, funnel stages, channels, devices, and audience segments.
- Interactive slicers help you filter marketing data quickly during review meetings.
- Data Sheet included so you can paste campaign records in the same format.
- Support Sheet included with pivot tables that power every dashboard chart dynamically.
- No macros required; the workbook uses native Excel tables, pivots, charts, and slicers.
What’s Inside the MarTech Dashboard in Excel
1. Overview Page
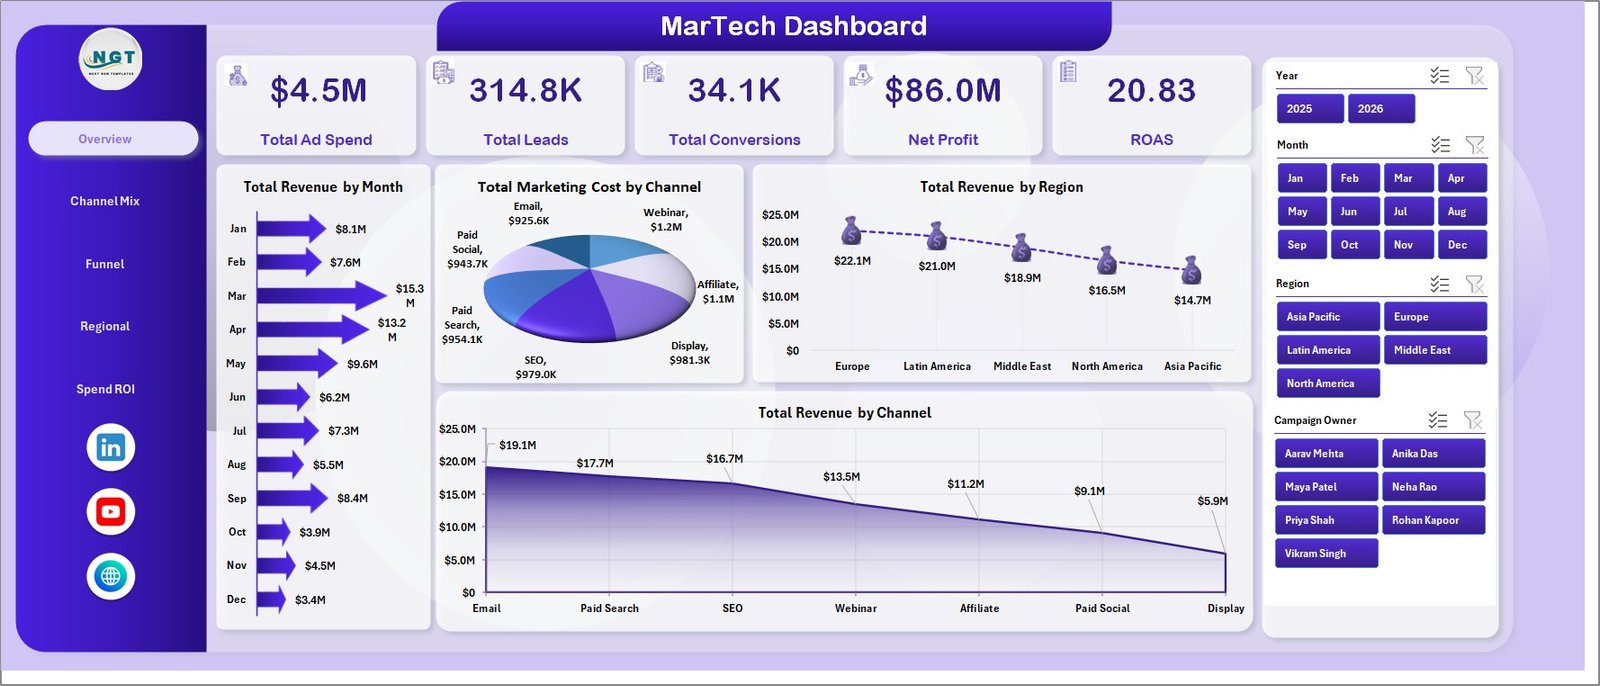
The Overview Page gives executives a high-level view of marketing performance. The KPI cards summarize Total Ad Spend, Total Leads, Total Conversions, Net Profit, and ROAS, while slicers let users filter the dashboard without rebuilding reports.
Total Revenue by Month: This chart shows how revenue changes across each month. Use it to identify seasonal movement, campaign lift, or months that need deeper investigation.
Total Marketing Cost by Channel: This chart compares spend across marketing channels. It helps reveal which channels consume the most budget and where cost control may be needed.
Total Revenue by Region: This chart highlights regional revenue contribution. It helps marketing teams see which markets are producing stronger commercial results.
Total Revenue by Channel: This chart compares revenue by acquisition channel. It helps connect channel activity with actual revenue outcomes, not only clicks or leads.
2. Channel Mix
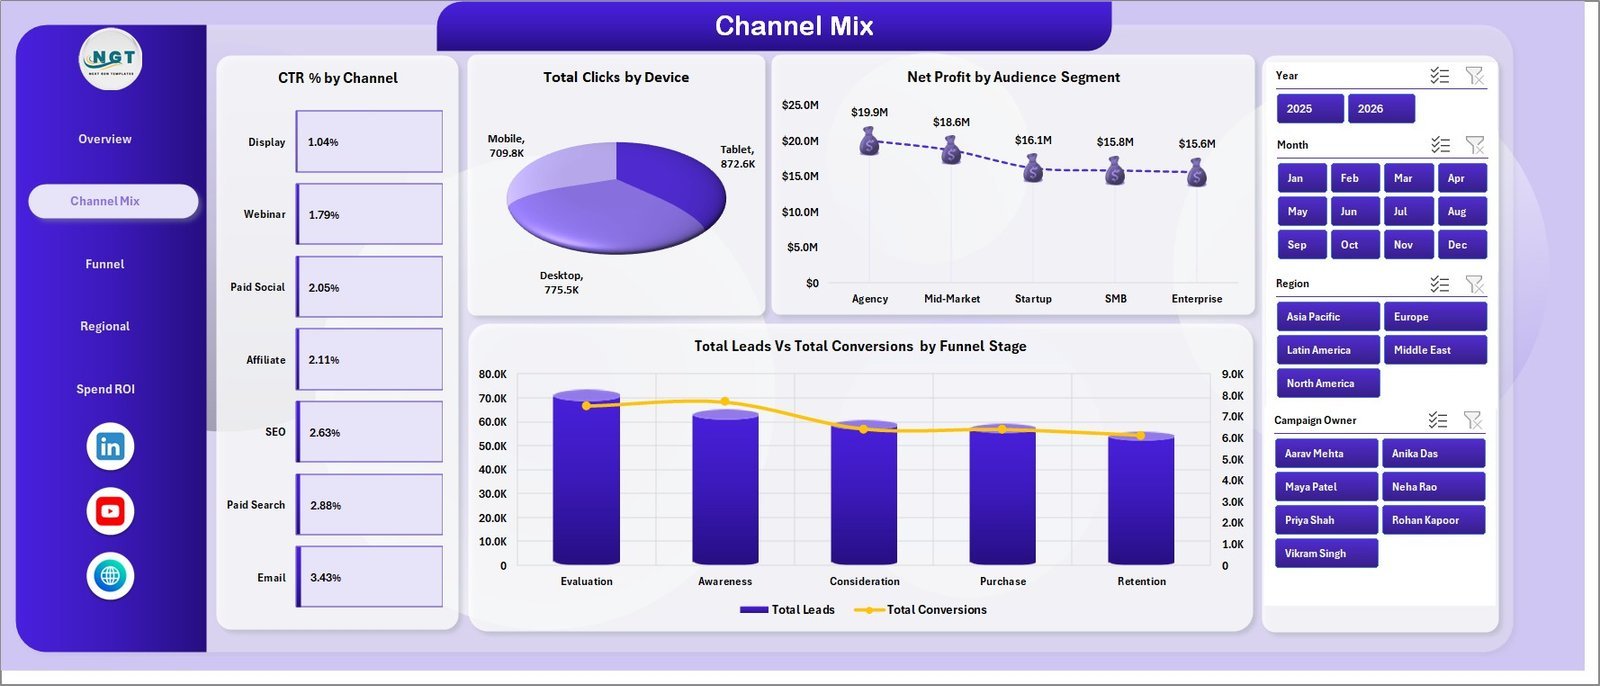
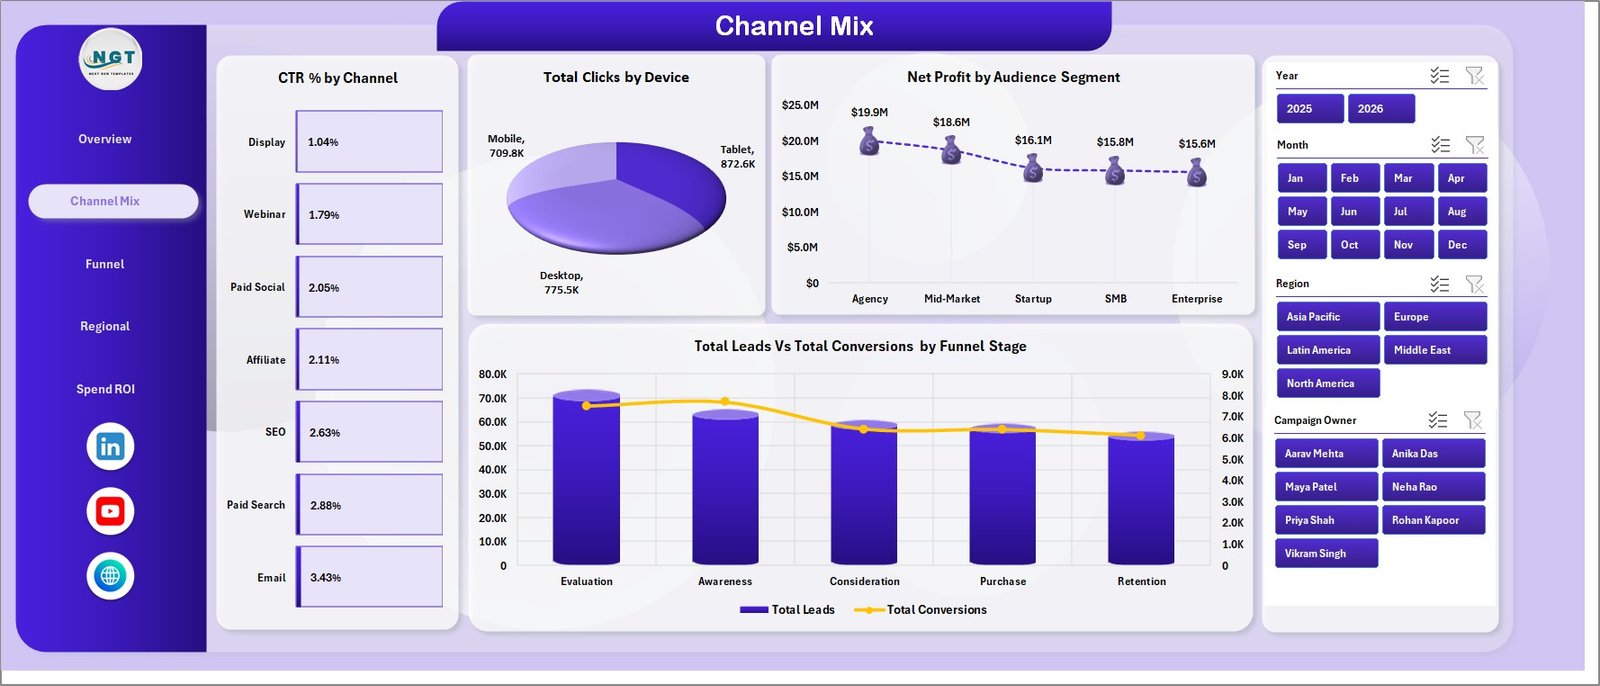
The Channel Mix page explains how traffic, clicks, profit, leads, conversions, and funnel stages behave across channels, devices, and audience segments. It includes CTR % by Channel, Total Clicks by Device, Net Profit by Audience Segment, and Total Leads and Total Conversions by Funnel Stage.
3. Funnel
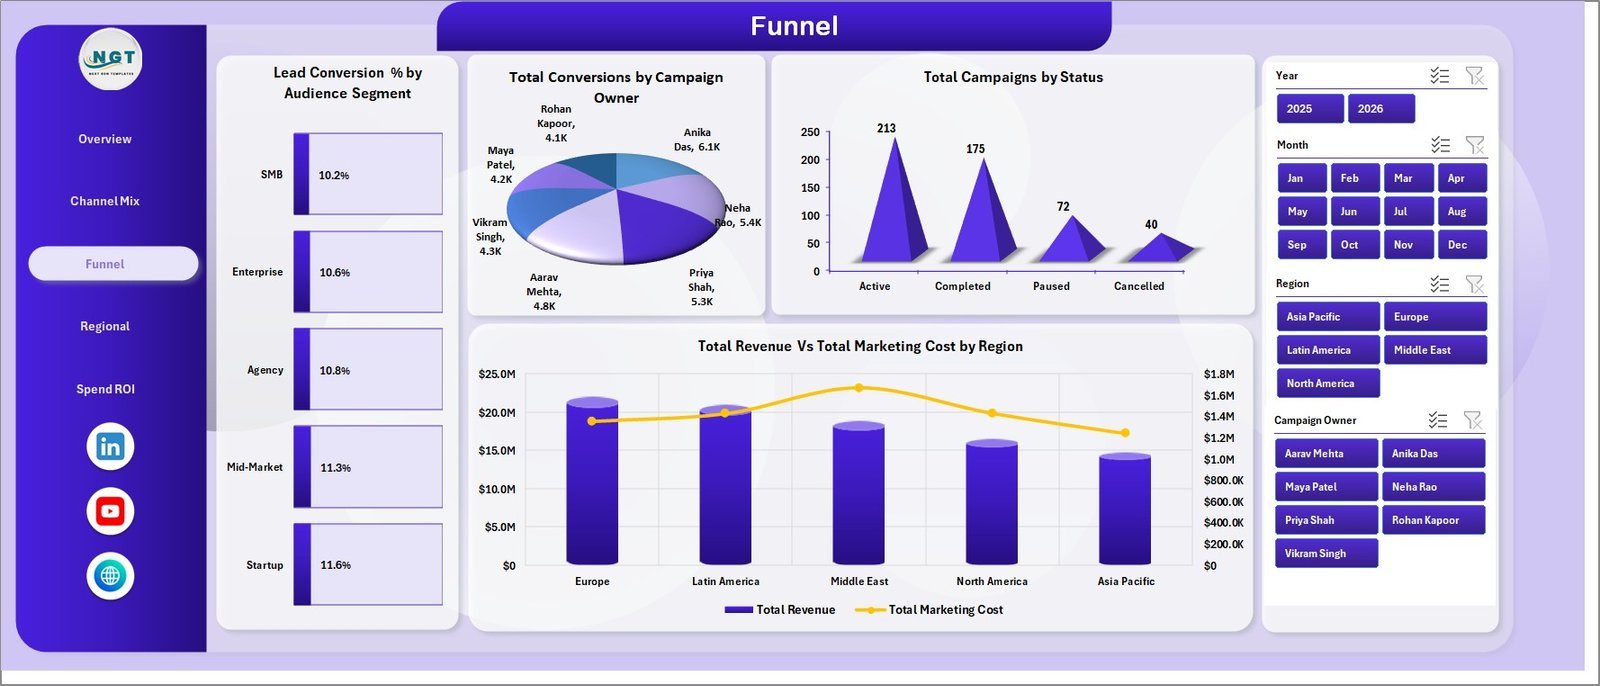
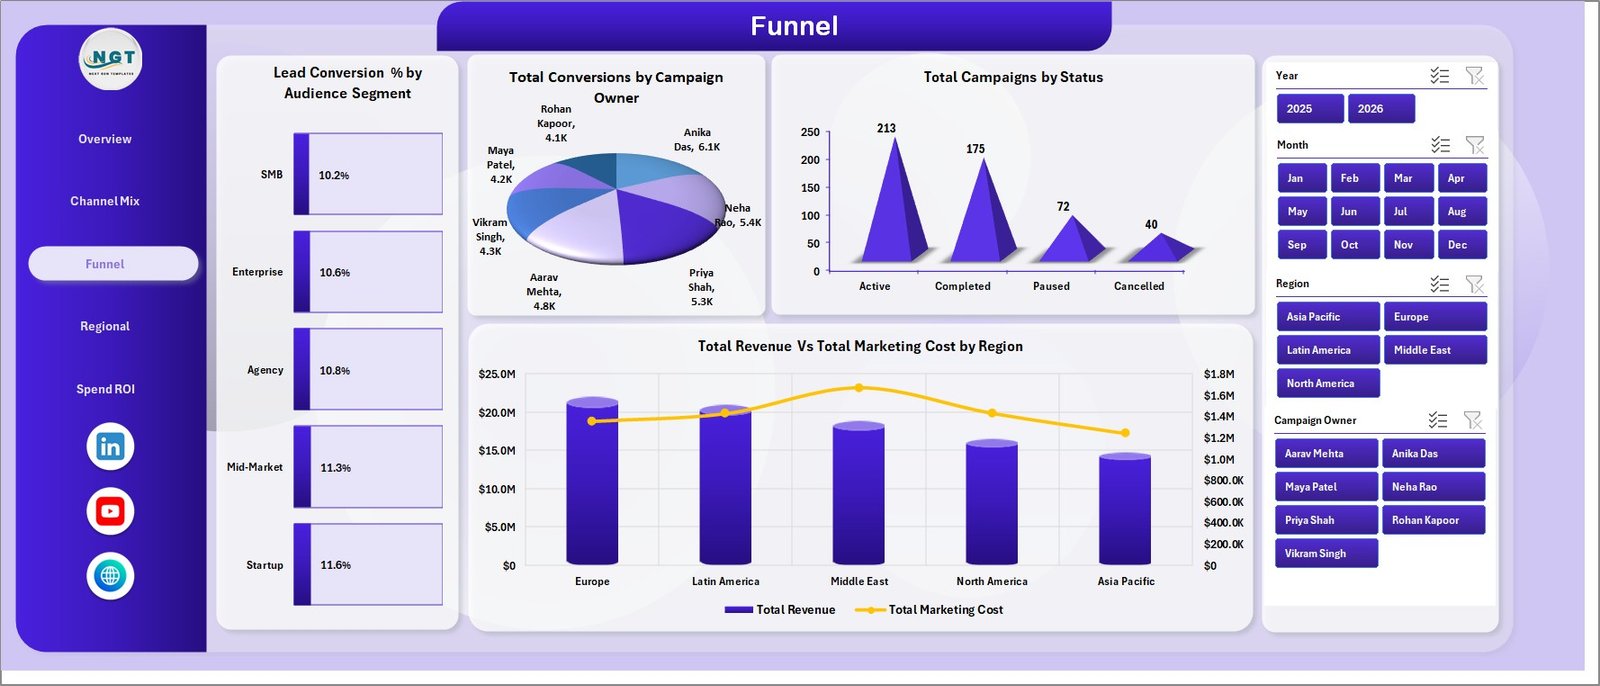
The Funnel page is designed for conversion review. It includes Lead Conversion % by Audience Segment, Total Conversions by Campaign Owner, Total Campaigns by Status, and Total Revenue and Total Marketing Cost by Region.
4. Regional
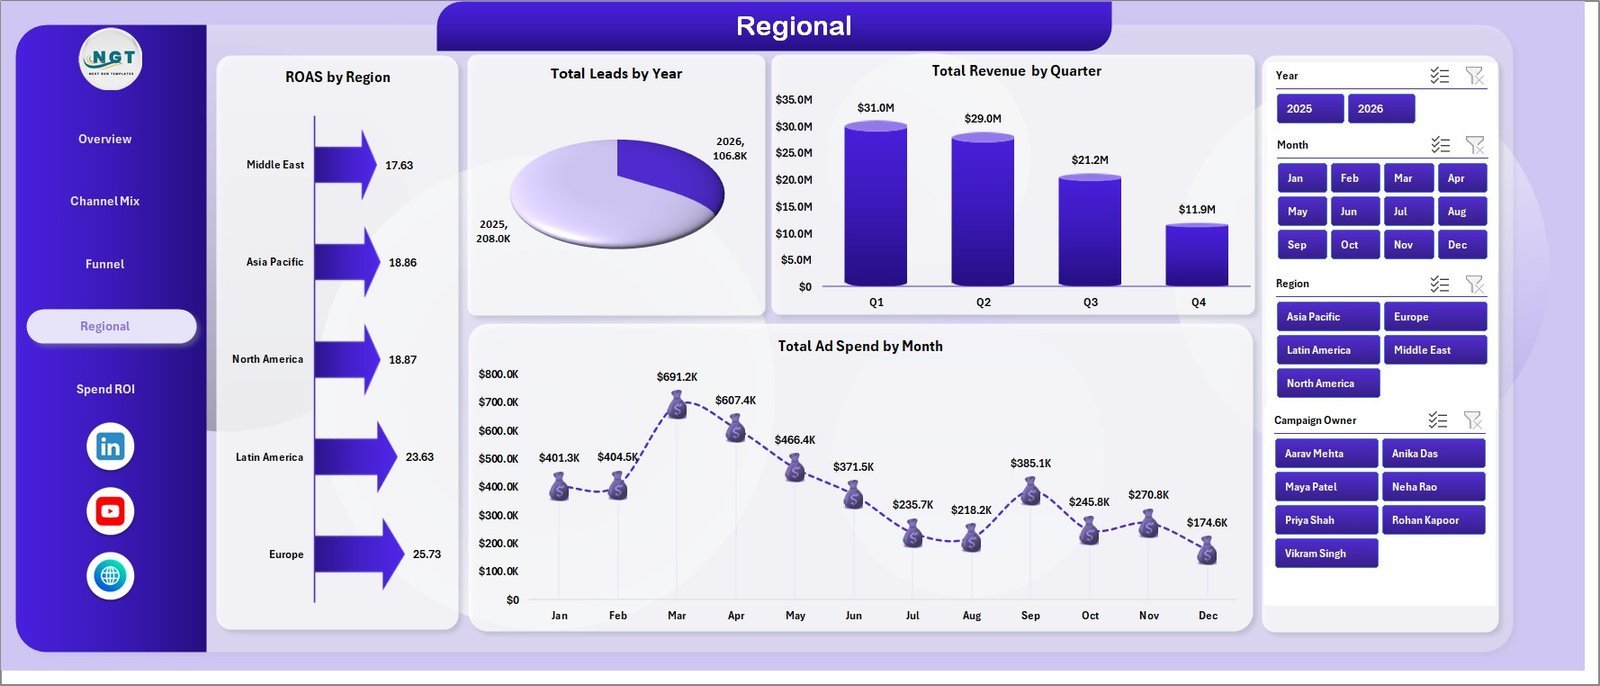
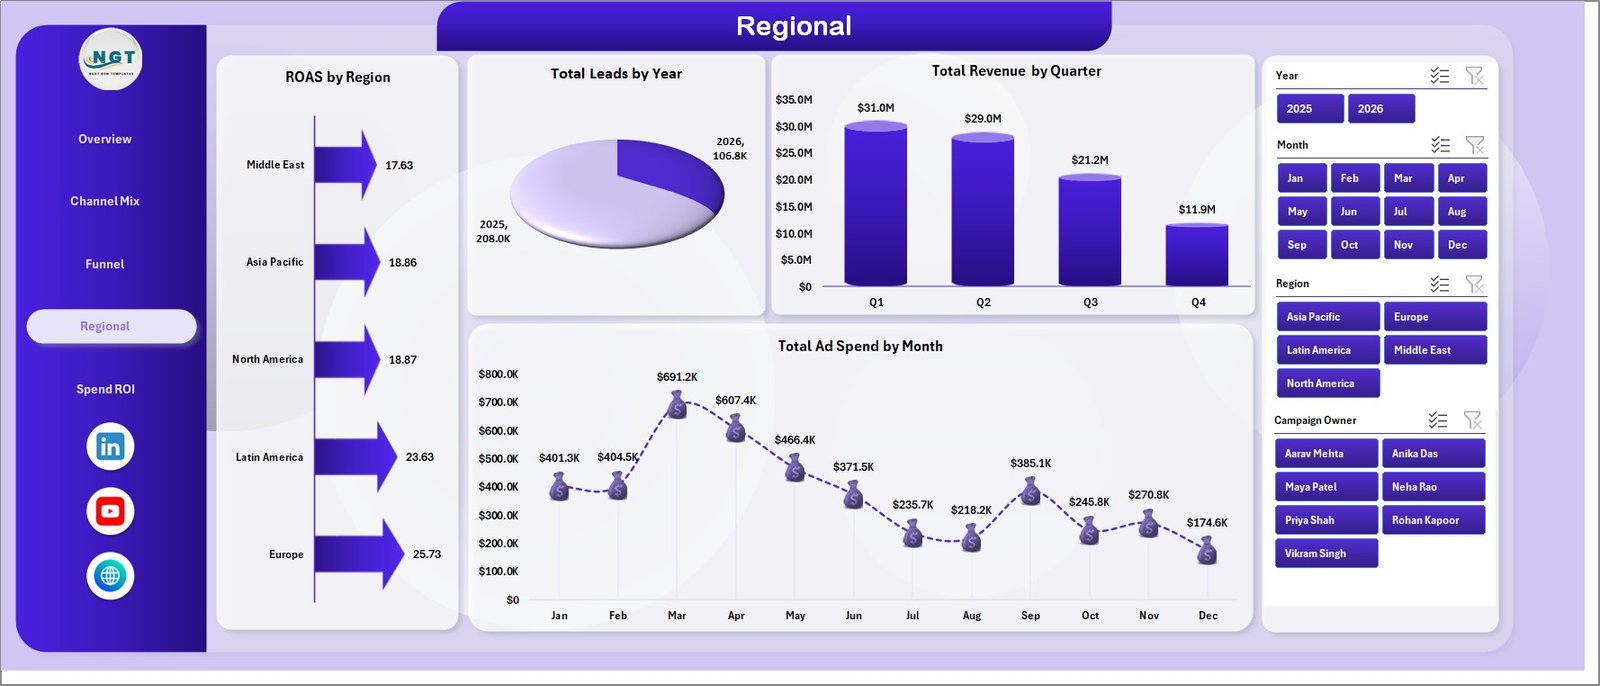
The Regional page focuses on geographic and time-based marketing performance. It includes ROAS by Region, Total Leads by Year, Total Revenue by Quarter, and Total Ad Spend by Month.
5. Spend ROI
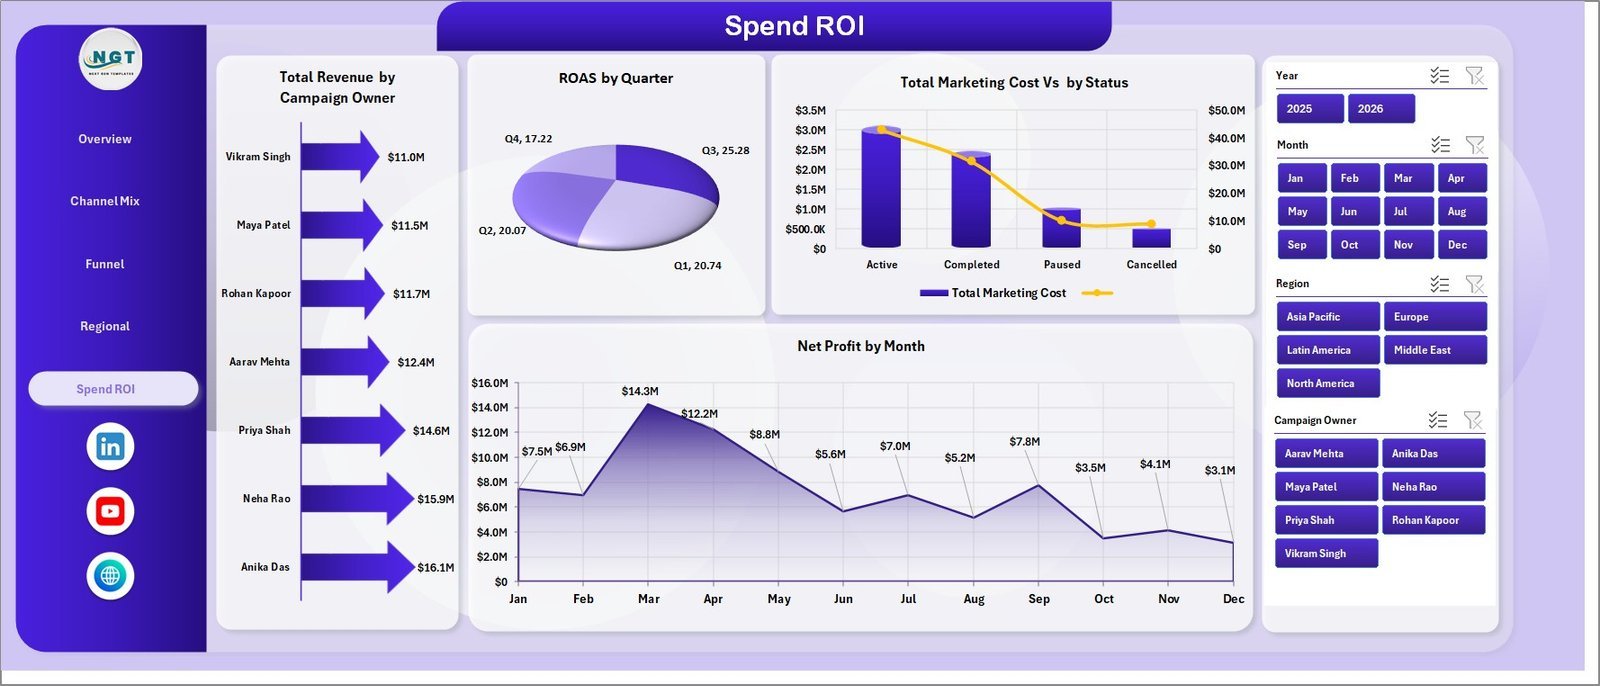
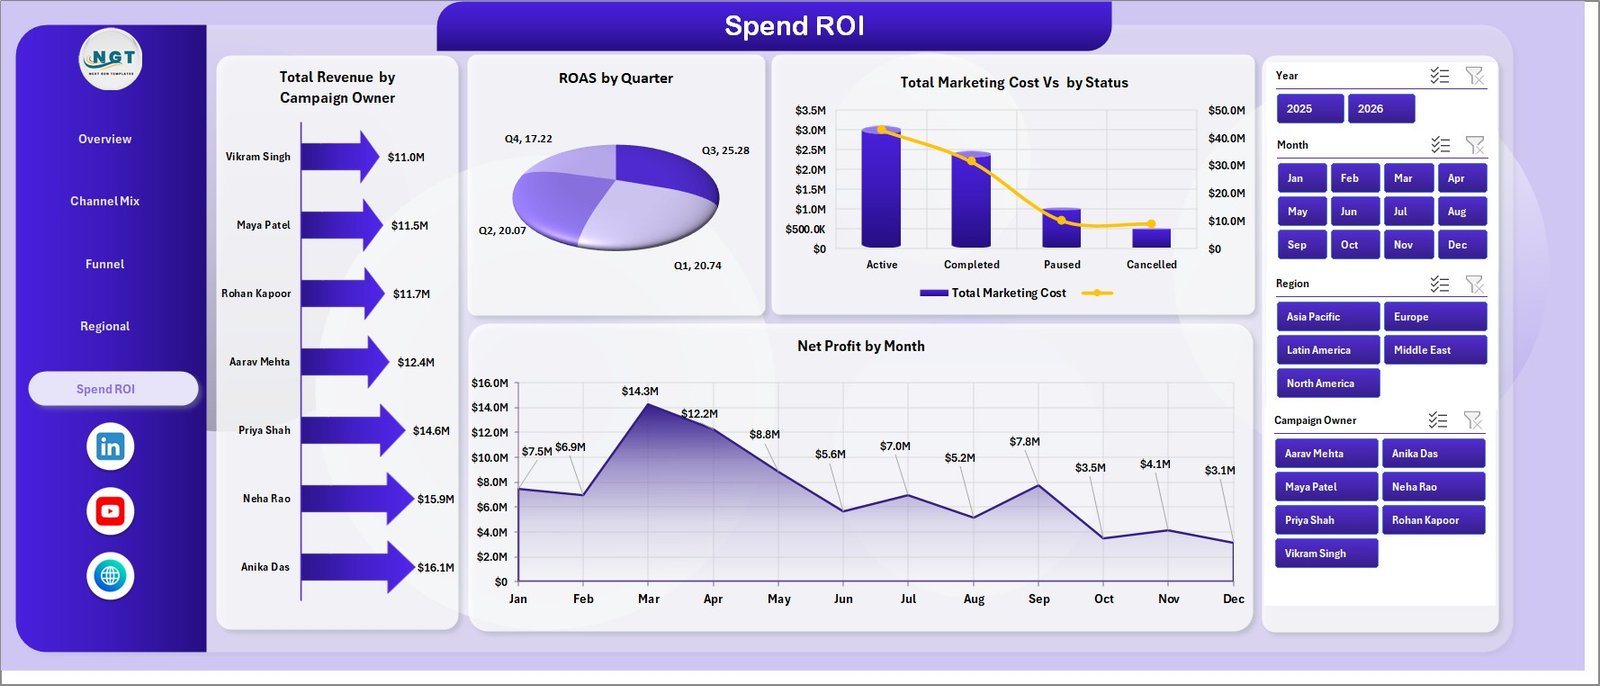
The Spend ROI page connects ownership, spend, return, campaign status, and profit trends. It includes Total Revenue by Campaign Owner, ROAS by Quarter, Total Marketing Cost by Status, and Net Profit by Month.
6. Data Sheet Tab
The Data Sheet is where users add MarTech campaign records in the same column format. Keep the structure intact, paste or replace records, and refresh the workbook to update every card, chart, and slicer.

7. Support Sheet
The Support Sheet contains pivot tables that create the dashboard dynamically. After updating the Data Sheet, go to the Data tab in Excel and click Refresh All. You can keep this sheet hidden during normal dashboard use.

MarTech Dashboard in Excel vs. Google Sheets vs. Paid CRM/SaaS – Where This Fits
| Feature | This Excel Dashboard | Google Sheets Alternative | Paid Marketing SaaS |
|---|---|---|---|
| Cost | $17.99 one-time | Low tool cost plus setup time | $50-$500+ per user/month |
| Platform | Microsoft Excel | Browser spreadsheet | Vendor cloud app |
| Setup time | Under 10 minutes | 30-90 minutes if built manually | Days or weeks of setup |
| Real-time collaboration | Possible with OneDrive | Native collaboration | Usually seat-based |
| Customizable fields | Fully editable workbook | Editable but can break | Limited by vendor schema |
| Year-1 cost at 5 users | $17.99 total | Low tool cost plus build time | $3,000-$30,000+ |
| Marketing ROI reporting | Built-in ROAS, profit, spend, and funnel views | Must be built | Depends on plan and integrations |
Who This Template Is For – and Who It’s Not For
This template is for marketing managers, campaign owners, MarTech analysts, agency reporting teams, CMOs, and small business owners who already collect campaign data and need a clean Excel reporting layer.
It is not a replacement for live ad platform APIs, attribution modeling software, automated bidding tools, or a full CRM. Use it when you want structured marketing performance reporting without another recurring subscription.
How to Use the MarTech Dashboard in Excel
- Download and unzip the workbook.
- Open the file in Microsoft Excel 2016 or later.
- Replace the sample records in the Data Sheet with your campaign data.
- Keep the same column headers and structure.
- Click Data > Refresh All in the Excel Ribbon.
- Use slicers to filter by channel, region, audience segment, funnel stage, campaign owner, status, and time period.
Real-World Use Cases
Aisha, marketing operations manager, reviews ROAS by region and cost by channel before the weekly budget meeting.
Daniel, agency reporting lead, updates client campaign records monthly and exports the Overview and Spend ROI pages for client review.
Priya, startup founder, checks leads, conversions, ad spend, and net profit before deciding which channel gets next month’s budget.
Frequently Asked Questions
What does this dashboard track?
It tracks ad spend, marketing cost, leads, conversions, revenue, net profit, ROAS, CTR, campaign status, channel, region, device, audience segment, owner, funnel stage, month, quarter, and year.
Do I need macros?
No. The dashboard uses native Excel tables, pivot tables, charts, and slicers.
How do I refresh the dashboard?
Update the Data Sheet, then click Data > Refresh All. The Support Sheet pivots and dashboard visuals refresh together.
Can I customize the workbook?
Yes. You can edit sheets, formulas, charts, and colors. Keep a backup before changing pivot source fields or chart structures.
Is this suitable for agencies?
Yes. Agencies can duplicate the workbook for each client and use the same reporting structure across accounts.
Does it connect directly to Google Ads or Meta Ads?
No direct connector is included. Export or prepare your data, paste it into the Data Sheet, and refresh the dashboard.
About the Author
Built by PK – Microsoft Certified Professional with 15+ years of Excel, Google Sheets, and Power BI experience. Founder of NextGenTemplates, reaching 300K+ subscribers across YouTube channels. Every template is hand-built and tested before release.
Explore Related Templates
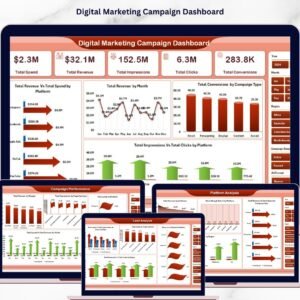
- Digital Marketing Campaign Dashboard in Excel
- Influencer Campaign Dashboard in Excel
- Social Media Performance Dashboard in Excel
- Browse Excel Dashboard templates
- Browse Sales and Marketing Excel templates
Ready to turn marketing data into clear Excel reporting? Download the MarTech Dashboard in Excel and start tracking spend, leads, conversions, profit, and ROAS today.
Last updated: July 2026































Reviews
There are no reviews yet.