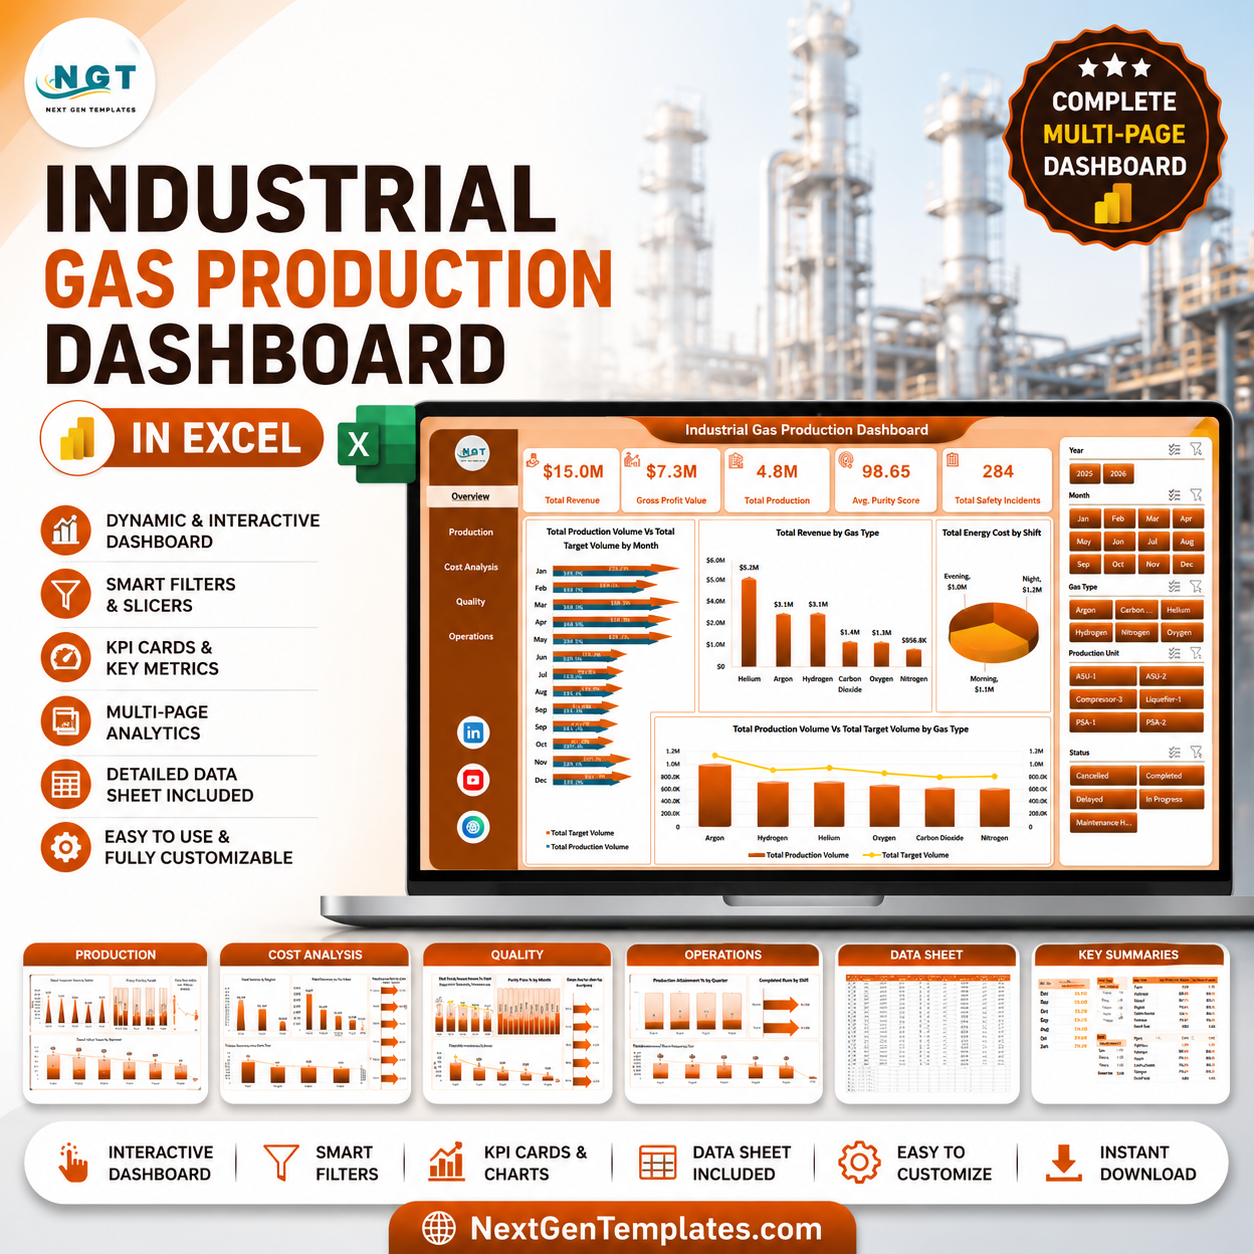

Industrial Gas Production Dashboard in Excel gives plant, production, quality, safety, and finance teams a 7-sheet reporting workbook with 5 KPI cards, 19 production and cost visuals, slicer-based filtering, a structured Data Sheet, and a pivot-backed Support Sheet. Industrial gas production teams often manage output, purity, energy cost, safety incidents, shifts, plants, regions, operators, and gas types in separate logs. This Excel dashboard turns those records into one refreshable workbook for a one-time $17.99 purchase. Built by PK, a Microsoft Certified Professional with 15+ years of Excel experience and 300K+ subscribers across YouTube channels.
Key Features of Industrial Gas Production Dashboard in Excel
- 7 worksheet tabs: Overview, Production, Cost Analysis, Quality, Operations, Data Sheet, and Support Sheet.
- 5 executive KPI cards: Total Revenue, Gross Profit Value, Total Production, Avg. Purity Score, and Total Safety Incidents.
- 19 dashboard visuals: Analyze production volume, target volume, revenue, energy cost, gross profit, purity pass rate, safety incidents, attainment, downtime, shifts, plants, gas types, operators, and regions.
- Multiple slicers: Filter dashboard views quickly during daily, weekly, or monthly production meetings.
- Pivot-driven workbook: Add data in the Data Sheet, click Refresh All, and the pivot tables and charts refresh together.
- Editable Excel design: Change chart titles, fields, colors, slicers, data columns, and page layout to match your industrial gas reporting process.
- No subscription: Download once, use forever, and avoid per-user reporting software fees.
What’s Inside the Industrial Gas Production Dashboard in Excel
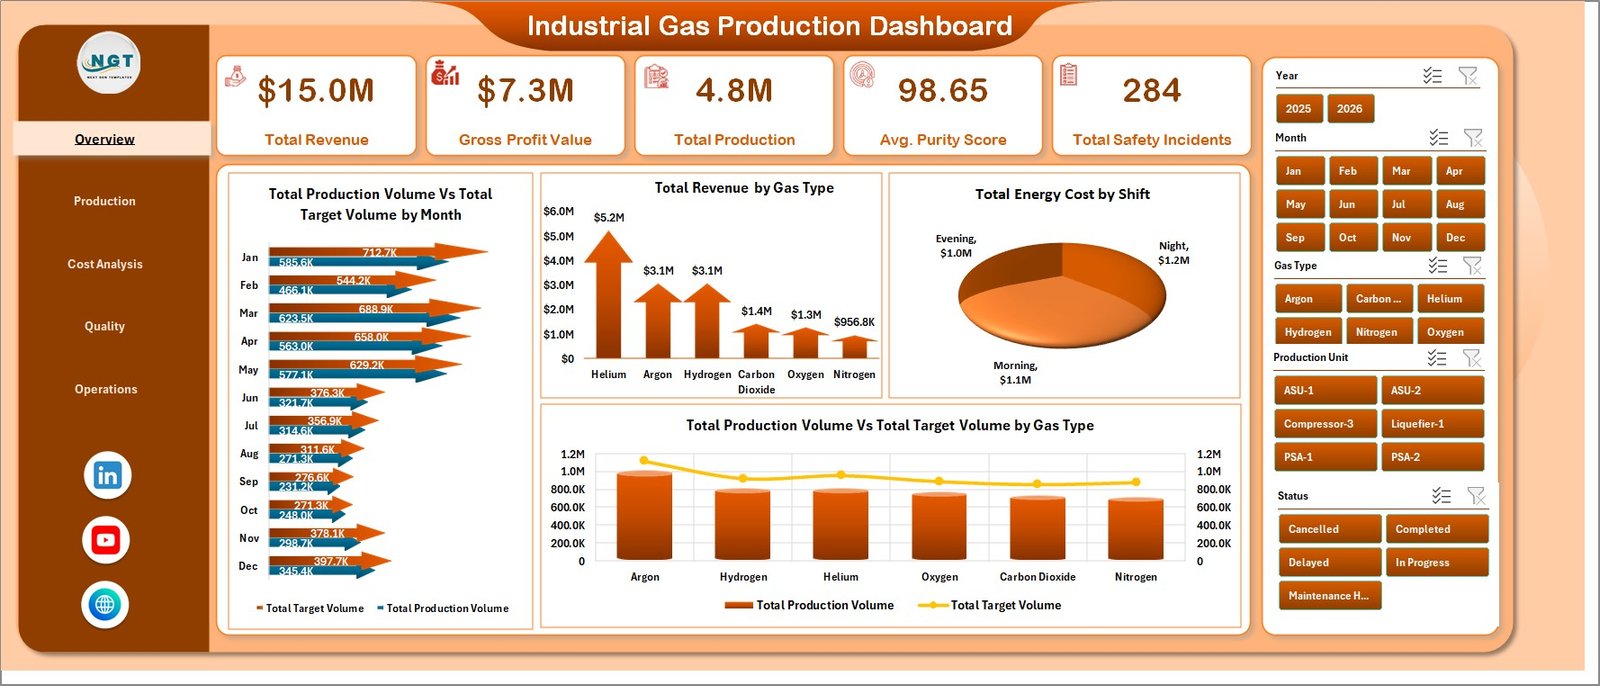
1. Overview Page
The Overview page gives management a high-level view of plant and production performance. Cards show Total Revenue, Gross Profit Value, Total Production, Avg. Purity Score, and Total Safety Incidents, so users can review financial, production, quality, and safety status in one place.
Total Production Volume Vs Total Target Volume by Month compares actual monthly output against planned target volume. It helps managers see whether production is ahead, on track, or under plan over time.
Total Revenue by Gas Type shows which gas categories generate the most revenue. This supports commercial review and product mix planning.
Total Energy Cost by Shift compares energy cost across shifts. It helps production leaders investigate high-cost shifts and improve cost discipline.
Total Production Volume Vs Total Target Volume by Gas Type compares actual and target production by gas type. It is useful for spotting underperforming gas lines or demand-driven production gaps.
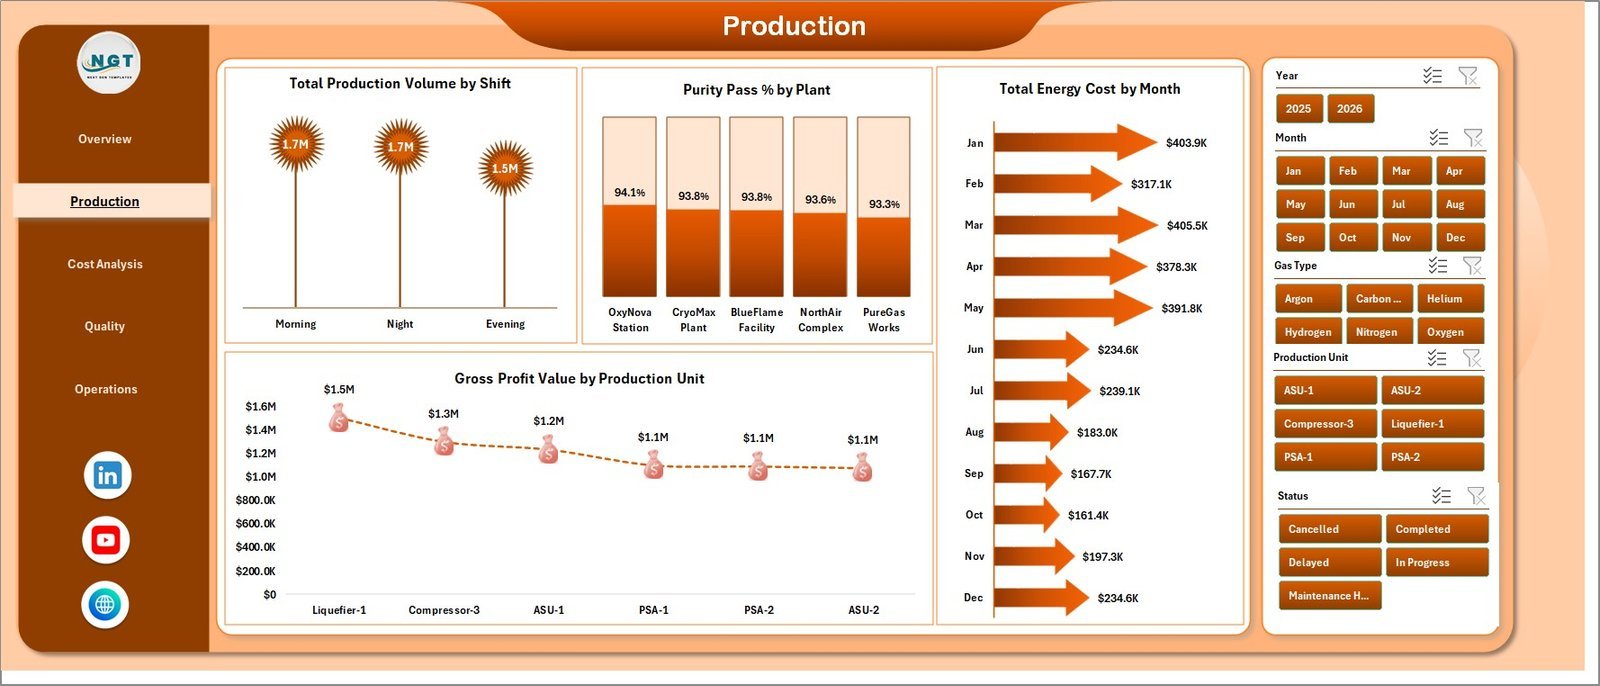
2. Production
The Production sheet focuses on operating output and plant-level production performance. Total Production Volume by Shift shows how much volume is produced across each shift. Purity Pass % by Plant compares quality pass performance across plants. Total Energy Cost by Month tracks monthly energy cost movement, while Gross Profit Value by Production Unit highlights which units contribute the most margin.

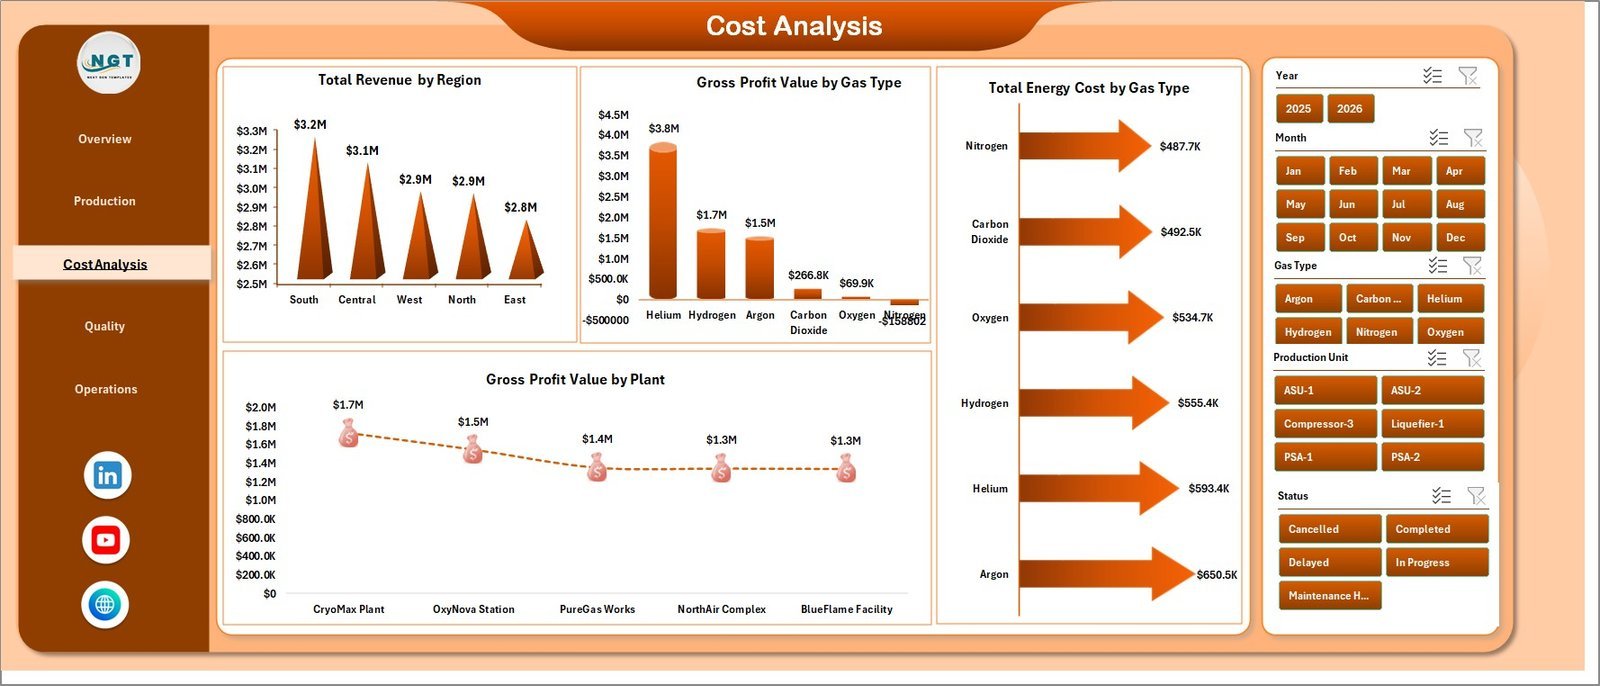
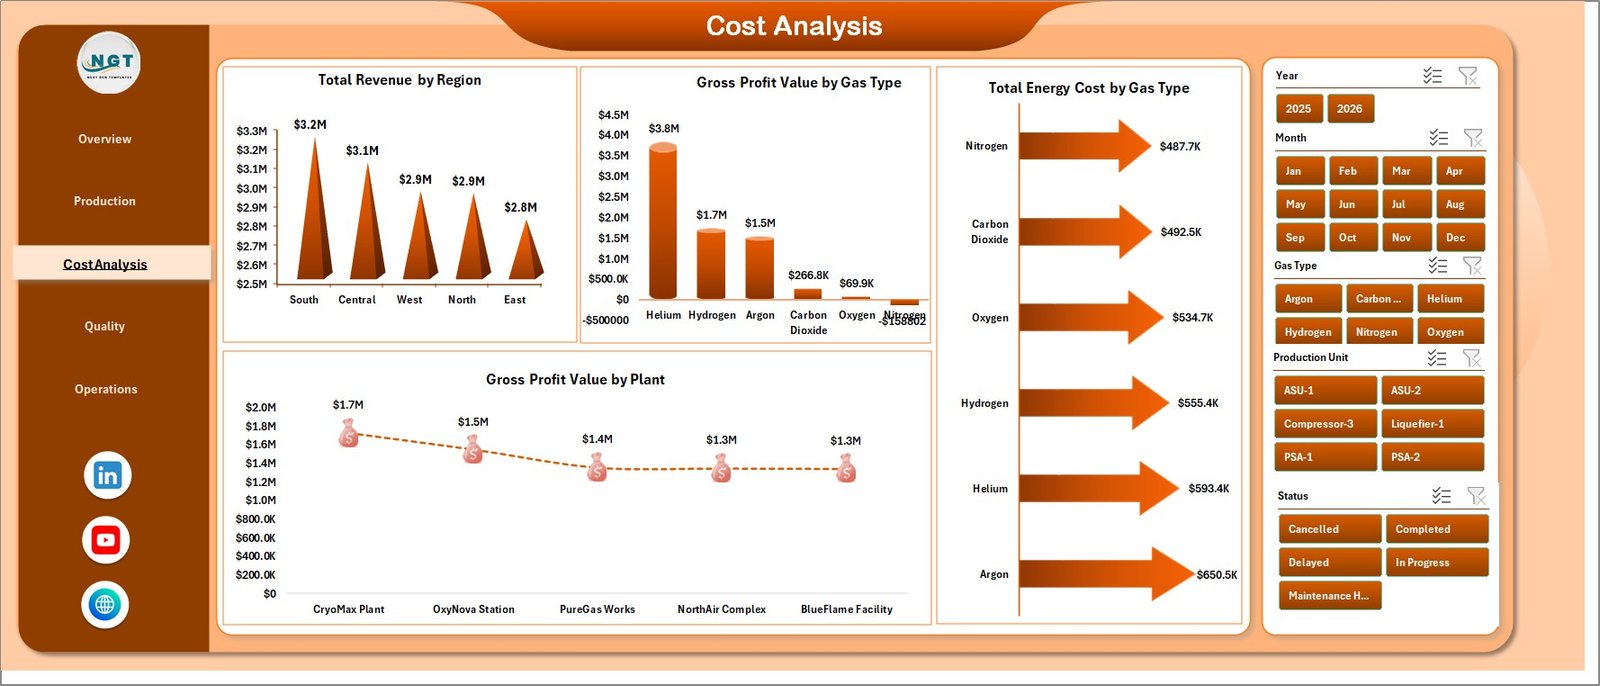
3. Cost Analysis
The Cost Analysis page supports commercial and finance review. Total Revenue by Region compares regional contribution. Gross Profit Value by Gas Type identifies profitable gas categories. Total Energy Cost by Gas Type shows which gases carry the highest energy cost, and Gross Profit Value by Plant compares plant-level margin.
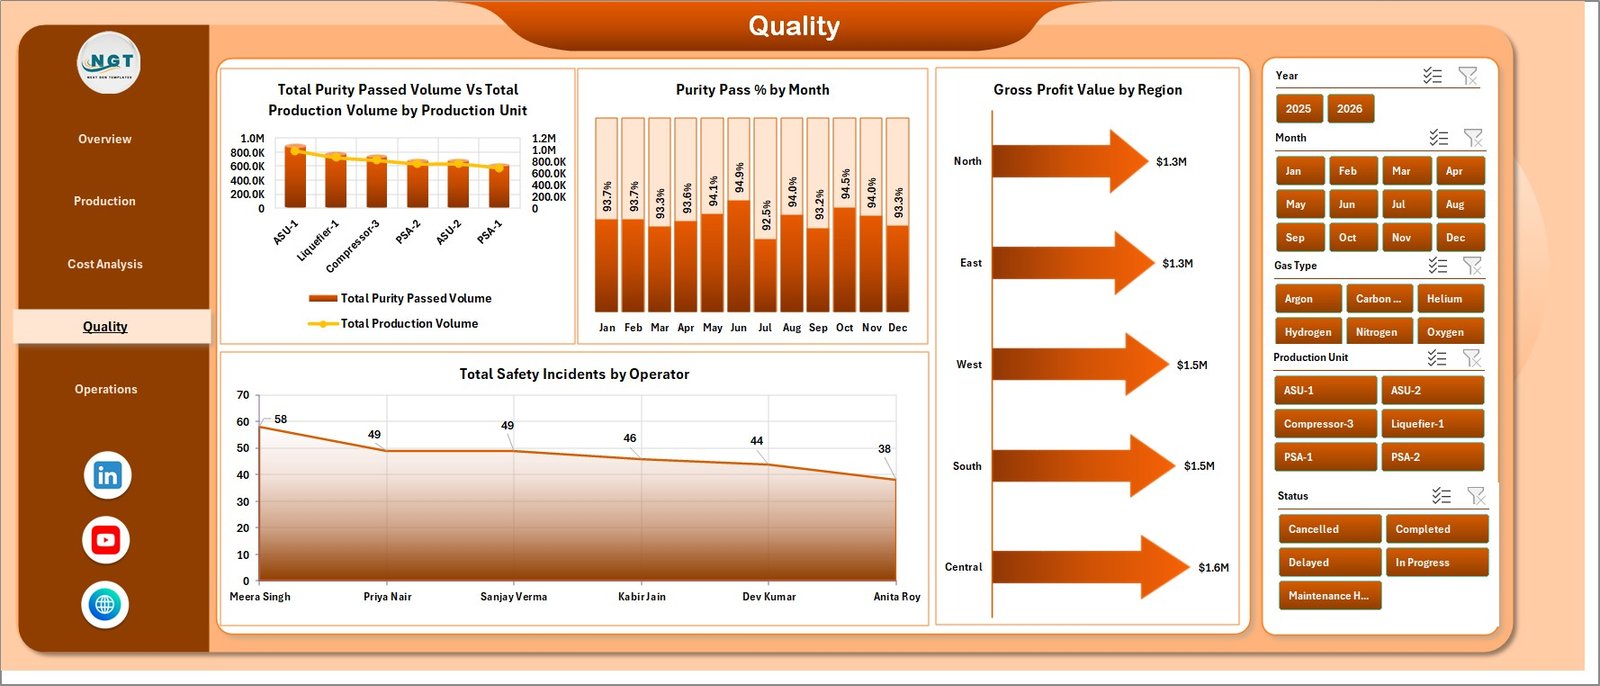
4. Quality
The Quality page connects production volume, purity pass performance, margin, and safety incidents. Total Purity Passed Volume Vs Total Production Volume by Production Unit compares quality-approved volume against total output. Purity Pass % by Month shows quality trend movement. Gross Profit Value by Region links regional performance to margin, and Total Safety Incidents by Operator helps safety teams review operator-level incident concentration.
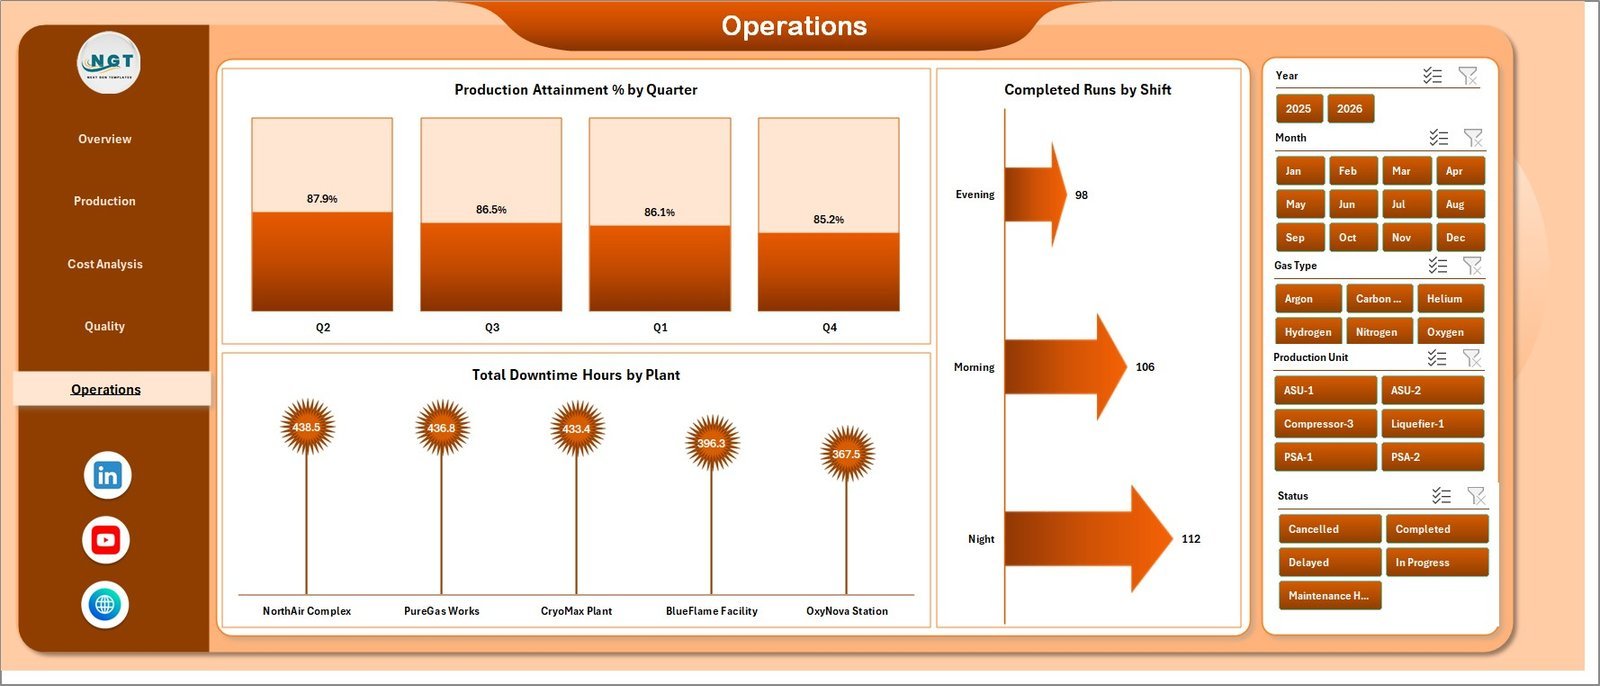
5. Operations
The Operations page is built for execution review. Production Attainment % by Quarter tracks quarterly target achievement. Completed Runs by Shift compares finished production runs across shifts. Total Downtime Hours by Plant highlights plants where downtime needs attention.

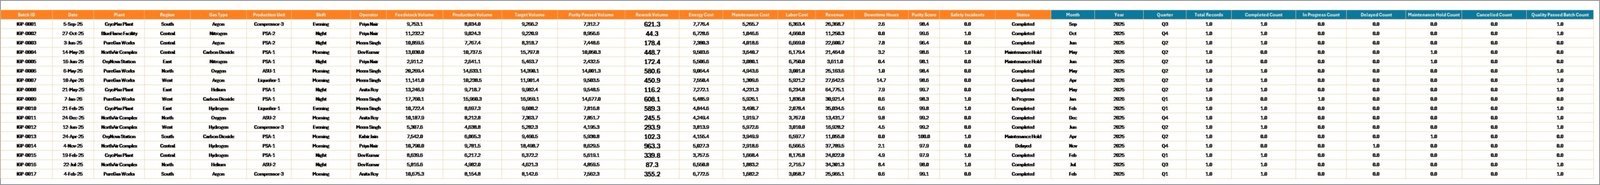
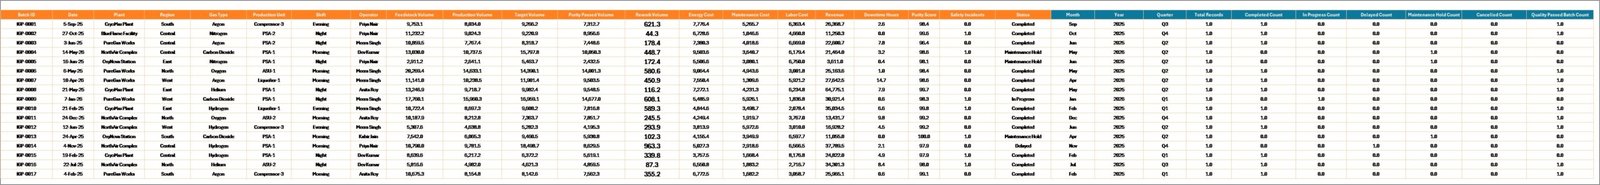
6. Data Sheet Tab
The Data Sheet is where users add industrial gas production records in the same format. Keep the same column structure so cards, slicers, pivot tables, and charts continue working correctly.
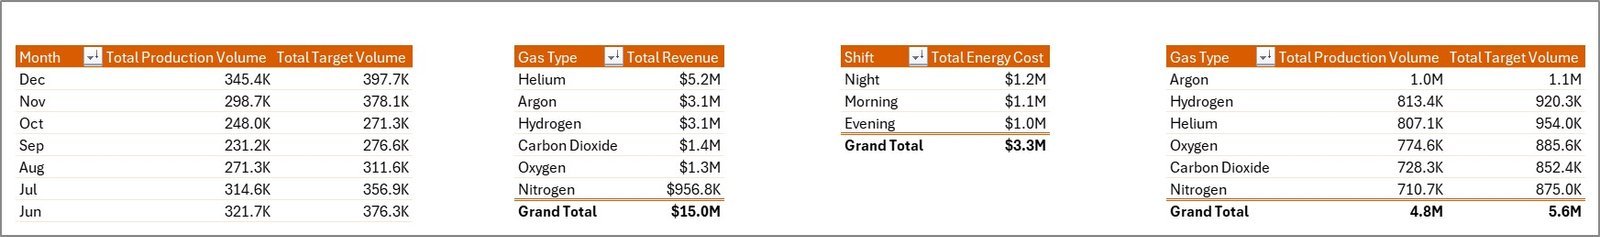
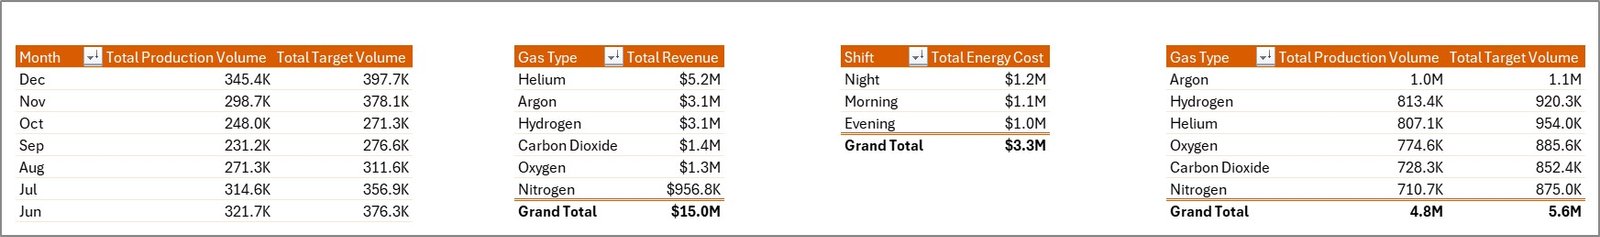
7. Support Sheet
The Support Sheet contains multiple pivot tables used to create the dashboard dynamically. After updating the Data Sheet, go to the Data tab in the Excel Ribbon and click Refresh All. All pivot tables and charts refresh together. You can keep this sheet hidden for end users.
Industrial Gas Production Dashboard in Excel vs. Google Sheets vs. Paid CRM/SaaS – Where This Fits
| Feature | This Excel Dashboard | Google Sheets Alternative | Paid Operations SaaS |
|---|---|---|---|
| Cost | $17.99 one-time | Low cost, online-first | Monthly or annual subscription |
| Platform | Microsoft Excel | Browser-based Sheets | Vendor cloud system |
| Setup time | Open workbook, replace data, refresh | Copy sheet and adapt formulas | Implementation and configuration |
| Offline use | Yes | Limited | No |
| Customizable fields | Fully editable Excel workbook | Editable sheet | Depends on plan and permissions |
| Share with link | Possible through OneDrive or SharePoint | Native sharing | Usually login controlled |
| Year-1 cost at 5 users | $17.99 plus existing Excel licenses | Low to moderate | Often hundreds or thousands |
| Industrial gas metrics | Production, targets, purity, energy, profit, safety, shifts, plants, and downtime | Must be configured | Depends on vendor module |
Who This Template Is For – and Who It’s Not For
This template is for industrial gas producers, air separation plants, specialty gas manufacturers, plant managers, quality teams, production supervisors, safety managers, finance analysts, and operations consultants who need a practical Excel reporting layer for production, cost, safety, quality, and margin.
It is not a replacement for SCADA, ERP, MES, tank telemetry, live machine monitoring, production scheduling, or regulatory compliance systems. Use it when you already have prepared data and need a clean management dashboard in Excel.
How to Use the Industrial Gas Production Dashboard in Excel
- Download and unzip the product file.
- Open the workbook in Microsoft Excel.
- Go to the Data Sheet and replace the sample rows with your own industrial gas production records.
- Keep the same column structure for best results.
- Go to the Excel Ribbon, open the Data tab, and click Refresh All.
- Use slicers on the dashboard pages to filter by period, plant, shift, gas type, operator, production unit, region, or available fields.
- Hide the Support Sheet before sharing the workbook with end users.
Real-World Use Cases
Amit, Plant Manager: reviews production volume vs. target volume by month and gas type before the weekly operations meeting.
Priya, Quality Lead: tracks Avg. Purity Score, Purity Pass % by Plant, and purity passed volume vs. total production volume to prioritize process checks.
Daniel, Finance Analyst: compares gross profit by plant, gas type, region, and production unit to support monthly margin commentary.
Frequently Asked Questions
What KPIs are included?
The dashboard includes Total Revenue, Gross Profit Value, Total Production, Avg. Purity Score, and Total Safety Incidents.
Does this workbook use macros?
No. It is built with Excel sheets, pivot tables, charts, and slicers. You update the Data Sheet and refresh the workbook.
Can I add my own plants, gas types, and shifts?
Yes. Add your own values in the Data Sheet while keeping the same structure, then refresh the pivot tables and charts.
Can I hide the Support Sheet?
Yes. The Support Sheet holds pivot tables and can be hidden after setup.
Which Excel version should I use?
Use Microsoft Excel 2016 or later, including Microsoft 365, for the best slicer and pivot chart experience.
Is this a one-time purchase?
Yes. The dashboard is a downloadable Excel template with no monthly subscription or per-user fee.
About the Author
Built by PK – Microsoft Certified Professional with 15+ years of Excel, Google Sheets, and Power BI experience. Founder of NextGenTemplates, reaching 300K+ subscribers across YouTube channels. Every template is hand-built and tested before release.
Explore Related Templates
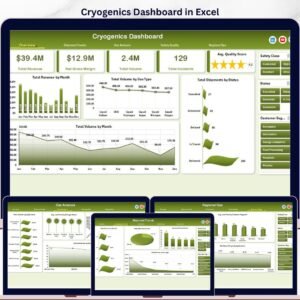
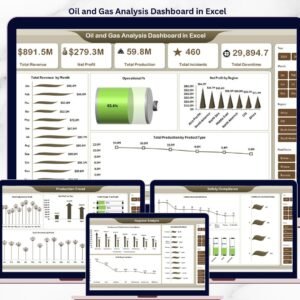
Pair this workbook with Cryogenics Dashboard in Excel, Oil and Gas Analysis Dashboard in Excel, and Footwear Manufacturing Dashboard in Excel. Browse more Excel Dashboard templates and Manufacturing Excel templates.
Download the Industrial Gas Production Dashboard in Excel to monitor production volume, targets, purity, revenue, gross profit, energy cost, downtime, and safety incidents from one refreshable workbook.
Last updated: June 24, 2026.


Reviews
There are no reviews yet.