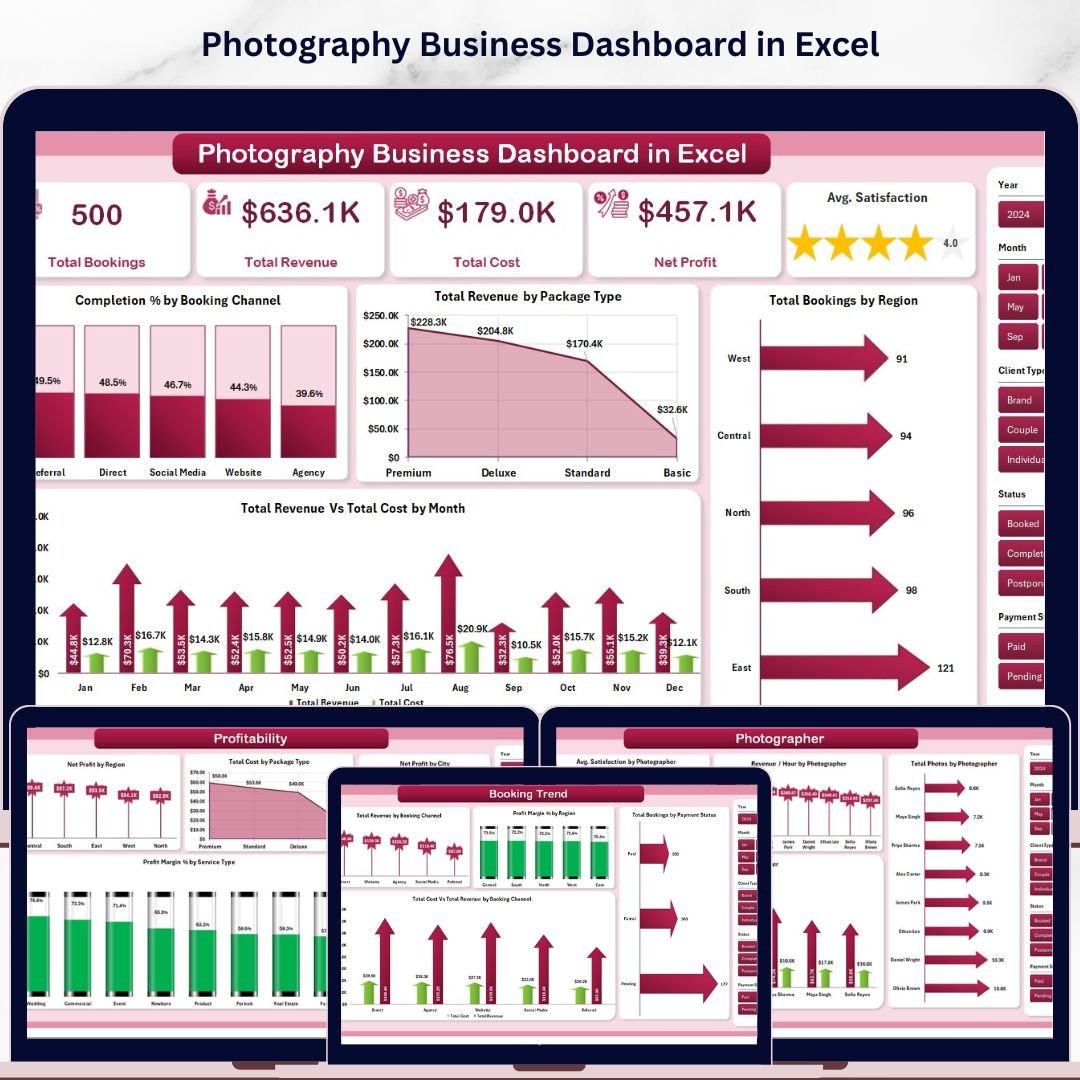

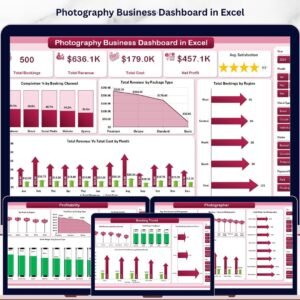
The Photography Business Dashboard in Excel tracks 5 KPI cards and 16 charts across 5 interactive pages — covering booking trends, photographer performance, service insights, and profitability analysis by region and city. Setup takes under 10 minutes: add your booking data and every chart updates automatically via pivot tables and slicers.
🌍 Join 8,400+ teams in 40+ countries using Nextgen Templates to replace paid SaaS tools with one-time-purchase Excel, Google Sheets, Power BI, and HTML templates.
✅ Instant download · One-time payment · No subscription · No per-user fees · Lifetime access
🔑 Key Features of Photography Business Dashboard in Excel
📸 5 Pre-Built KPI Cards — The dashboard displays Total Bookings, Total Revenue, Total Cost, Net Profit, and Average Satisfaction score on the Overview page, giving studio owners an instant snapshot of business health without manual calculation.
📊 16 Interactive Charts Across 5 Pages — Every dashboard page contains 4 charts each, covering booking channels, regional performance, service types, photographer-level metrics, and profitability breakdowns. All charts link to pivot tables and refresh with one click.
🔍 Dynamic Slicers for Instant Filtering — Apply filters by booking channel, region, package type, service type, or payment status and every chart on that page updates simultaneously in seconds.
👤 Photographer Performance Tracking — Measure Revenue per Hour, Total Photos delivered, and Satisfaction score per photographer — the data you need to identify top performers and optimize team scheduling.
💰 Multi-Dimensional Profitability — Break down Net Profit by Region, City, Package Type, and Service Type to identify your highest-margin bookings and deprioritize unprofitable service lines.
🔄 One-Click Refresh — Update the Data sheet, then go to Data → Refresh All in the Excel ribbon. Every pivot table and chart refreshes instantly — no manual formula editing needed.
📦 What’s Inside the Photography Business Dashboard in Excel
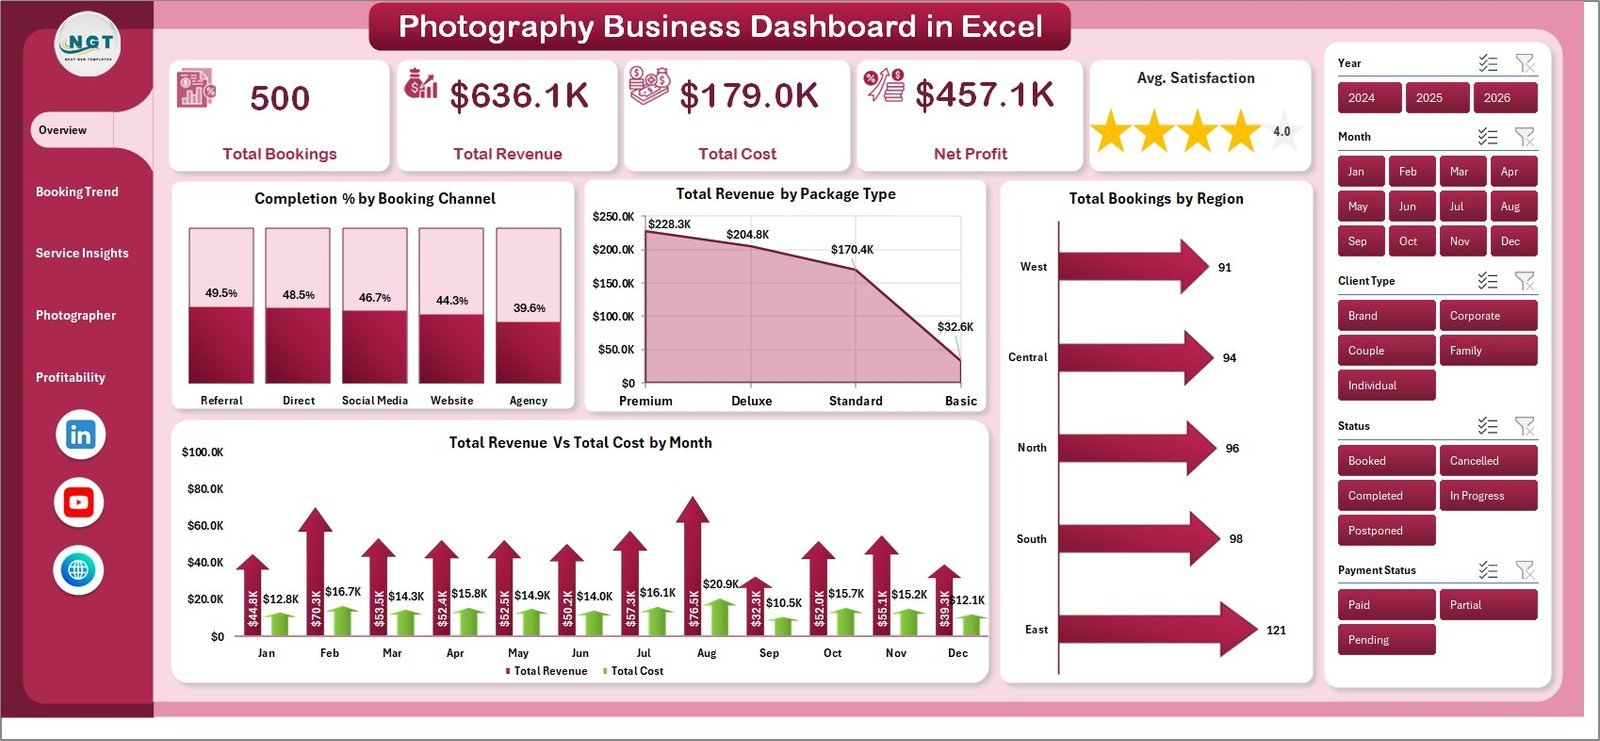
1. Overview Page
The Overview page displays 5 KPI cards (Total Bookings, Total Revenue, Total Cost, Net Profit, Avg. Satisfaction) plus 4 charts: Completion % by Booking Channel, Total Revenue by Package Type, Total Bookings by Region, and Total Revenue vs Total Cost by Month.
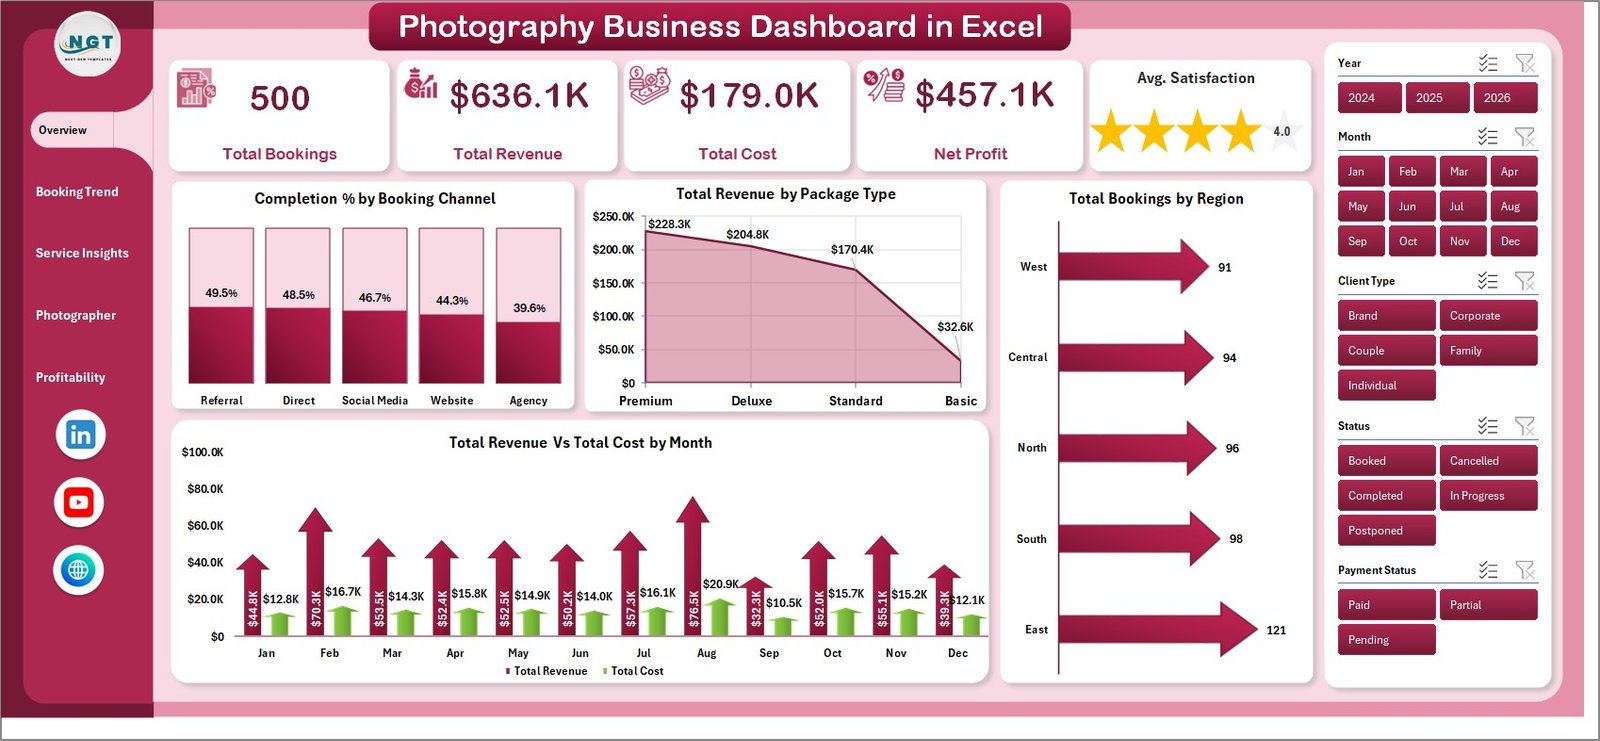
Overview Page
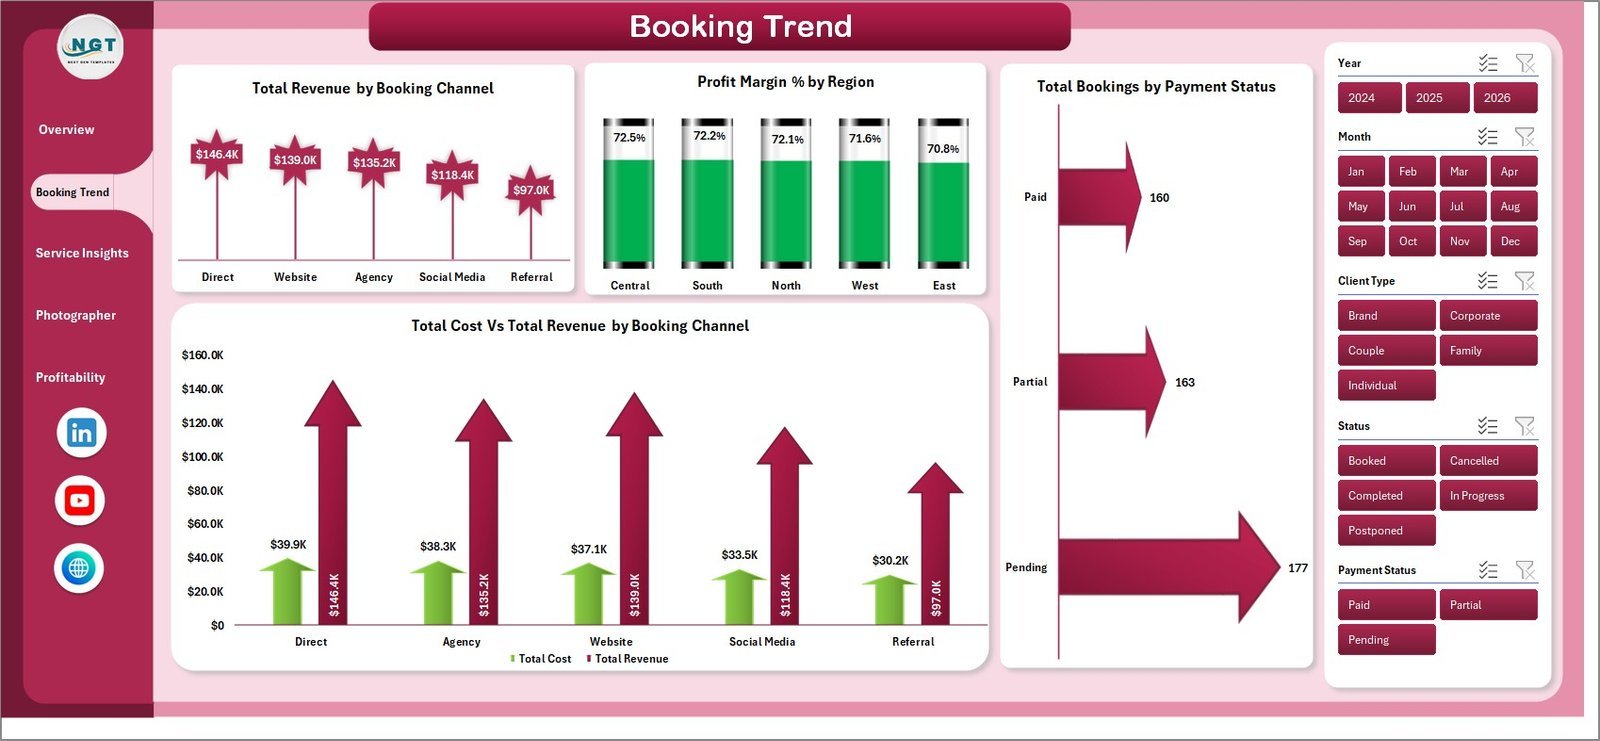
2. Booking Trend Page
Four charts analyze booking-level financials: Total Revenue by Booking Channel, Profit Margin % by Region, Total Bookings by Payment Status, and Total Cost vs Total Revenue by Booking Channel.
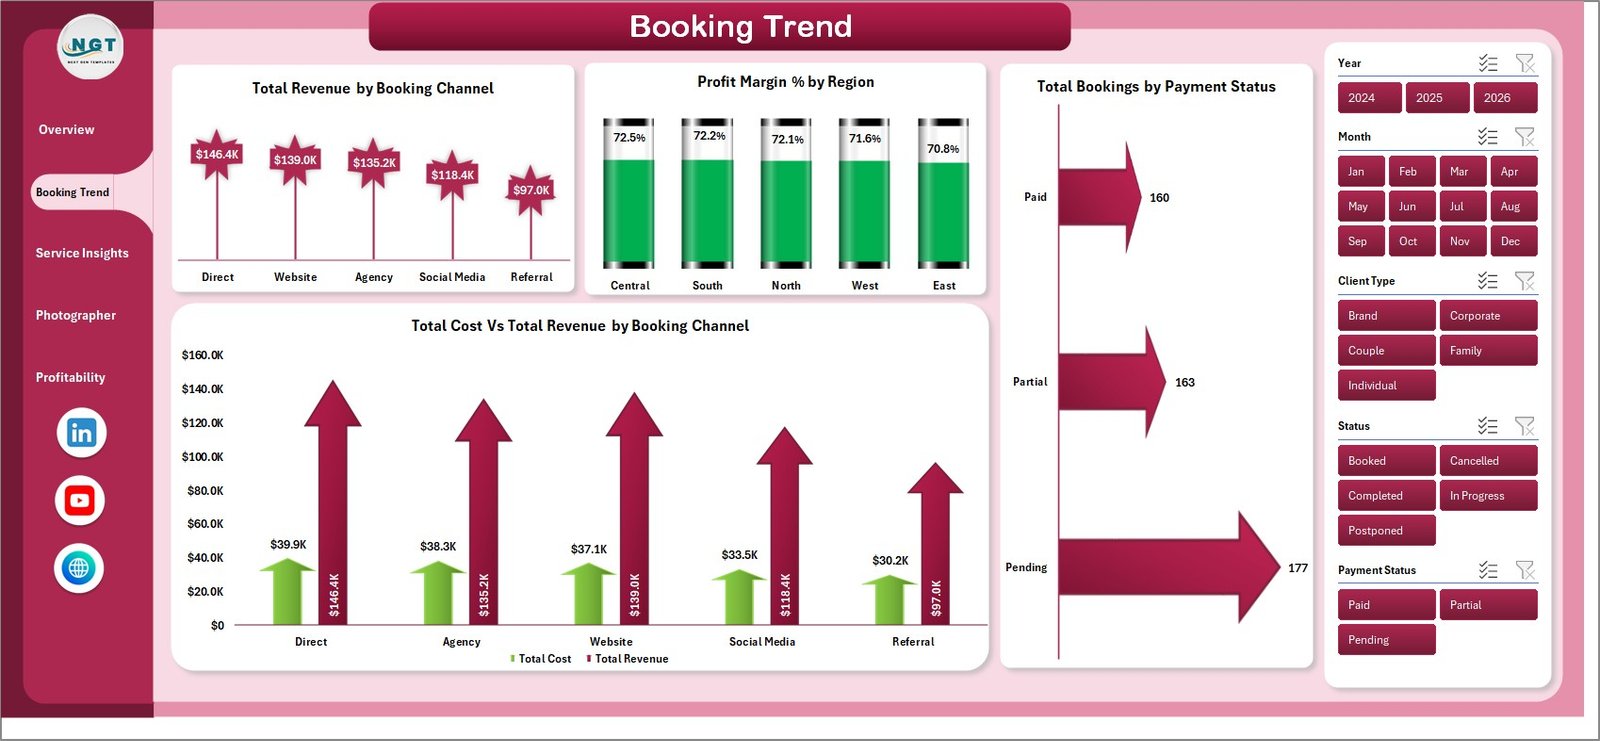
Booking Trend Page
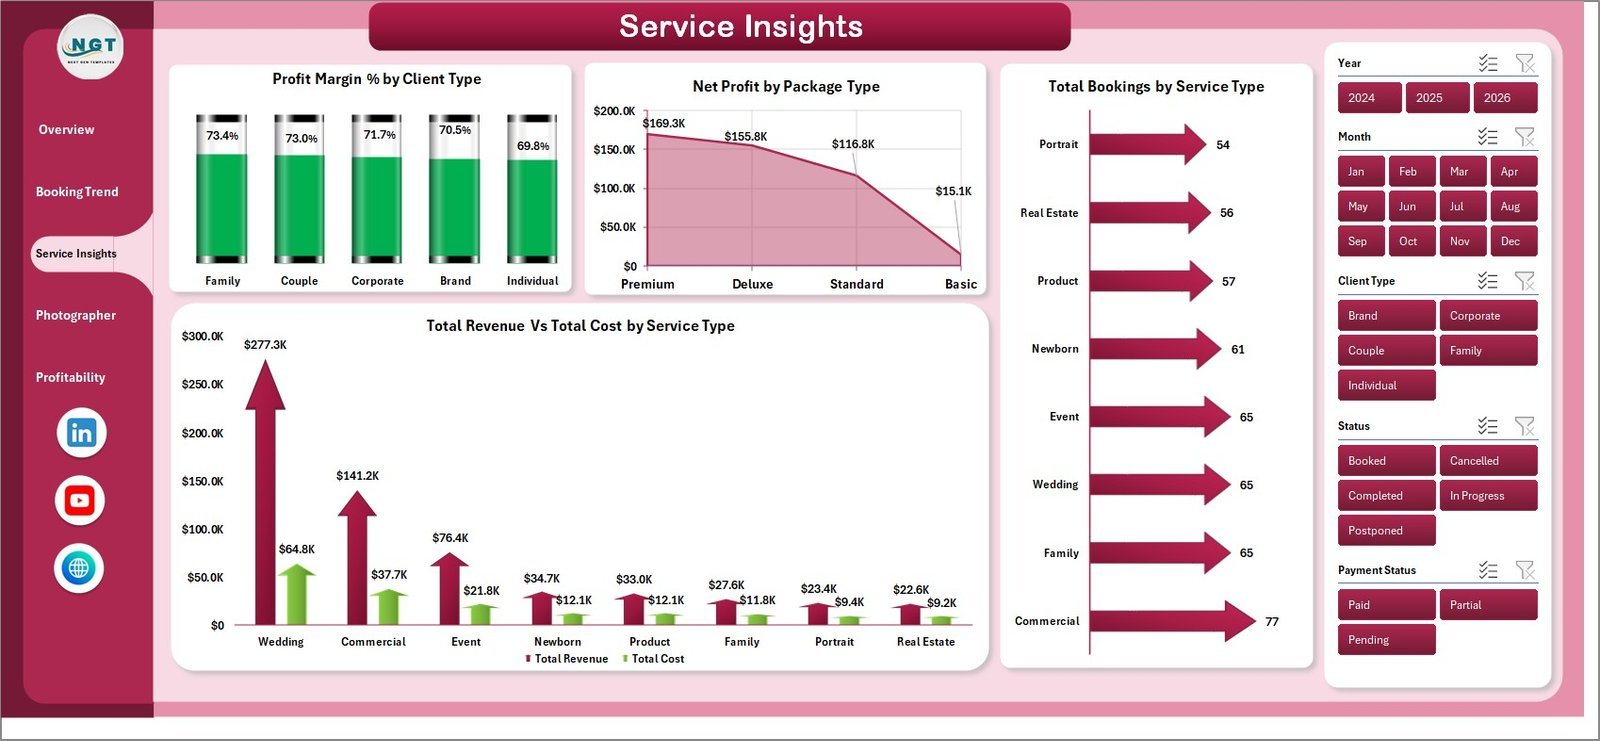
3. Service Insights Page
Analyzes performance by service type: Profit Margin % by Client Type, Net Profit by Package Type, Total Bookings by Service Type, and Total Revenue vs Total Cost by Service Type.

Service Insights Page
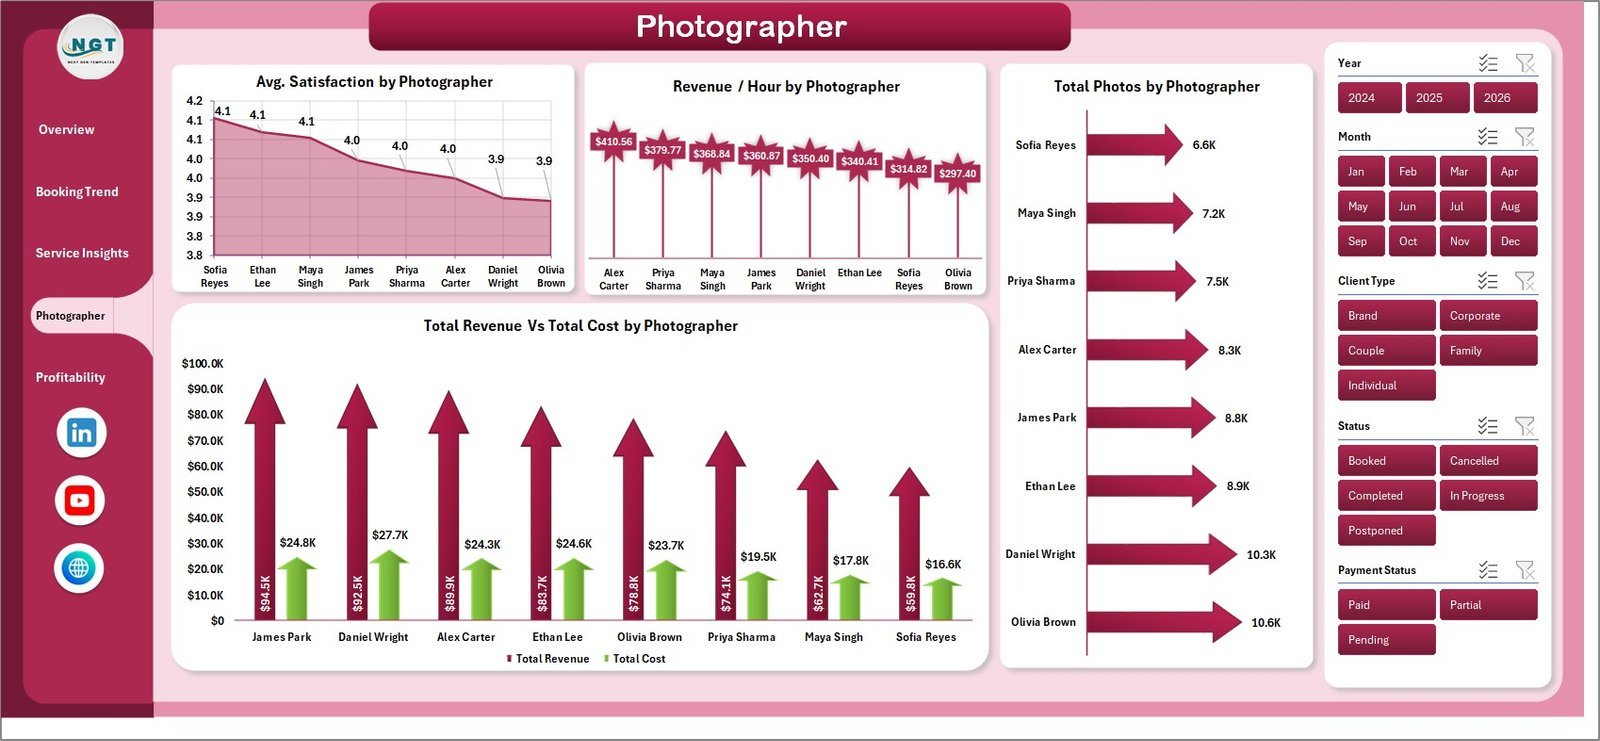
4. Photographer Page
Tracks individual photographer metrics: Avg. Satisfaction by Photographer, Revenue per Hour by Photographer, Total Photos by Photographer, and Total Revenue vs Total Cost by Photographer.

Photographer Performance Page
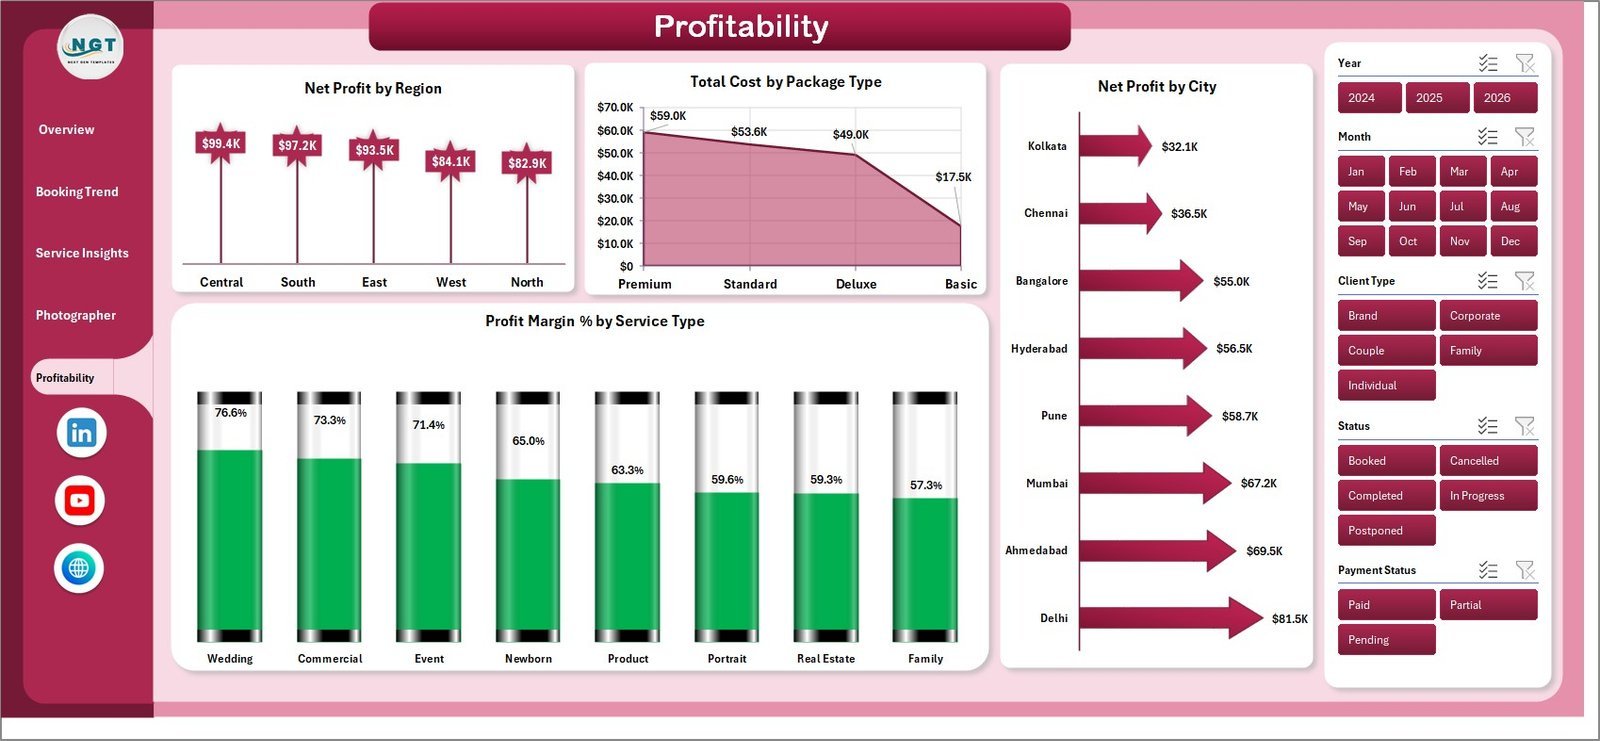
5. Profitability Page
Deep-dives into margins: Net Profit by Region, Total Cost by Package Type, Net Profit by City, and Profit Margin % by Service Type.

Profitability Analysis Page
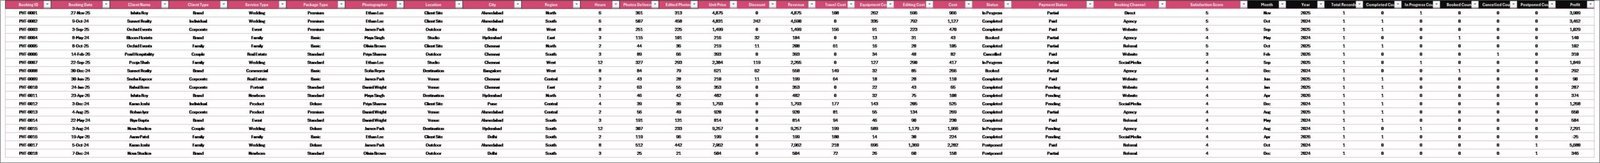
6. Data Sheet
Enter your booking records here in the structured format provided. The entire dashboard reads from this sheet via pivot tables — just fill in the columns and refresh.
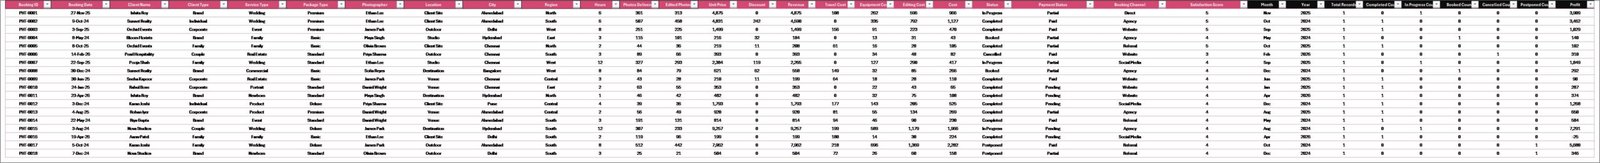
Data Sheet Tab
7. Support Sheet
Contains all pivot tables that power the dashboard dynamically. Keep this sheet hidden during normal use. Click Data → Refresh All after updating the data sheet to refresh every chart and KPI card.
Support Sheet Tab
📊 Photography Business Dashboard in Excel vs. Google Sheets vs. Studio Ninja — Where This Fits
| Feature | Photography Business Dashboard in Excel | Google Sheets Equivalent | Studio Ninja / HoneyBook |
|---|---|---|---|
| Cost | $17.99 one-time | Free (manual build) | $35–75 / month |
| Platform | Microsoft Excel (offline + online) | Google Sheets (online) | SaaS (online only) |
| Setup Time | Under 10 minutes | Hours of formula work | 1–3 hours onboarding |
| Photographer Analytics | ✅ Revenue/hour, satisfaction | ❌ Manual | ⚠️ Basic |
| Profitability by City | ✅ Yes | ❌ Not included | ❌ Not available |
| One-Click Refresh | ✅ Pivot refresh | ❌ Manual | ✅ Auto-sync |
| No Subscription | ✅ One-time | ✅ Free | ❌ Monthly recurring |
| Year-1 Cost (5 users) | $17.99 total | $0 | $420–$900 |
| Offline Access | ✅ Full offline | ❌ Requires internet | ❌ Online only |
For photography businesses that want multi-dimensional booking analytics without monthly SaaS fees, the Photography Business Dashboard in Excel sits in the sweet spot.
👥 Who This Template Is For — and Who It’s Not For
✅ This template is built for:
- Freelance photographers managing 10–200+ bookings per month
- Photography studio owners tracking multiple photographers and service types
- Wedding, portrait, and commercial photographers wanting profitability visibility
- Business-savvy photographers already using Excel for financial tracking
- Studio managers needing booking channel performance analysis
❌ This template is NOT for:
- Photographers needing CRM features like contract management or automated client emails (use HoneyBook instead)
- Teams requiring real-time multi-user cloud collaboration on live booking data
- Beginners with no Excel experience who need a zero-learning-curve tool
⚙️ How to Use the Photography Business Dashboard in Excel
- Download and open the file in Microsoft Excel 2016 or later.
- Go to the Data Sheet and replace the sample data with your booking records in the same column format.
- Click Data → Refresh All in the Excel ribbon to update all pivot tables.
- Use the slicers on each page to filter by booking channel, region, package type, or date range.
- Keep the Support Sheet hidden — it contains the pivot tables and doesn’t need manual editing.
💼 Real-World Use Cases
Marco runs a wedding photography studio with 3 photographers. He uses the Photography Business Dashboard in Excel to track which booking channel (Instagram, referral, website) generates the highest revenue per booking, and which photographer delivers the best profit margin per hour — without paying $55/month for SaaS software.
Priya is a portrait and corporate photographer serving clients across 4 cities. She uses the Profitability page to compare Net Profit by City each quarter, helping her decide where to focus marketing spend and which service types to phase out.
Jake manages operations at a 6-photographer commercial studio. He feeds monthly booking data into the Data sheet and presents the Overview page in weekly team meetings — from data entry to presentation-ready dashboard in under 2 minutes.
❓ Frequently Asked Questions
What KPIs does the Photography Business Dashboard in Excel track?
The Photography Business Dashboard in Excel tracks 5 KPI cards — Total Bookings, Total Revenue, Total Cost, Net Profit, and Average Satisfaction — across 5 dashboard pages with 16 pre-built charts covering booking channels, service types, photographer performance, and regional profitability.
Does this work with Excel on Mac?
Yes. The Photography Business Dashboard in Excel works on Microsoft Excel for Mac (2016 or later) and Excel for Windows. It requires no add-ins or macros — it runs entirely on pivot tables and native Excel charts.
How long does setup take?
Setup takes under 10 minutes. Download the file, open it in Excel, paste your booking records into the Data sheet, and click Data → Refresh All. Every KPI card and chart updates automatically.
How does this compare to Studio Ninja or HoneyBook?
Studio Ninja and HoneyBook are CRM tools for client management. The Photography Business Dashboard in Excel focuses on business analytics — bookings, profitability, and photographer performance. It costs $17.99 once vs $35–75/month for SaaS alternatives.
Can I add more photographers or service types?
Yes. Add new photographers, service types, regions, or booking channels in the Data sheet. Pivot tables include the new values automatically after clicking Refresh All.
Is there a Google Sheets or Power BI version?
This template is available in Excel format. Browse our Excel Dashboard Templates collection or explore our Google Sheets Dashboards for related formats.
What Excel version is required?
Microsoft Excel 2016 or later (Windows or Mac) and Excel 365. The file does not work correctly in Google Sheets or LibreOffice due to pivot table formatting differences.
👤 About the Author
Built by PK — Microsoft Certified Professional with 15+ years of Excel, Google Sheets, and Power BI experience. Founder of Nextgen Templates, reaching 300K+ subscribers across YouTube channels (@PK-AnExcelExpert, @NextGenTemplates, @NeoTechNavigators). Every template is hand-built and tested before release.
🔗 Explore Related Templates
- Graphic Design Report in Excel — Revenue and profitability tracking for graphic design studios
- Print Shop Dashboard in Excel — Operations and revenue analytics for print businesses
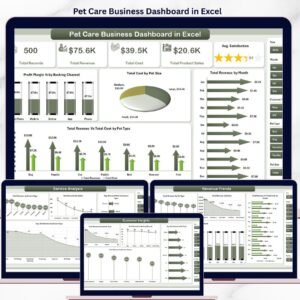
- Pet Care Business Dashboard in Excel — Multi-page Excel dashboard for service-based businesses
📖 Click here to read the Detailed Blog Post
🎥 Visit our YouTube channel for step-by-step video tutorials
👉 YouTube.com/@NextGenTemplates
📅 Last updated: May 2026
Watch the step-by-step video tutorial:
YouTube


Reviews
There are no reviews yet.