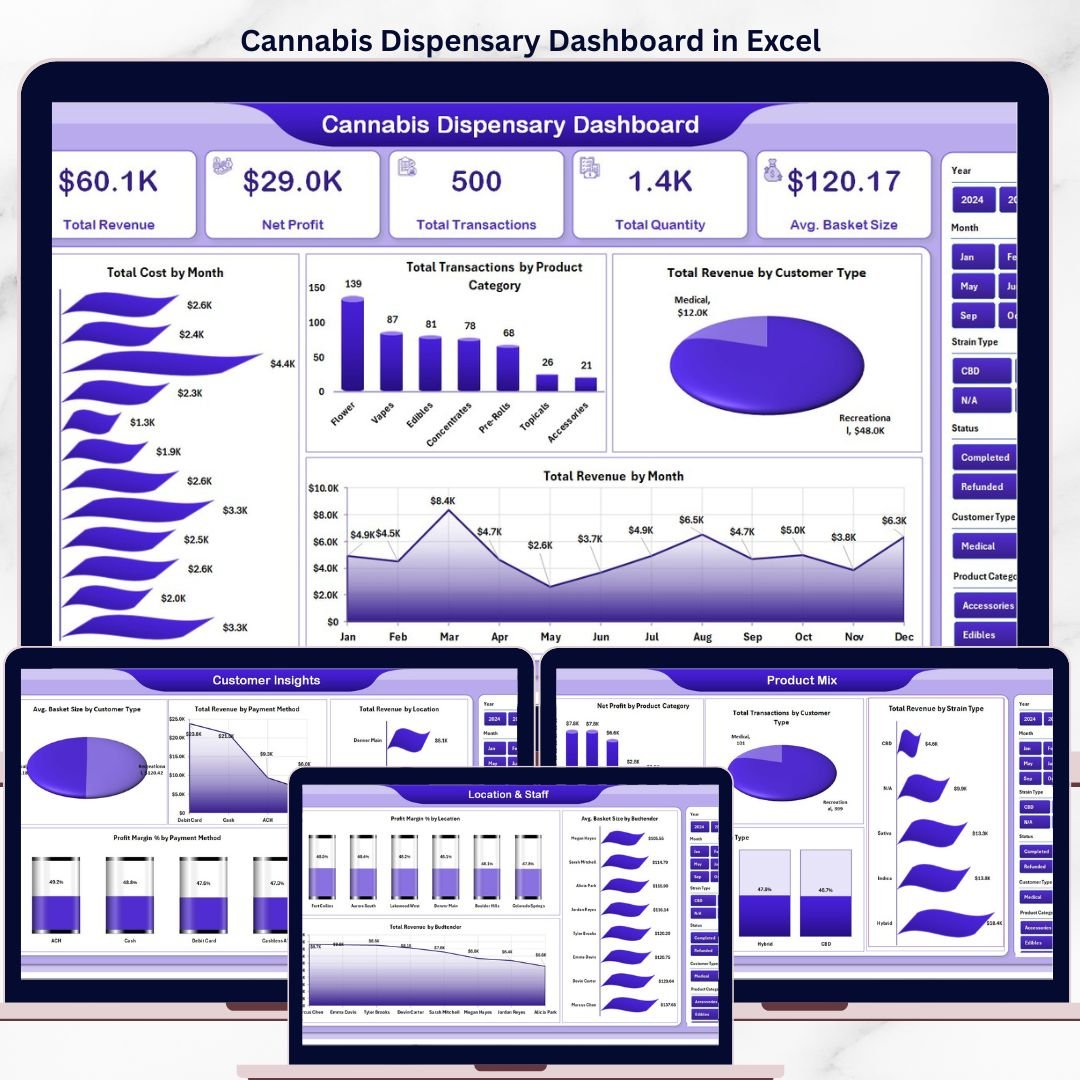

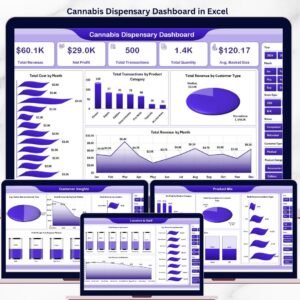
The Cannabis Dispensary Dashboard in Excel tracks 5 headline KPIs — Total Revenue, Net Profit, Total Transactions, Total Quantity, and Avg. Basket Size — across 5 interactive analysis pages, 17+ pivot-driven charts, and multiple slicer filters for product category, customer type, payment method, location, strain type, and budtender. Setup takes under 10 minutes: paste your dispensary transactions into the Data sheet, click Data → Refresh All, and every page updates automatically.
🌍 Join 8,400+ teams in 40+ countries using NextGenTemplates to replace $99–$499 per user per month dispensary management SaaS tools with one-time-purchase Excel, Google Sheets, Power BI, and HTML templates.
✅ Instant download · One-time payment · No subscription · No per-user fees · Lifetime access
Cannabis Dispensary Dashboard
🔑 Key Features of Cannabis Dispensary Dashboard in Excel
🔹 5 interactive analysis pages plus Data and Support sheets — Overview, Sales Trend, Product Mix, Customer Insights, and Location & Staff, backed by a raw Data sheet and a hidden Support sheet containing every pivot table that drives the dashboard.
🔹 Multi-dimensional slicer filtering on every page — Filter instantly by Product Category, Customer Type, Payment Method, Location, Strain Type, Budtender, and Month without writing a single formula or DAX expression.
🔹 Pivot-table driven architecture — All 17+ charts refresh automatically after clicking Data → Refresh All. No manual chart rebuilding, no broken cell references when you add new transactions.
🔹 Built for every dispensary format — Works for a single neighborhood dispensary, a multi-store retail chain, a delivery-only operation, or a vertically-integrated grower-retailer with multi-location and multi-strain tracking.
🔹 5 Overview KPI cards visible at a glance — Total Revenue, Net Profit, Total Transactions, Total Quantity, and Avg. Basket Size refresh with every filter click so owners and store managers see the headline numbers immediately.
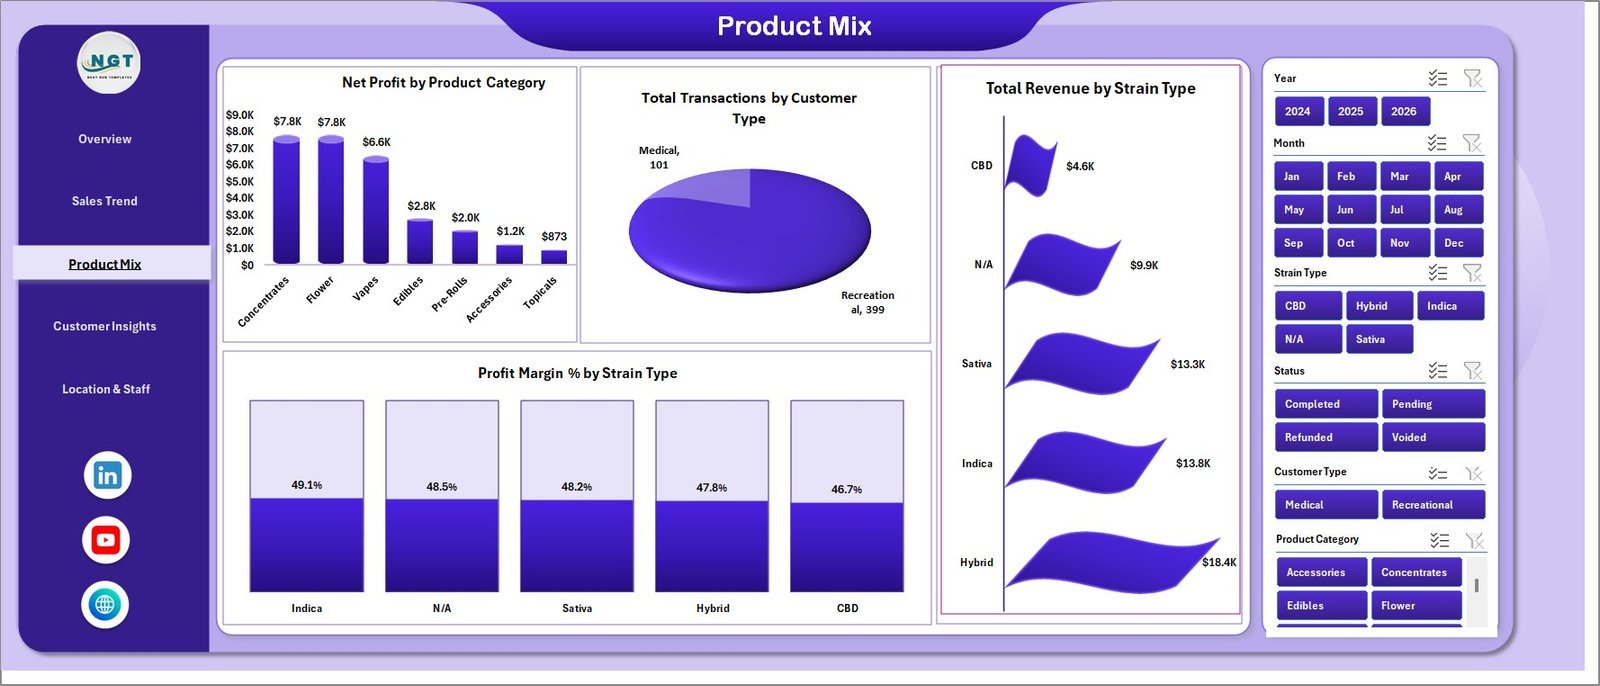
🔹 Strain-level profitability built in — The Product Mix page calculates Total Revenue and Profit Margin % by Strain Type (Indica, Sativa, Hybrid, CBD), so you can spot which strains drive your bottom line and which tie up shelf space.
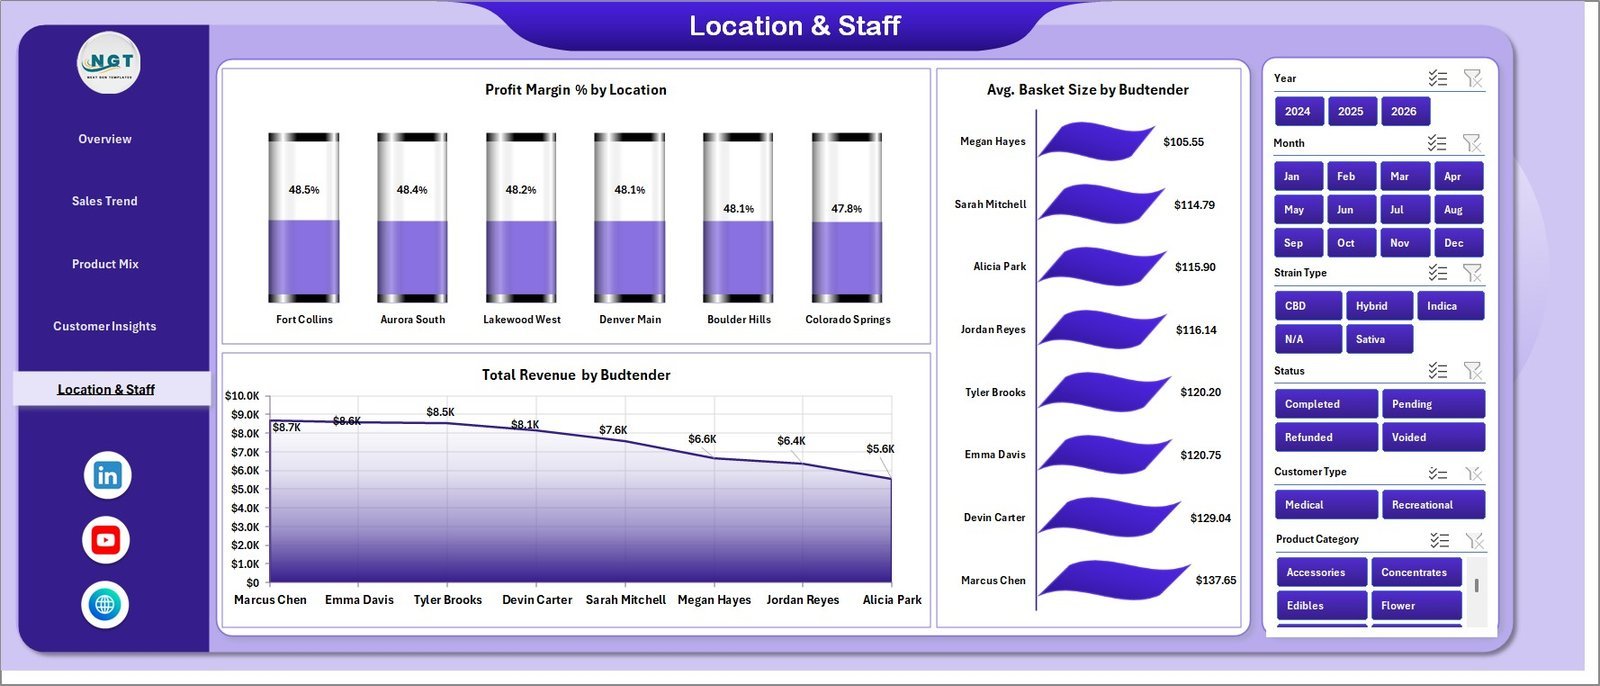
🔹 Budtender performance tracking — The Location & Staff page ranks Total Revenue by Budtender and Avg. Basket Size by Budtender, turning your POS history into a coaching and commission-planning tool.
🔹 Customer-type segmentation — Compare revenue and basket size between Recreational, Medical, and First-Time Customer segments, then plan loyalty offers and patient-card promotions accordingly.
🔹 100% Excel-native — no add-ins required — Works in Microsoft Excel 2016, 2019, 2021, and Microsoft 365. Opens in Excel for Mac and Excel Online (read-only on Online).
🔹 Free lifetime updates — Any structural improvement to the template is shared with all past buyers at no additional cost.
📦 What’s Inside the Cannabis Dispensary Dashboard in Excel
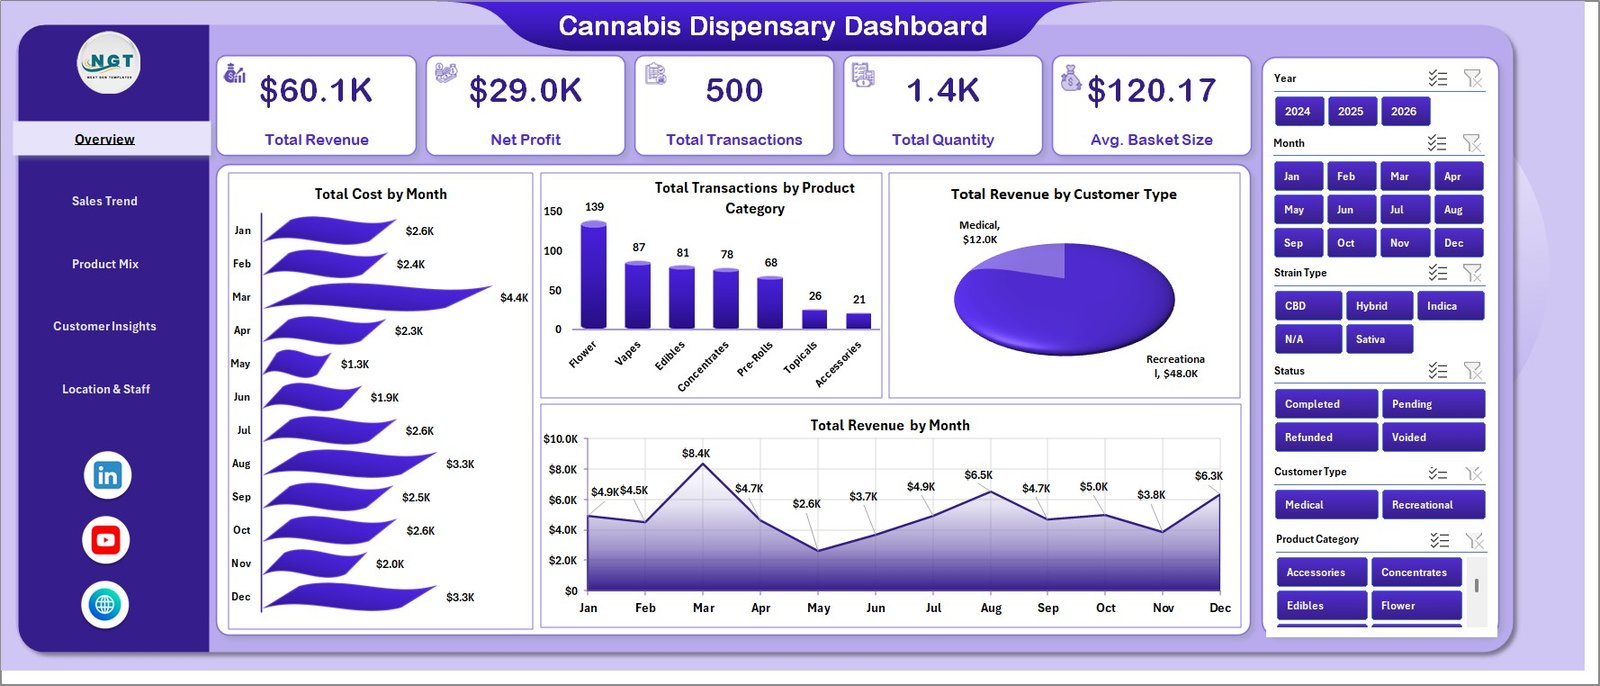
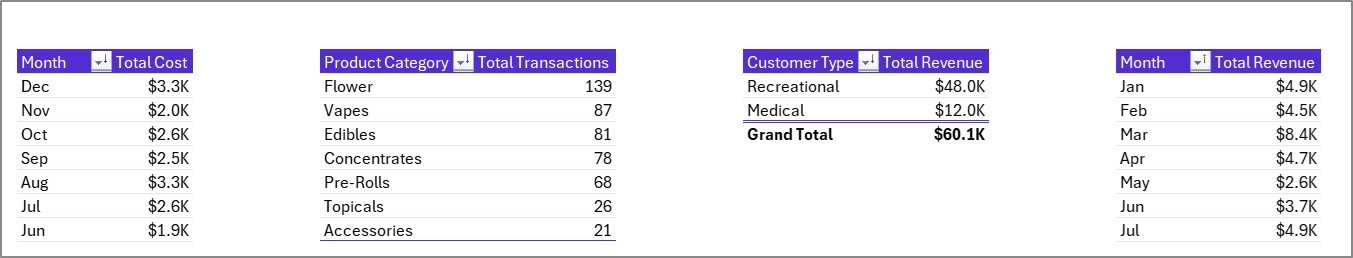
1. Overview Page
The landing page opens with 5 KPI cards — Total Revenue, Net Profit, Total Transactions, Total Quantity, and Avg. Basket Size — followed by slicers that filter every chart on the page.
- Total Cost by Month: Tracks total cost of goods month over month so you can see how COGS moves with seasonality and supplier shifts.
- Total Transactions by Product Category: Compares transaction volume across Flower, Edibles, Concentrates, Pre-Rolls, Vapes, and Accessories to surface your highest-velocity categories.
- Total Revenue by Customer Type: Splits revenue between Recreational, Medical, and First-Time Customers — the single most useful view for promotion planning.
- Total Revenue by Month: Plots the monthly revenue trend across the year, exposing seasonal patterns like 4/20 spikes, summer slowdowns, or end-of-month medical-card refills.
Cannabis Dispensary Dashboard
2. Sales Trend Page
This page drills one level deeper into revenue patterns, looking at how sales evolve by quarter, month, and product category.
- Total Revenue by Quarter: Aggregates revenue into Q1–Q4 buckets so you can compare year-on-year performance and forecast next year’s quarterly targets.
- Total Transactions by Month: Tracks monthly transaction count to reveal traffic patterns separate from average basket size.
- Total Revenue by Product Category: Ranks Flower, Edibles, Concentrates, Pre-Rolls, Vapes, and Accessories by total revenue — directly informs purchasing and shelf-space decisions.
- Net Profit by Month: Shows net profit by month so you can separate revenue trends from margin trends and catch cost creep before it erodes profitability.
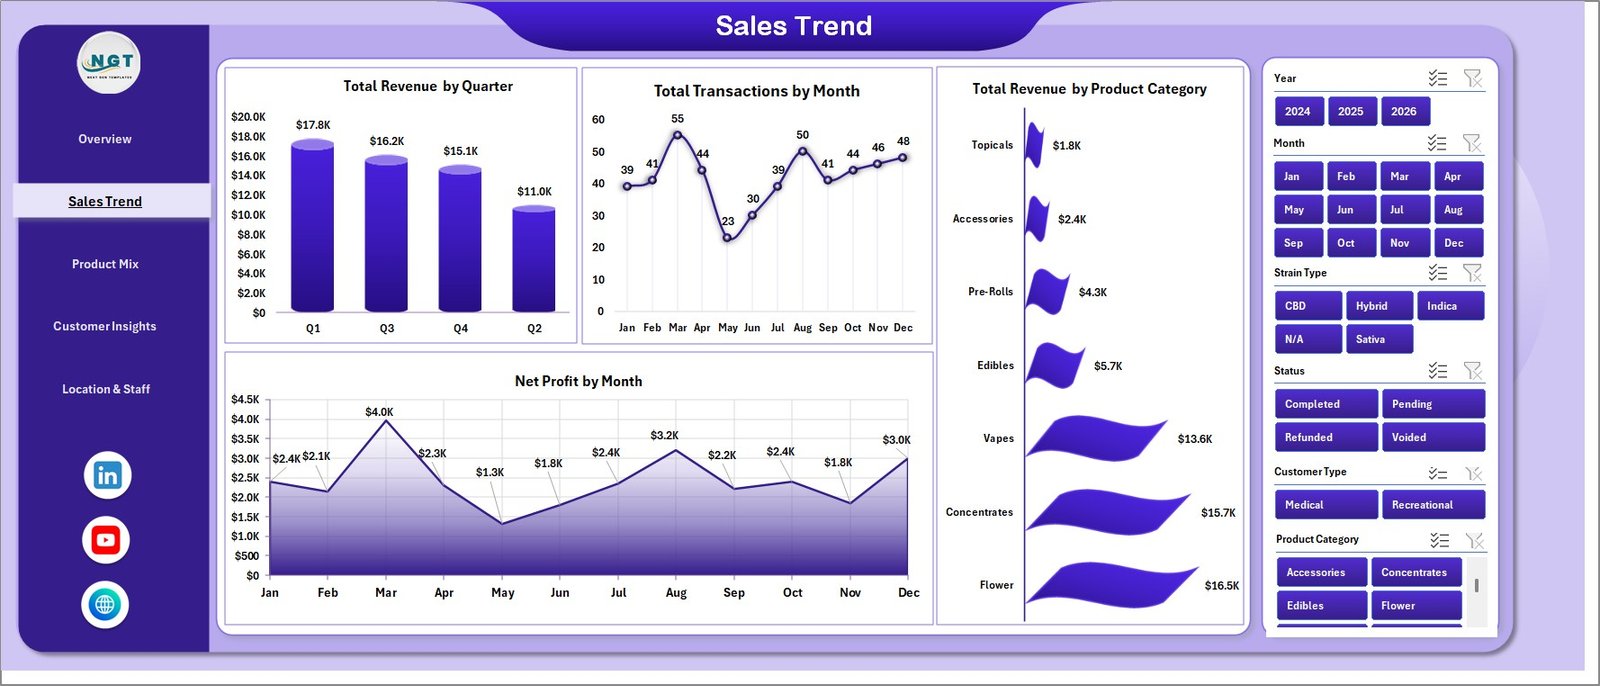
Sales Trend Page
3. Product Mix Page
The Product Mix page focuses on which categories and strains actually make money — not just which ones move volume.
- Net Profit by Product Category: Shows net profit per category, exposing which formats look high-volume but contribute little to the bottom line.
- Total Transactions by Customer Type: Compares transaction count between Recreational, Medical, and First-Time Customer segments.
- Total Revenue by Strain Type: Breaks revenue down by Indica, Sativa, Hybrid, and CBD so you can match purchasing to demand.
- Profit Margin % by Strain Type: Calculates gross profit margin by strain type — essential for vendor negotiations and promo planning.
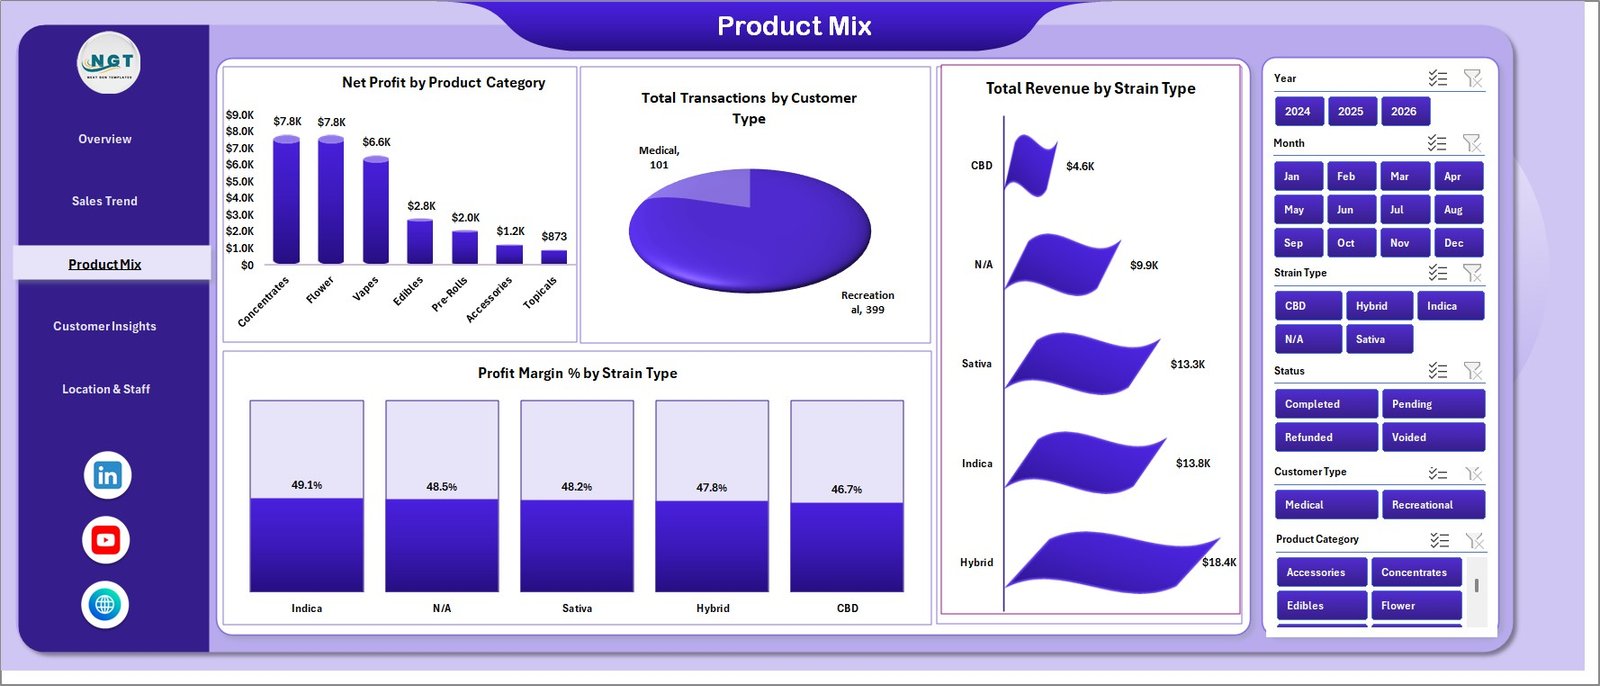
Product Mix Page
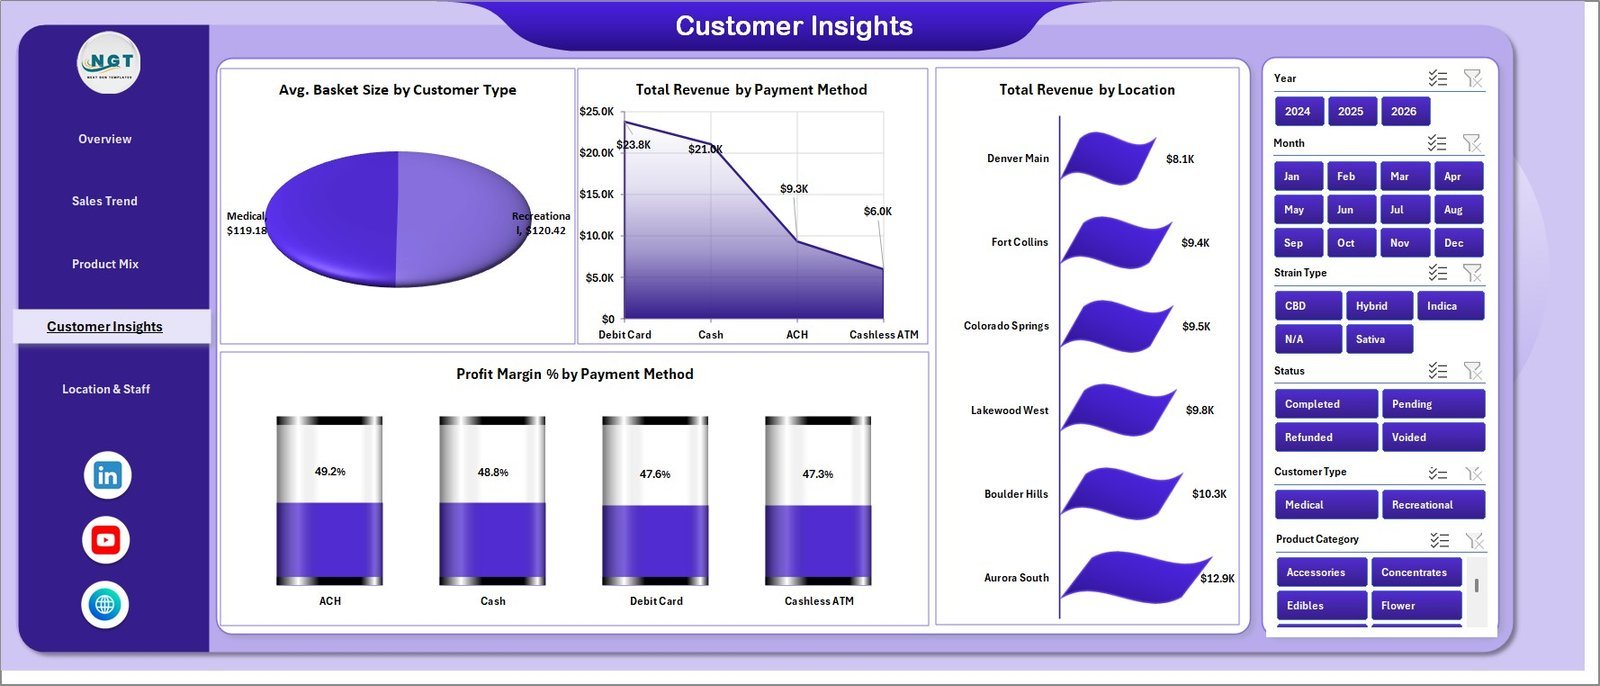
4. Customer Insights Page
The Customer Insights page turns transactional data into customer behavior intelligence and payment-mix analysis.
- Avg. Basket Size by Customer Type: Shows whether Medical, Recreational, or First-Time Customers spend more per visit — drives loyalty and onboarding strategy.
- Total Revenue by Payment Method: Splits revenue across Cash, Debit, ACH, and Crypto — critical for cash-handling, banking, and reconciliation planning in a cash-heavy industry.
- Total Revenue by Location: Ranks every store location by total revenue so district managers know where to focus coaching and where to pull successful playbooks from.
- Profit Margin % by Payment Method: Highlights which payment methods cost you the most in fees relative to the margin they leave behind.
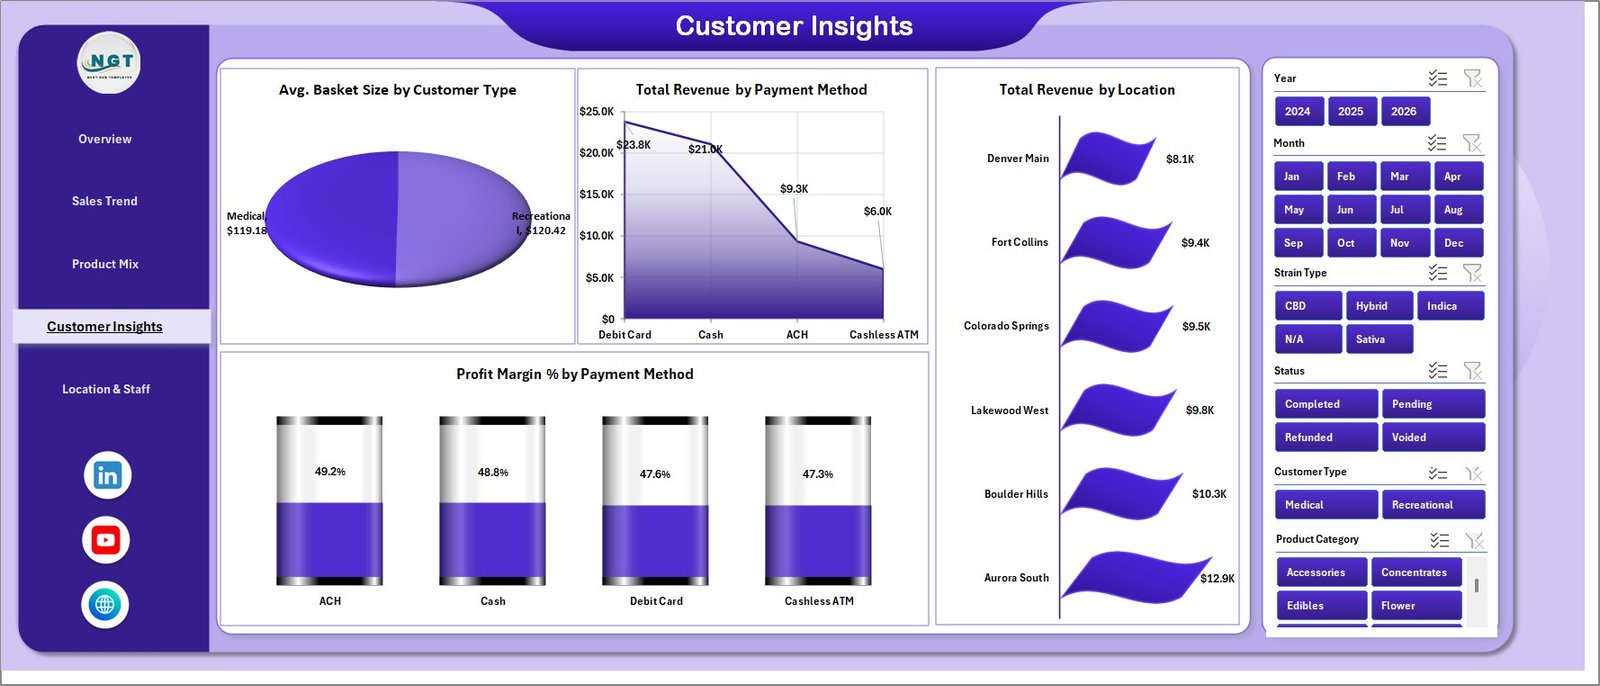
Customer Insights Page
5. Location & Staff Page
The Location & Staff page benchmarks store and budtender performance on profitability, revenue, and basket size.
- Profit Margin % by Location: Ranks every store by profit margin — the single best view to identify which locations need pricing or COGS attention.
- Avg. Basket Size by Budtender: Shows which budtenders consistently upsell — directly linked to coaching and incentive programs.
- Total Revenue by Budtender: Tracks total revenue per budtender, useful for performance reviews, commission tiers, and identifying top performers worth promoting.
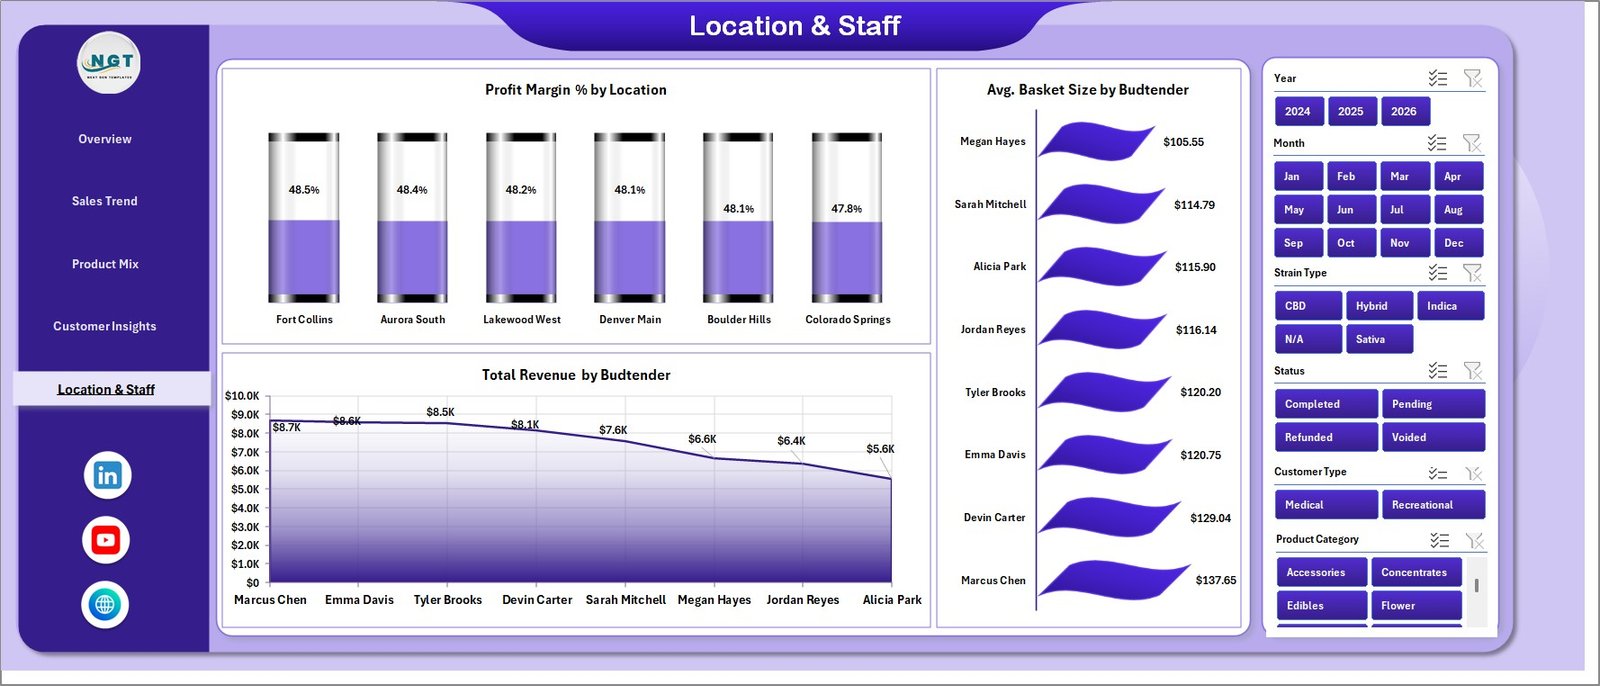
Location & Staff Page
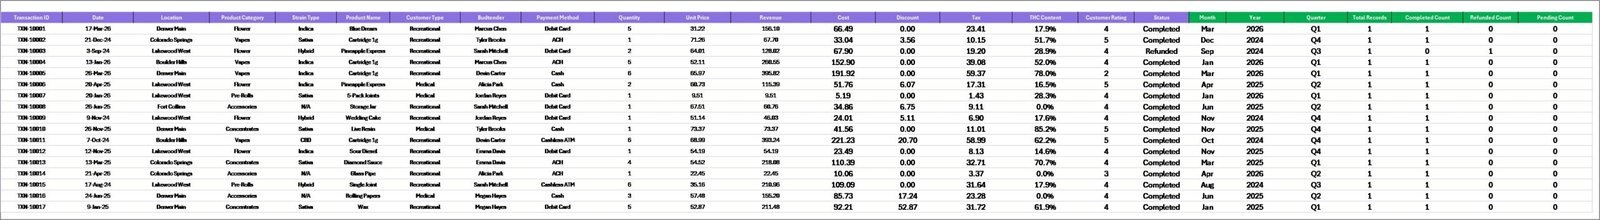
6. Data Sheet Tab
The Data Sheet is where you paste your dispensary transaction records in the exact format shown in the sample. Every pivot table reads from this one sheet, so there is no dual-maintenance.

Data Sheet tab
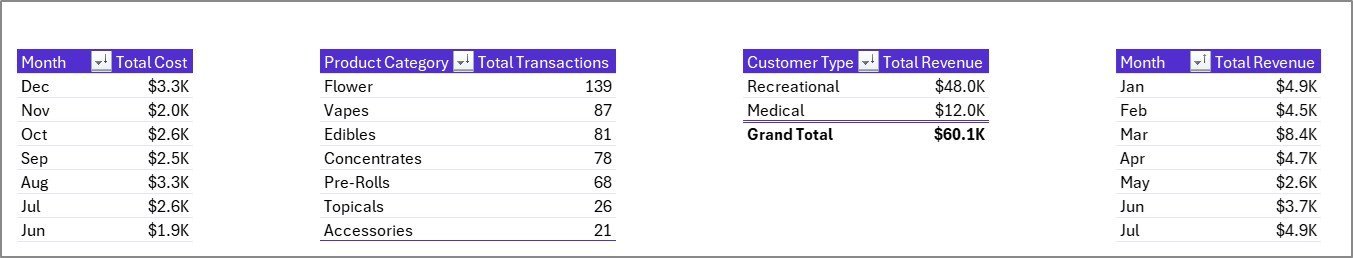
7. Support Sheet Tab
The Support Sheet houses all pivot tables that power the dashboard. After updating the Data sheet, go to the Data tab on the Excel ribbon and click Refresh All — every pivot and every chart rebuilds automatically. This sheet can be kept hidden from end users.
Support sheet tab
📊 Cannabis Dispensary Dashboard in Excel vs. Google Sheets Equivalent vs. Paid Dispensary SaaS — Where This Fits
| Feature | Cannabis Dispensary Dashboard in Excel | Google Sheets Equivalent | Paid Dispensary SaaS (Dutchie / Flowhub / Treez) |
|---|---|---|---|
| Cost | $17.99 one-time ✅ | $9.99–$19.99 one-time | $99–$499 / user / month |
| Platform | Microsoft Excel (offline-ready) ✅ | Google Sheets (cloud-only) | Proprietary web app |
| Setup time | Under 10 minutes ✅ | Under 10 minutes | 2–6 weeks onboarding |
| Analysis pages | 5 interactive pages + Data + Support ✅ | 5 pages | 15+ pre-built reports |
| Strain-level margin tracking | Profit Margin % by Strain Type ✅ | Available | Available on higher tiers |
| Budtender performance ranking | Built-in by Avg. Basket and Revenue ✅ | Available | Available |
| Mobile access | Excel mobile app ✅ | Google Sheets mobile ✅ | Dedicated app |
| Year-1 cost (5 users) | $17.99 total ✅ | $19.99 total | $5,940–$29,940 |
| Data ownership | Local .xlsx file you control ✅ | Google Drive | Vendor cloud |
For dispensaries that want a sales-and-margin analytics layer without paying tens of thousands per year in SaaS fees, the Cannabis Dispensary Dashboard in Excel sits in the sweet spot.
👥 Who This Template Is For — and Who It’s Not For
✅ This template is built for:
- Independent dispensary owners running 1–10 stores who want monthly revenue, margin, and budtender visibility without buying tier-three POS analytics.
- Multi-state operators (MSOs) who need a single-file performance review across stores, strain types, and customer segments.
- Cannabis retail managers tracking budtender performance, basket size, and category mix month over month.
- Cannabis accountants and bookkeepers preparing monthly management reports for dispensary clients.
- Cannabis-industry consultants and analysts who want a fast, reusable Excel reporting layer on top of a client’s POS export.
❌ This template is NOT for:
- Dispensaries that need real-time POS integration, METRC seed-to-sale traceability, or dispensing hardware — for that, use a full cannabis-management platform.
- Operators that require automated state regulatory reporting and ID scanning baked in — those features need a vertical SaaS.
- Teams that refuse to work in Excel and prefer pure cloud-first tooling — consider our Google Sheets Dashboards instead.
⚙️ How to Use the Cannabis Dispensary Dashboard in Excel
- Download the .zip file and extract the Excel workbook to your local drive.
- Open the workbook in Microsoft Excel 2016 or later (Excel 365 recommended).
- Go to the Data Sheet tab and paste your dispensary transactions into the same columns as the sample data.
- Click the Data tab in the Excel ribbon and press Refresh All — every pivot table and chart will refresh automatically.
- Use the slicers on each page to filter by product category, customer type, payment method, location, strain type, or budtender.
- Review the Overview page KPI cards to see top-line performance, then drill into Sales Trend, Product Mix, Customer Insights, and Location & Staff for detail.
- Save a dated copy each month to build a rolling history of dispensary performance.
💼 Real-World Use Cases
Marcus owns a 3-store independent dispensary chain in Denver. He replaced a $299 per month POS analytics add-on with the Cannabis Dispensary Dashboard in Excel to track Total Revenue, Net Profit, and Profit Margin % by strain type across his 3 locations. He now spends 25 minutes a month pasting POS exports instead of 5 hours building reports — and identified that Hybrid strains were carrying his Indica-heavy stores.
Priya is the operations manager at an 8-store recreational chain in Michigan. She uses the dashboard’s Location & Staff page to rank stores by Profit Margin % and budtenders by Avg. Basket Size. Coaching the bottom-quartile budtenders against the top-quartile playbook lifted average basket size by 14% in one quarter.
Daniel is a cannabis-industry accountant serving 18 dispensary clients across California. Instead of building a new dashboard for each client, he sends every client a copy of this template and turns around month-end management reports in under 40 minutes per client.
❓ Frequently Asked Questions
What KPIs does the Cannabis Dispensary Dashboard in Excel track?
The Cannabis Dispensary Dashboard in Excel tracks 5 headline KPIs — Total Revenue, Net Profit, Total Transactions, Total Quantity, and Avg. Basket Size — plus 17+ pivot-driven charts across sales trend, product mix, customer insights, and location and staff performance. All metrics refresh automatically after you click Data → Refresh All.
How long does setup take?
Setup of the Cannabis Dispensary Dashboard in Excel takes under 10 minutes. Download the .zip, open the .xlsx, paste your transactions into the Data sheet in the same column order as the sample, then press Data → Refresh All. Every chart and KPI updates immediately — no formula editing required.
Can I use this template for multiple dispensary store locations?
Yes. The Cannabis Dispensary Dashboard in Excel is designed for multi-store operations. Every page has a Location slicer, and the Customer Insights and Location & Staff pages plot revenue, profit margin, and basket size by store, so you can benchmark locations side by side.
Which versions of Excel does this dashboard support?
The Cannabis Dispensary Dashboard in Excel works in Microsoft Excel 2016, 2019, 2021, and Microsoft 365 on Windows and Mac. It also opens in Excel Online in read-only mode. Pivot tables and slicers require the desktop app for full interactivity, per the official Microsoft Excel slicers documentation.
How does this compare to paid dispensary SaaS like Dutchie or Flowhub?
Paid dispensary SaaS like Dutchie or Flowhub typically costs $99–$499 per user per month and includes POS, METRC compliance, and ID scanning. The Cannabis Dispensary Dashboard in Excel is $17.99 one-time and focuses on revenue, profit, and performance analytics — so most dispensaries run it alongside their POS instead of replacing it.
Can I add my own custom KPIs and charts?
Absolutely. The Cannabis Dispensary Dashboard in Excel is fully editable. You can extend the Data sheet with new columns, add custom pivot fields on the Support sheet, and create additional charts on any page. Nothing is locked.
Do I get future updates to the Cannabis Dispensary Dashboard in Excel?
Yes. Every structural improvement or fix is shared at no additional charge. Re-download the .zip from your NextGenTemplates account at any time to get the latest version.
👤 About the Author
Built by PK — Microsoft Certified Professional with 15+ years of Excel, Google Sheets, and Power BI experience. Founder of NextGenTemplates, reaching 300K+ subscribers across YouTube channels (@PK-AnExcelExpert, @NextGenTemplates, @NeoTechNavigators). Every template is hand-built and tested before release.
🔗 Explore Related Templates
📌 Cannabis Industry KPI Dashboard in Excel — KPI-scorecard companion focused on industry-wide cannabis metrics like compliance, production, and inventory.
📌 Garden Center Dashboard in Excel — Same Excel format, tailored for retail garden and nursery operations.
📌 Pharmacy Dashboard in Excel — Adjacent regulated-retail vertical with similar inventory, customer, and compliance-style analytics.
📌 Dropshipping Dashboard in Excel — Same KPI-and-pivot architecture for e-commerce retail operators.
Also explore our full library of Excel Dashboard Templates.
📖 Click here to read the Detailed Blog Post
🎥 Visit our YouTube channel for step-by-step video tutorials
👉 YouTube.com/@NextGenTemplates
📅 Last updated: May 2026


Reviews
There are no reviews yet.