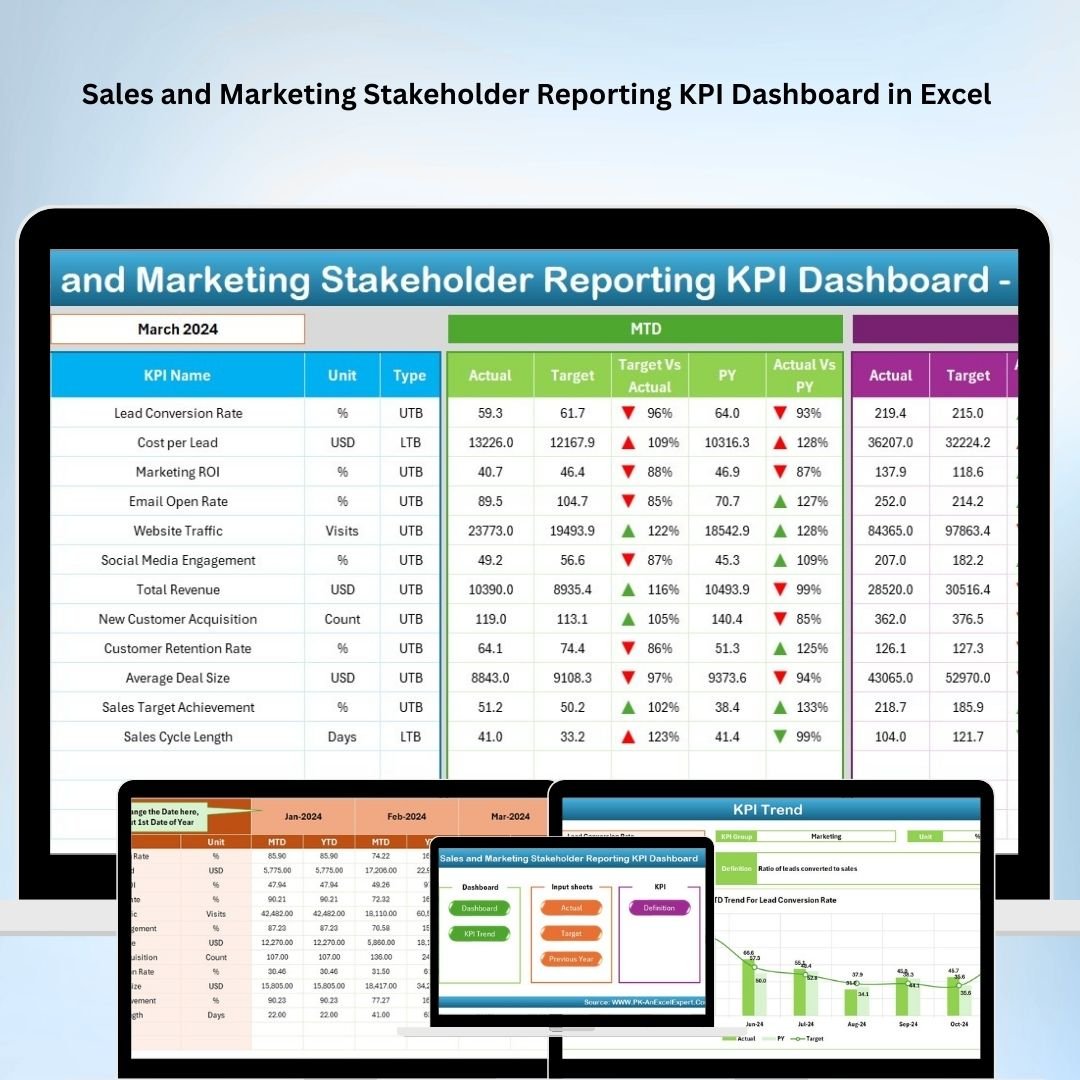


The Sales and Marketing Stakeholder Reporting KPI Dashboard in Excel is a dynamic tool designed to help sales and marketing teams monitor, analyze, and report key performance indicators (KPIs) effectively. This Excel-based dashboard enables businesses to keep stakeholders informed about performance metrics, sales trends, and marketing efforts, making it an essential tool for decision-making and performance evaluation.
By consolidating sales and marketing data in one place, this dashboard provides clear insights into campaign effectiveness, lead generation, conversion rates, and overall performance against targets. Whether you’re a marketing director, sales manager, or business owner, this tool provides you with the necessary metrics to optimize your sales and marketing strategies.
Key Features of the Sales and Marketing Stakeholder Reporting KPI Dashboard in Excel
📊 Comprehensive KPI Tracking
Track key performance metrics for both sales and marketing departments, such as sales revenue, lead conversion rates, customer acquisition costs, and marketing ROI. All critical KPIs are presented in an easy-to-understand format.
📈 Sales Performance Analysis
Monitor sales performance with metrics like MTD (Month-to-Date), YTD (Year-to-Date), and previous year comparisons. Quickly identify trends and areas where sales are excelling or underperforming.
📅 Marketing Campaign Effectiveness
Measure the success of marketing campaigns with KPIs such as cost per acquisition (CPA), return on investment (ROI), and customer engagement rates. Analyze the impact of various marketing strategies on sales performance.
📉 Target vs Actual Comparison
Compare actual performance against targets for both sales and marketing metrics. This feature allows you to track progress, identify gaps, and adjust strategies as needed.
📊 Visual Data Representation
Dynamic charts and graphs provide an intuitive visual representation of your sales and marketing performance, making it easy to share insights with stakeholders and senior management.
⚙️ Customizable Metrics & KPIs
Tailor the dashboard to reflect the specific KPIs and metrics most relevant to your business. Add custom fields for more granular tracking of performance metrics.
Why You’ll Love the Sales and Marketing Stakeholder Reporting KPI Dashboard in Excel

✅ Track Sales & Marketing Performance in One Place
Keep all critical performance data organized and easily accessible in a single dashboard. Monitor both sales and marketing KPIs simultaneously for a comprehensive view of business performance.
✅ Improve Decision-Making & Strategy
With real-time data at your fingertips, make data-driven decisions to optimize marketing campaigns and boost sales strategies. Track trends, identify gaps, and take timely action.
✅ Easily Report to Stakeholders
Generate clear, visual reports for stakeholders and senior management. Communicate performance insights effectively, highlighting successes and areas for improvement.
✅ Measure Marketing ROI Effectively
Track the effectiveness of your marketing spend by measuring ROI, lead generation efficiency, and conversion rates. Ensure marketing efforts are contributing positively to sales growth.
✅ Customizable & Scalable
This dashboard is fully customizable, allowing you to adjust KPIs and metrics according to your company’s needs. It’s suitable for businesses of all sizes, from startups to large enterprises.
What’s Inside the Sales and Marketing Stakeholder Reporting KPI Dashboard in Excel?
-
Comprehensive KPI Tracking: Monitor sales revenue, lead conversion, CPA, and ROI.
-
Sales Performance Monitoring: Track MTD, YTD, and previous year comparisons.
-
Marketing Campaign Effectiveness: Measure marketing performance with ROI, acquisition costs, and customer engagement.
-
Target vs Actual Comparison: Monitor actual performance against targets.
-
Visual Data Representation: Easily share performance insights with stakeholders using charts and graphs.
-
Customizable Metrics: Adjust the dashboard to suit your business’s unique needs.
How to Use the Sales and Marketing Stakeholder Reporting KPI Dashboard in Excel
1️⃣ Download the Template: Access the Sales and Marketing Stakeholder Reporting KPI Dashboard in Excel instantly.
2️⃣ Input Sales & Marketing Data: Enter your sales performance and marketing campaign metrics into the dashboard.
3️⃣ Monitor KPIs & Performance: Track key metrics such as lead generation, sales, customer acquisition, and ROI.
4️⃣ Analyze Data & Insights: Use the visual charts to analyze trends and identify areas for improvement.
5️⃣ Generate Reports for Stakeholders: Share insights with stakeholders and management using the customizable reports.
Who Can Benefit from the Sales and Marketing Stakeholder Reporting KPI Dashboard in Excel?
🔹 Sales Managers & Marketing Directors
🔹 Business Owners & Entrepreneurs
🔹 Data Analysts & Performance Managers
🔹 E-commerce Platforms & Online Retailers
🔹 Marketing Teams & Sales Teams
🔹 Consultants & Business Analysts
🔹 Enterprises & Corporations
Optimize your sales and marketing strategies with the Sales and Marketing Stakeholder Reporting KPI Dashboard in Excel. Track KPIs, measure campaign effectiveness, and share valuable insights with stakeholders for improved decision-making.
Click here to read the Detailed blog post
Visit our YouTube channel to learn step-by-step video tutorials
Youtube.com/@PKAnExcelExpert


Reviews
There are no reviews yet.