

Contact Center AI Dashboard in Excel helps support leaders track AI containment, customer interactions, revenue impact, cost savings, CSAT, handle time, resolution time, sentiment, channel mix, and agent performance in one refreshable workbook. Contact centers often spend thousands per year on analytics add-ons and AI reporting tools, but this dashboard gives you a one-time Excel template for $17.99 with seven connected tabs, slicer-driven filtering, five executive KPI cards, and pivot-powered charts. Built by PK, a Microsoft Certified Professional with 15+ years of Excel dashboard experience and 300K+ YouTube subscribers, it is designed for teams that want fast operational visibility without a monthly SaaS subscription.
Key Features of Contact Center AI Dashboard in Excel
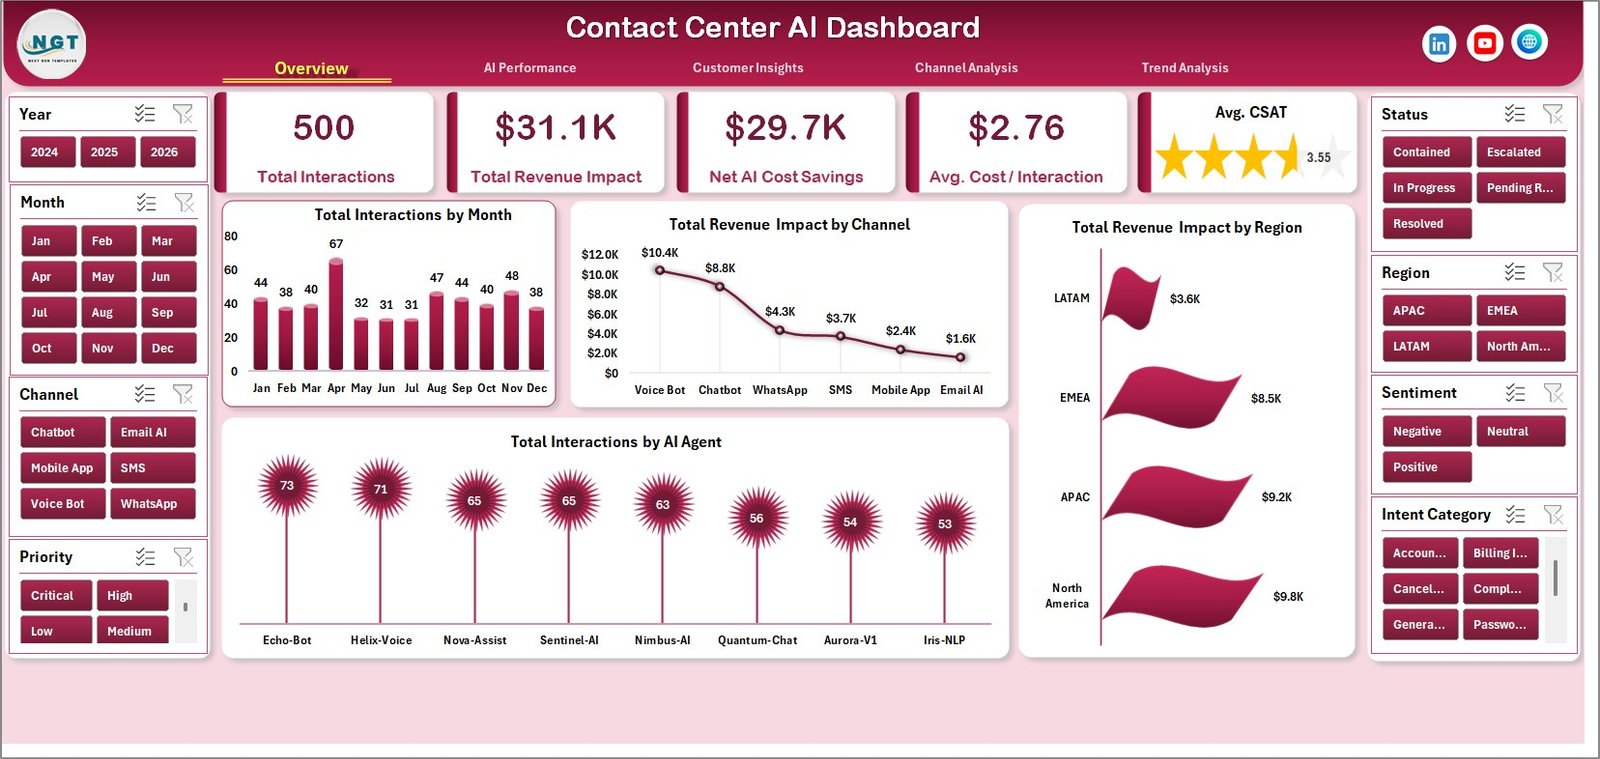
- Executive KPI cards: Track Total Interactions, Total Revenue Impact, Net AI Cost Savings, Avg. Cost / Interaction, and Avg. CSAT from the Overview page.
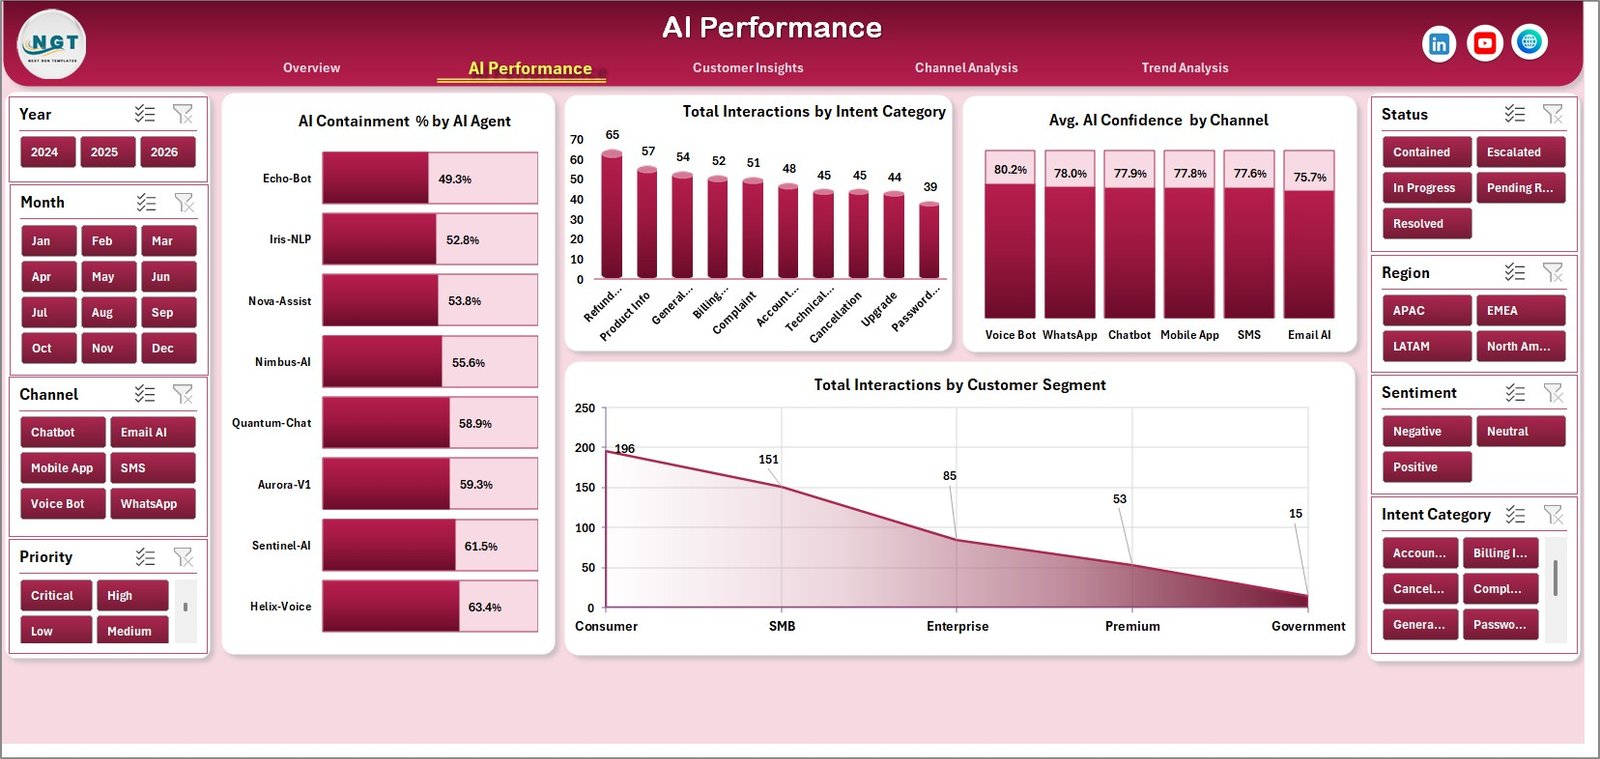
- AI performance analytics: Review AI containment by AI agent, interactions by intent category, AI confidence by channel, and interactions by customer segment.
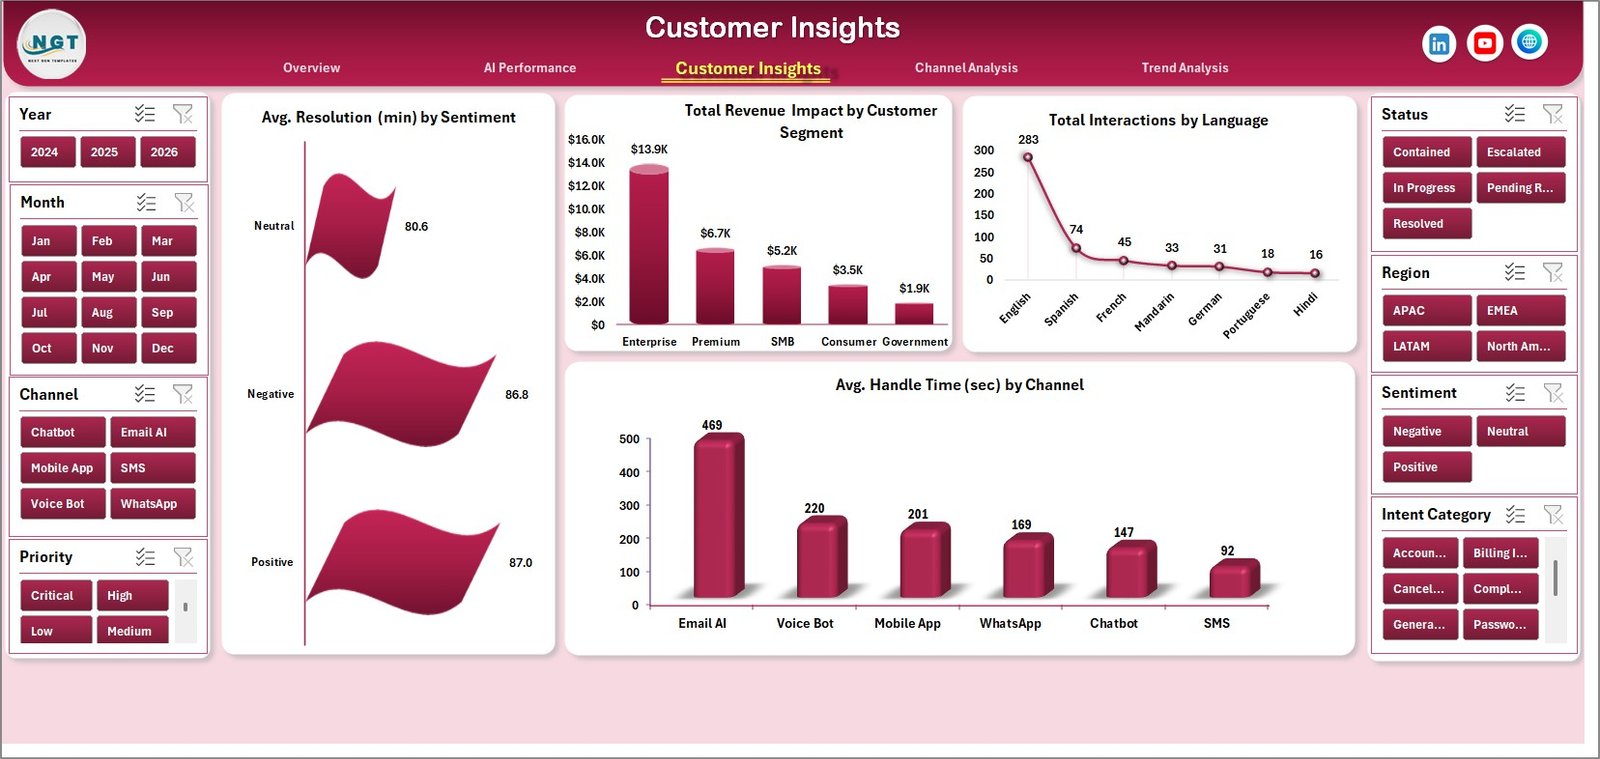
- Customer insight views: Analyze resolution time by sentiment, revenue impact by customer segment, language mix, and average handle time by channel.
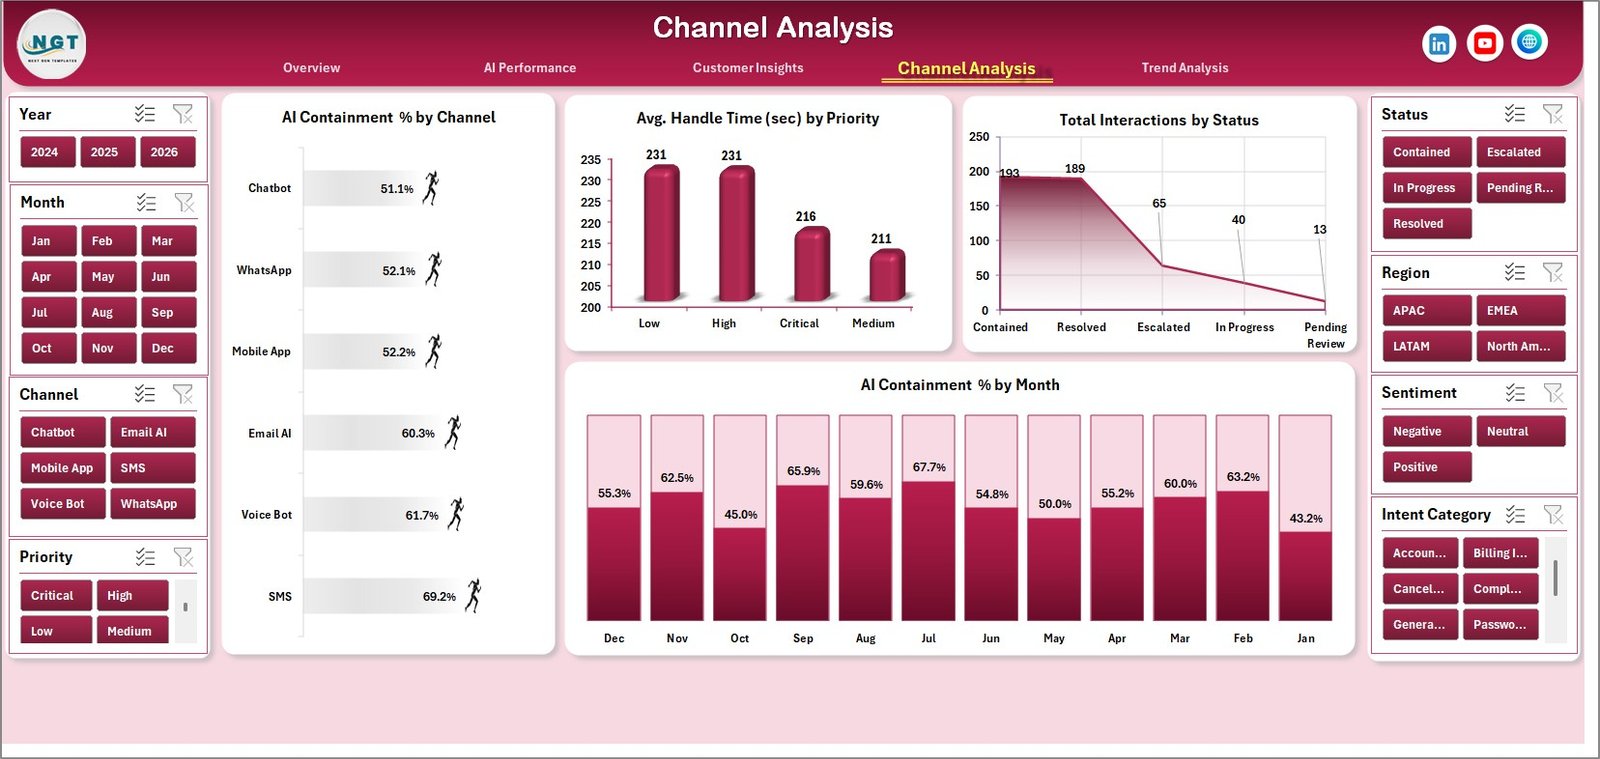
- Channel analysis: Compare containment by channel, handle time by priority, interaction status, and containment trends by month.
- Trend analysis: Monitor CSAT by month, revenue impact by month, and annual interaction volume.
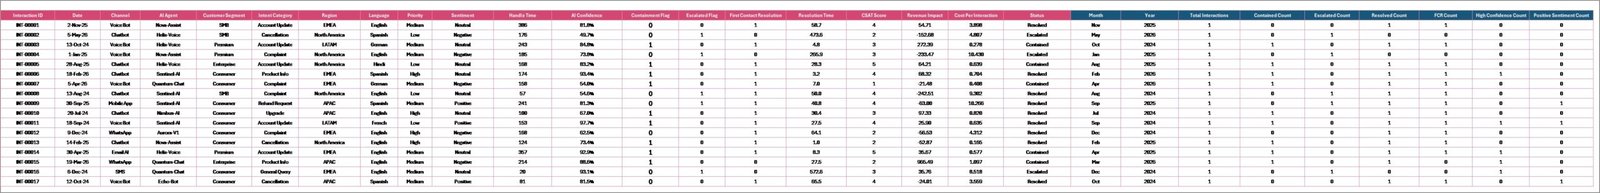
- Data and support sheets: Replace sample records in the Data sheet, then refresh pivot tables from the Support sheet to update every page.
- Interactive slicers: Filter the workbook quickly by available fields and see charts update without rebuilding formulas.
- Editable Excel format: Customize chart colors, slicers, pivot fields, and data columns for your own contact center workflow.
What’s Inside the Contact Center AI Dashboard in Excel
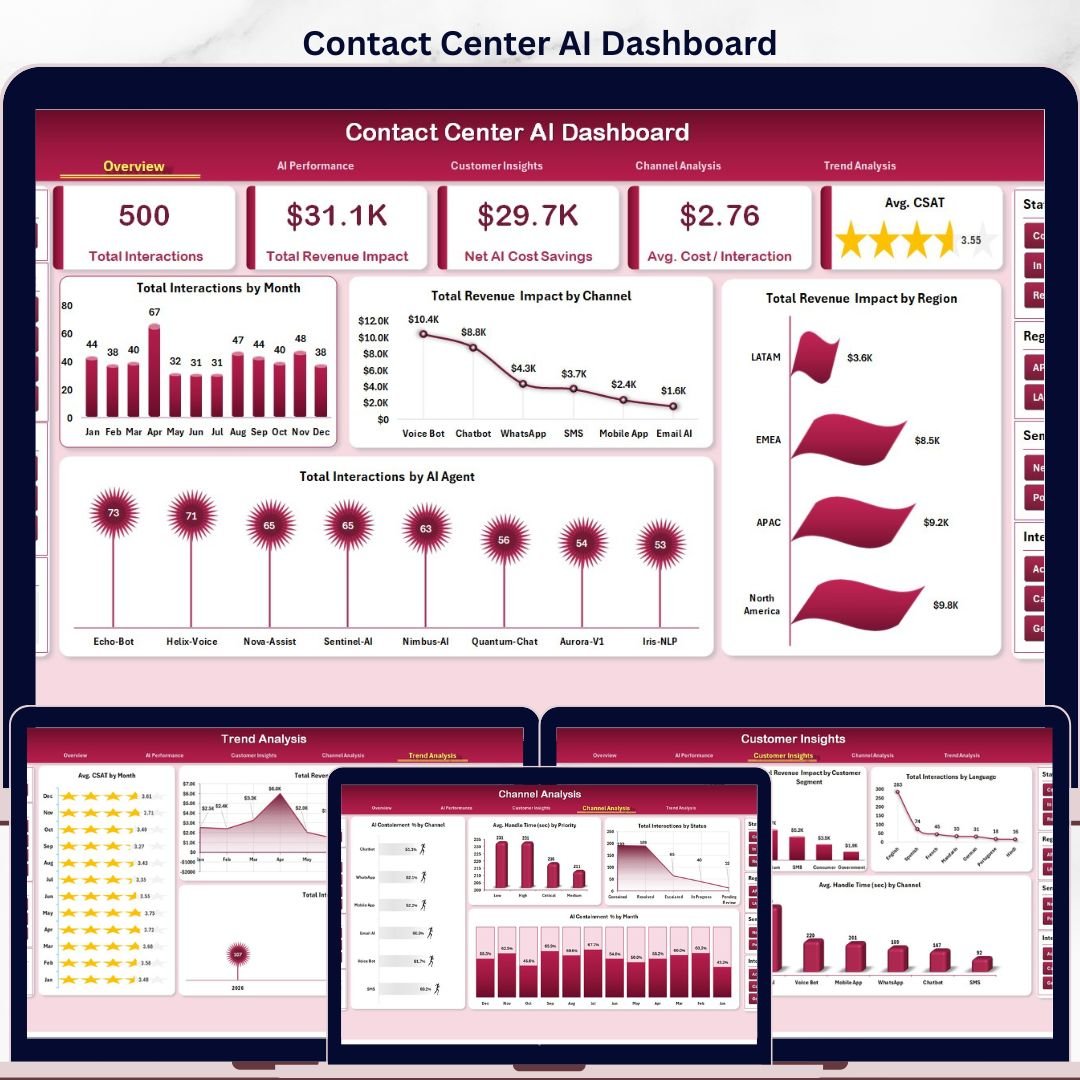
Overview Page
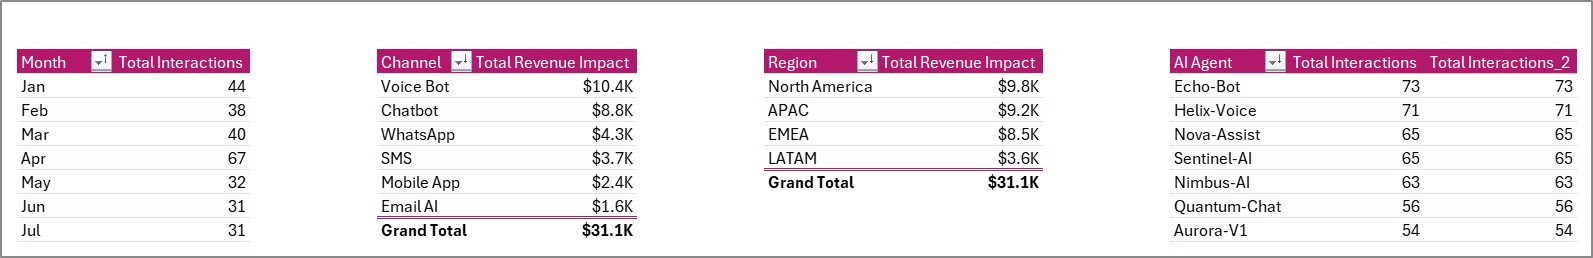
The Overview page gives leaders a fast read on overall AI contact center performance. KPI cards show Total Interactions, Total Revenue Impact, Net AI Cost Savings, Avg. Cost / Interaction, and Avg. CSAT, while charts compare interactions by month, revenue impact by channel and region, and interactions by AI agent.
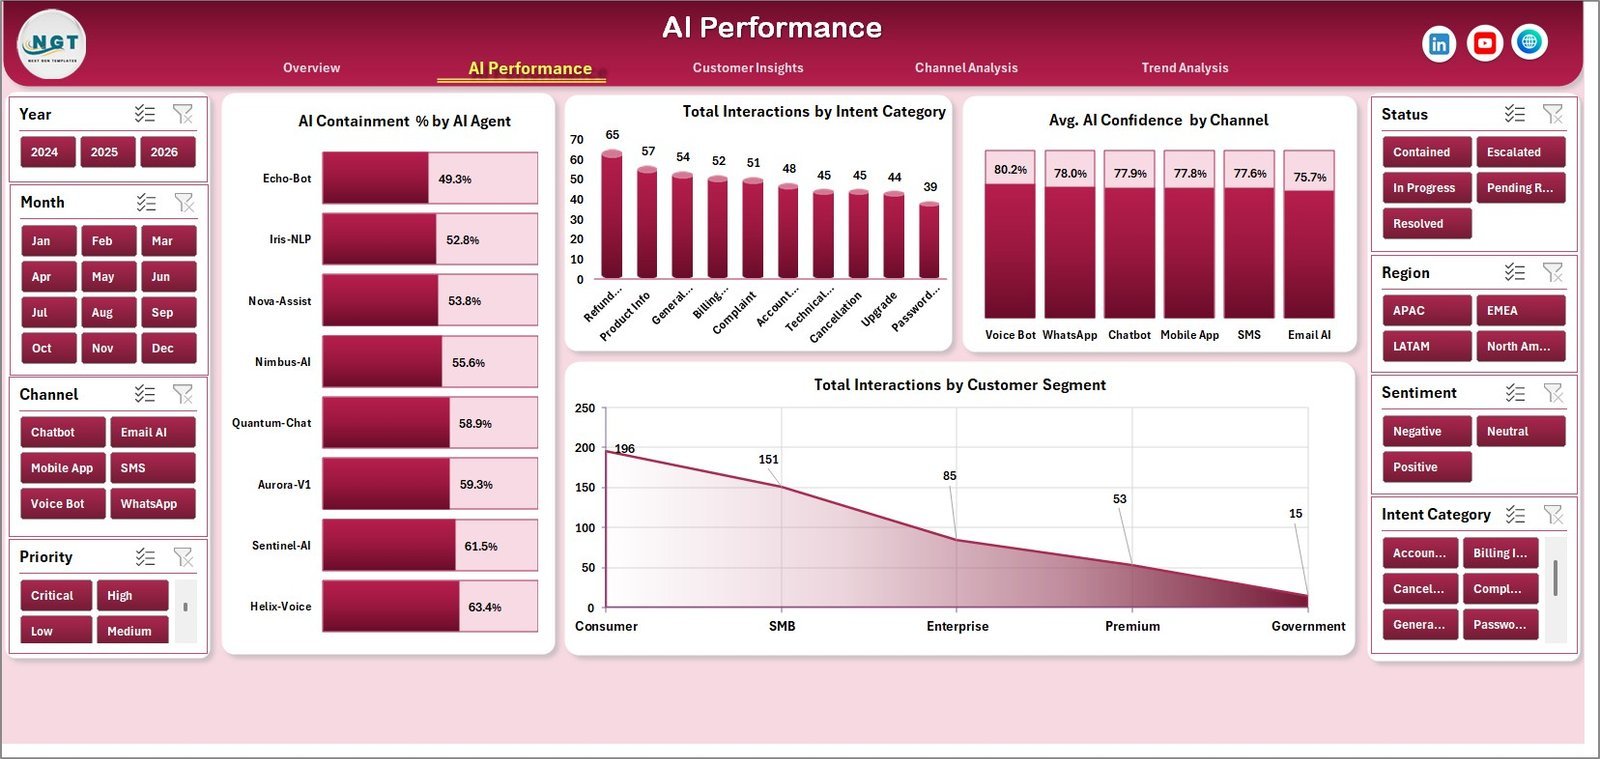
AI Performance
The AI Performance tab focuses on how well virtual agents and automation are handling customer demand. It includes AI Containment % by AI Agent, Total Interactions by Intent Category, Avg. AI Confidence by Channel, and Total Interactions by Customer Segment.
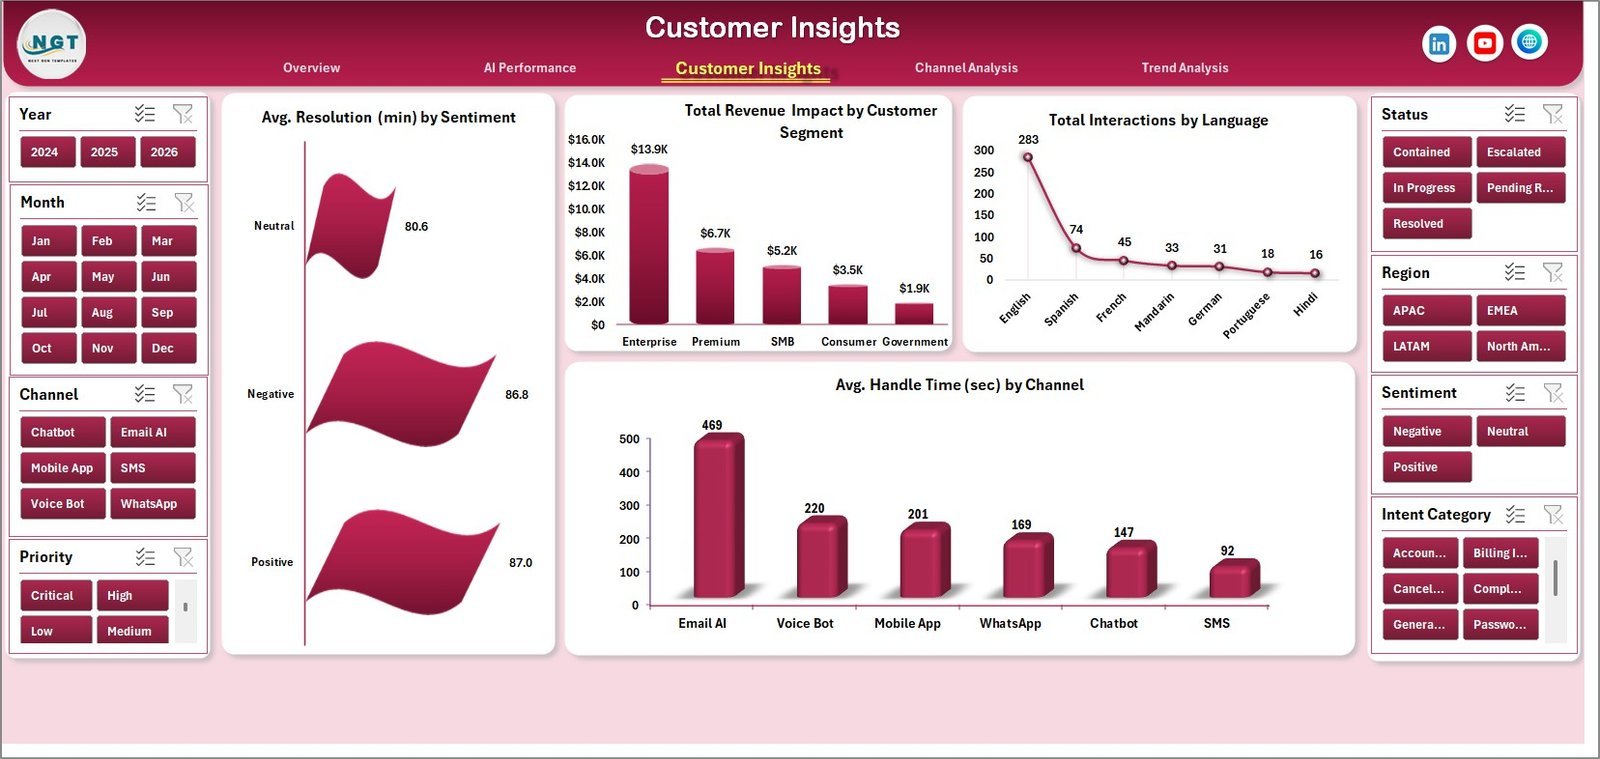
Customer Insights
The Customer Insights page helps managers understand how customer experience varies by sentiment, segment, language, and channel. It shows Avg. Resolution (min) by Sentiment, Total Revenue Impact by Customer Segment, Total Interactions by Language, and Avg. Handle Time (sec) by Channel.
Channel Analysis
The Channel Analysis tab compares operating efficiency across voice, chat, email, and other support channels. Charts include AI Containment % by Channel, Avg. Handle Time (sec) by Priority, Total Interactions by Status, and AI Containment % by Month.
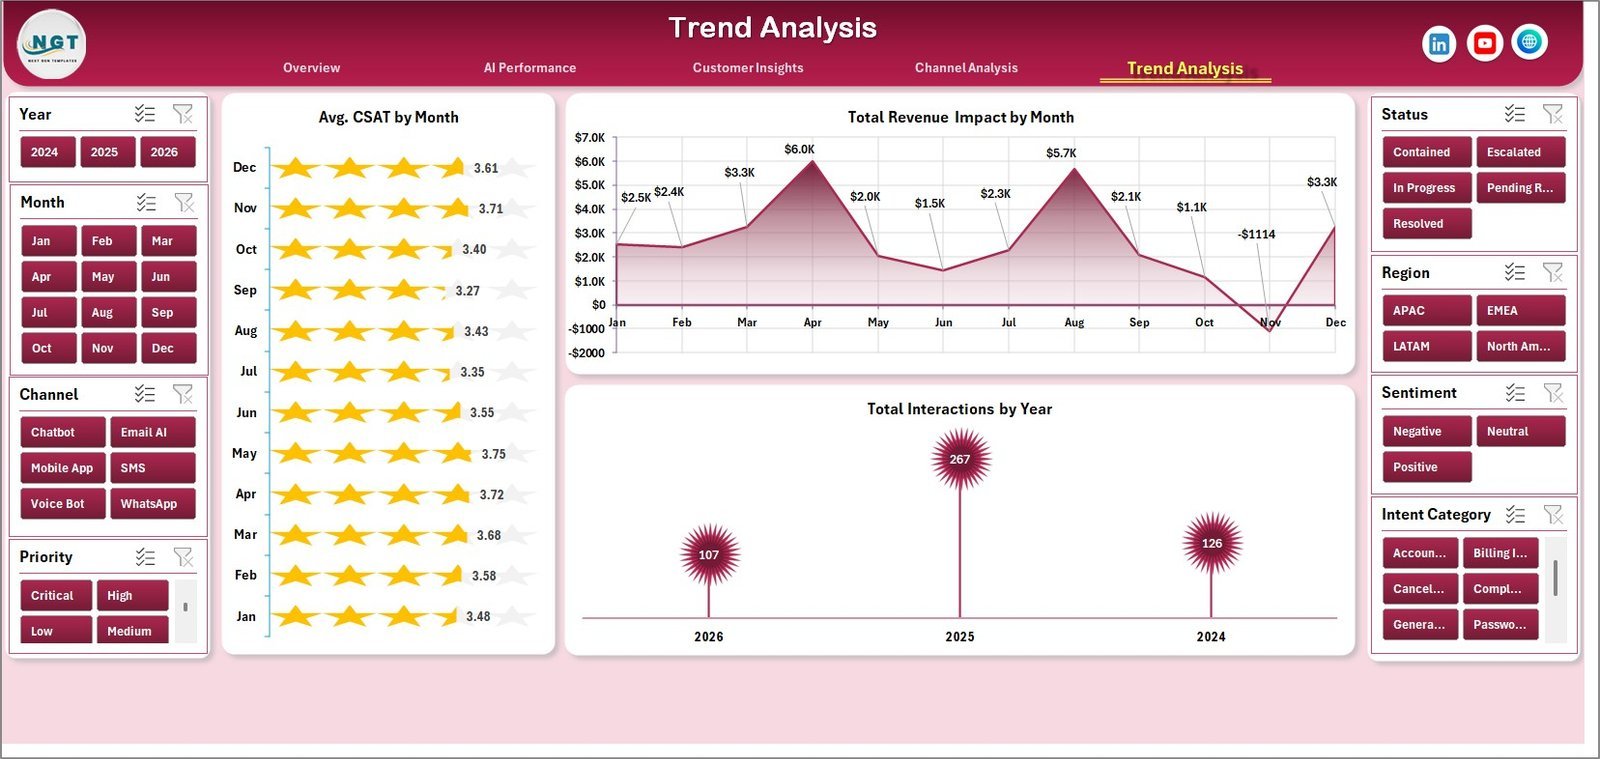
Trend Analysis
The Trend Analysis page is built for month-over-month and year-over-year storytelling. It includes Avg. CSAT by Month, Total Revenue Impact by Month, and Total Interactions by Year so teams can see whether AI adoption is improving customer results over time.

Data Sheet Tab
The Data sheet is where you add or replace the contact center records in the same structured format. After updating your rows, refresh the workbook so every pivot table, slicer, chart, and KPI card reflects the latest data.
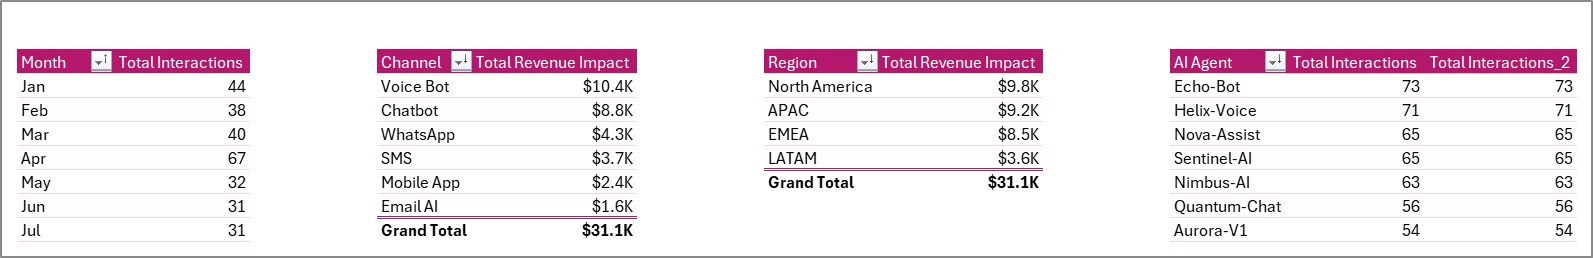
Support Sheet Tab
The Support sheet contains the pivot tables used to create the dashboard dynamically. After updating the Data sheet, go to the Data tab in the Excel Ribbon and click Refresh All; you can keep this sheet hidden during normal use.
Contact Center AI Dashboard in Excel vs. Google Sheets vs. Paid CRM/SaaS – Where This Fits
| Feature | This Excel Dashboard | Google Sheets Alternative | Paid CRM/SaaS |
|---|---|---|---|
| Cost | $17.99 one-time sale price | Template cost or custom build time | Monthly analytics or agent-based pricing |
| Platform | Microsoft Excel desktop or Microsoft 365 | Browser-based spreadsheet | Vendor-hosted cloud platform |
| Setup time | Under 10 minutes after download | Varies by sharing and formulas | Days or weeks for implementation |
| AI containment tracking | Included with AI agent and channel views | Possible, but usually manual | Often available in higher plans |
| Customizable fields | Editable data sheet, pivots, slicers, and charts | Editable but formula maintenance can grow | Limited by vendor permissions |
| Year-1 cost at 5 users | $17.99 plus Excel licenses you already use | Low software cost, more manual setup | Can reach hundreds or thousands per year |
Who This Template Is For – and Who It’s Not For
This template is for contact center managers, CX analysts, AI operations leads, BPO supervisors, customer service directors, and small support teams that already export interaction data and want a fast Excel reporting layer.
It is not for teams that need live API ingestion, real-time queue management, agent scheduling, omnichannel routing, call recording, or compliance-grade case management. Use it as a reporting dashboard, not as a replacement for Zendesk, Genesys, Freshdesk, Salesforce Service Cloud, or a full contact center platform.
How to Use the Contact Center AI Dashboard in Excel
- Download and unzip the product file after purchase.
- Open the workbook in Microsoft Excel.
- Go to the Data sheet and replace the sample rows with your own contact center data in the same format.
- Keep column names and field formats consistent so the pivot tables read the data correctly.
- Go to the Data tab in the Excel Ribbon and click Refresh All.
- Use slicers on the dashboard pages to filter by AI agent, channel, region, segment, priority, status, or other available fields.
- Review Overview, AI Performance, Customer Insights, Channel Analysis, and Trend Analysis for decisions.
Real-World Use Cases
Contact center manager: Priya reviews AI containment by agent every Monday and identifies which virtual assistant needs additional training data.
CX analyst: Daniel compares CSAT and resolution time by sentiment to explain why some customer segments need more human escalation.
BPO operations lead: Maria uses channel and region views to show a client where AI is reducing cost per interaction and where manual handling is still high.
Frequently Asked Questions
What is the Contact Center AI Dashboard in Excel?
It is a ready-to-use Excel dashboard for tracking AI-driven contact center performance, including interactions, containment, revenue impact, cost savings, CSAT, handle time, resolution time, channel mix, sentiment, and customer segment analysis.
Can I replace the sample data?
Yes. Add your own records in the Data sheet using the same format, then click Refresh All to update the dashboard pages.
Do I need advanced Excel skills?
No. Normal use only requires replacing data, refreshing the workbook, and using slicers. Advanced users can also customize pivots, charts, and formatting.
Can I use this for voice, chat, email, and bot interactions?
Yes. The dashboard is designed around channel-level analysis, so you can track multiple contact center channels as long as your data includes a channel field.
Does it connect directly to contact center software?
No. Export your data from your CRM, CCaaS, chatbot platform, or help desk into Excel format, paste it into the Data sheet, and refresh the workbook.
Can I hide the Support sheet?
Yes. The Support sheet stores pivot tables used by the dashboard and can be hidden once setup is complete.
About the Author
Built by PK – Microsoft Certified Professional with 15+ years of Excel, Google Sheets, and Power BI experience. Founder of NextGenTemplates, reaching 300K+ subscribers across YouTube channels. Every template is hand-built and tested before release.
Explore Related Templates
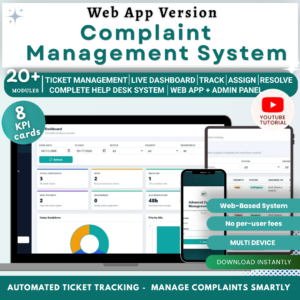
- Complaint Management System: Web App Version – structured complaint tracking with admin and user roles.
- SaaS Customer Success Dashboard in Excel – customer success, MRR, health score, and retention analytics.
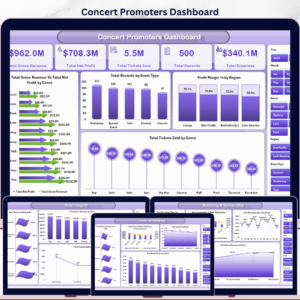
- Concert Promoters Dashboard in Excel – another recent multi-page Excel dashboard example.
- Browse Excel Dashboard templates.
Ready to measure AI containment, customer experience, cost savings, and revenue impact in Excel? Download the Contact Center AI Dashboard in Excel and turn your support data into decision-ready visuals.
Last updated: May 2026.
🔗 Click here to read the Detailed blog post


Reviews
There are no reviews yet.