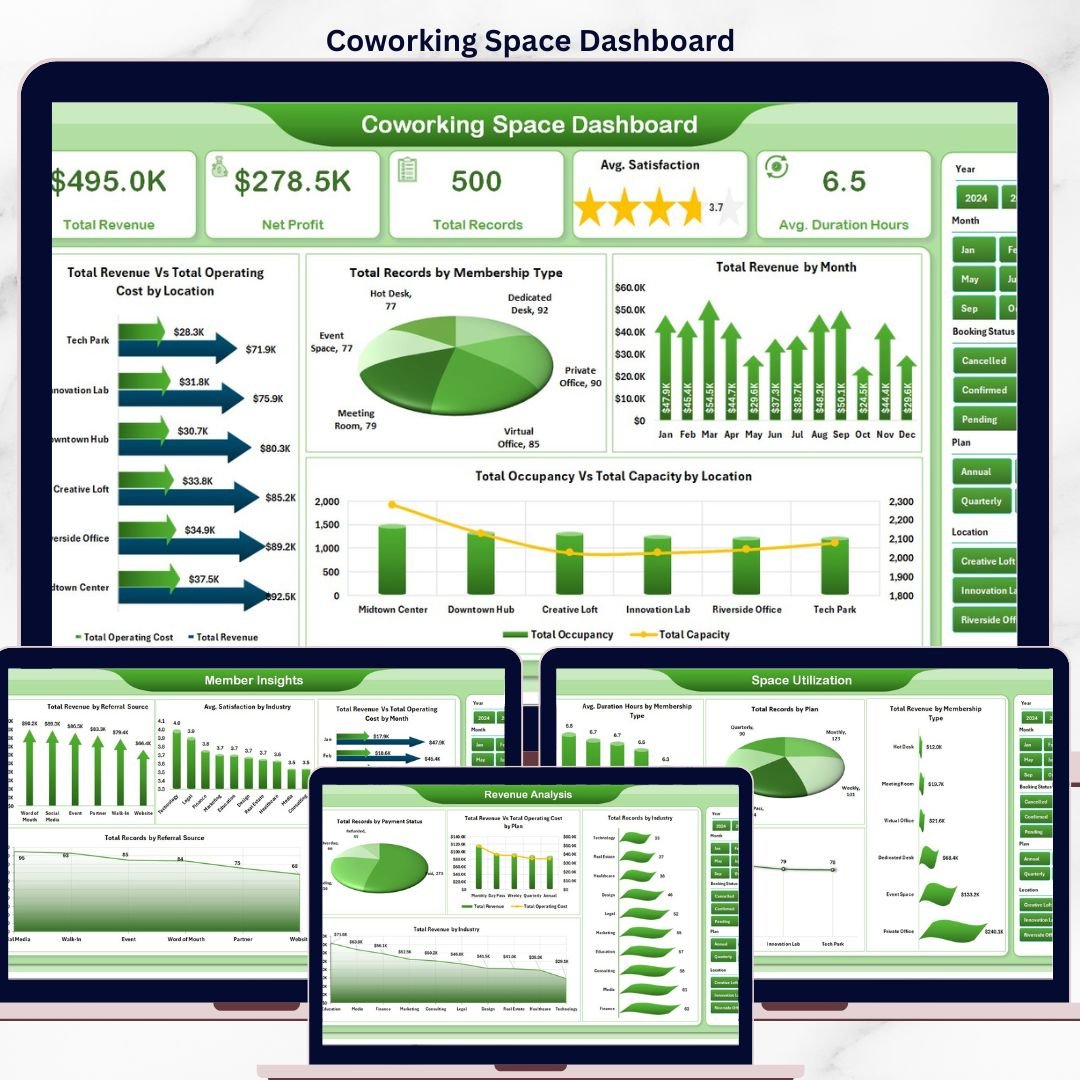


The Coworking Space Dashboard in Excel is a 7-sheet Microsoft Excel template that tracks 5 headline KPIs, 15+ charts, and 7 slicer filters for coworking operators managing revenue, occupancy, membership mix, and member satisfaction across multiple locations. Unlike paid coworking SaaS that charges $149–$499 per location per month, this dashboard is a one-time $17.99 purchase with unlimited users and lifetime updates. Tracks Total Revenue, Net Profit, Total Records, Average Satisfaction, and Average Duration Hours — all updating automatically when you refresh pivot tables.
✅ Trusted by 8,400+ teams across 40+ countries — coworking operators, flexible workspace managers, and hospitality businesses use NextGenTemplates to replace expensive SaaS subscriptions with spreadsheet-based analytics.
✅ Instant download · One-time payment · No subscription · No per-user fees · Lifetime access
Coworking Space Dashboard
🔑 Key Features of Coworking Space Dashboard in Excel
📊 5 KPI Cards on Overview Page — Total Revenue, Net Profit, Total Records, Average Satisfaction score, and Average Duration Hours shown at the top of the Overview sheet. Each card recalculates instantly when you apply any of the 7 slicer filters on the right-hand panel.
📈 Multi-Dimensional Chart Analysis — 15+ pivot-powered charts spread across 5 analysis pages compare Revenue vs Operating Cost by Location, Records by Membership Type, Revenue by Month, and Occupancy vs Capacity by Location to reveal profit leakage and under-utilized rooms.
🎛️ 7 Interactive Slicers — Filter the entire dashboard by Location, Membership Type, Plan, Industry, Referral Source, Payment Status, and Year. Click any slicer and every chart, card, and table refreshes simultaneously within 2 seconds.
🗂️ 5 Analysis Pages + Data + Support — Overview, Space Utilization, Revenue Analysis, Member Insights, Trend Analysis, Data Sheet for raw records, and a Support Sheet with pivot tables that power all visuals.
🔄 Single-Click Refresh Workflow — Replace sample data on the Data Sheet with your own bookings and click Data → Refresh All in the Excel ribbon. Every pivot, chart, and KPI updates in one action.
💼 Multi-Location Ready — Handles coworking chains from single-site operators up to 10-location networks. Location slicer on every page lets regional managers drill from portfolio view to single-location performance.
📱 Works Offline, No Login Required — Unlike cloud coworking platforms, this Excel file runs without internet access, without admin approvals, and without data leaving your company.
📦 What’s Inside the Coworking Space Dashboard in Excel
1. Overview Page
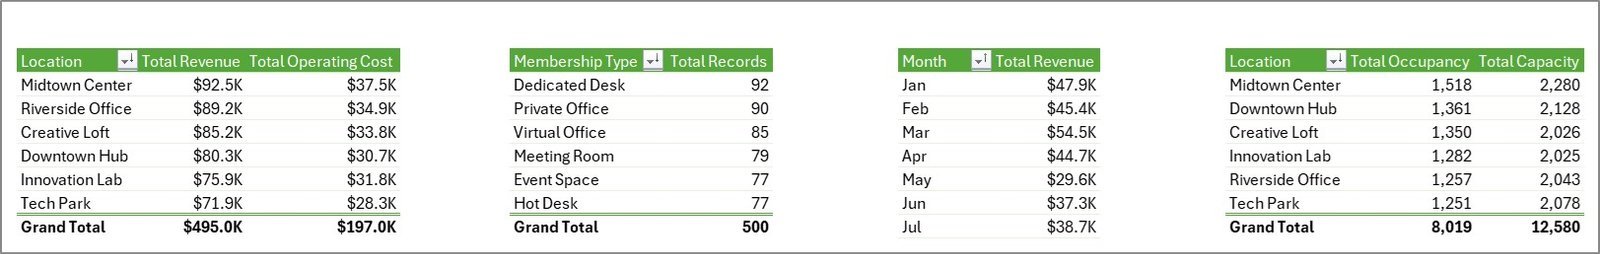
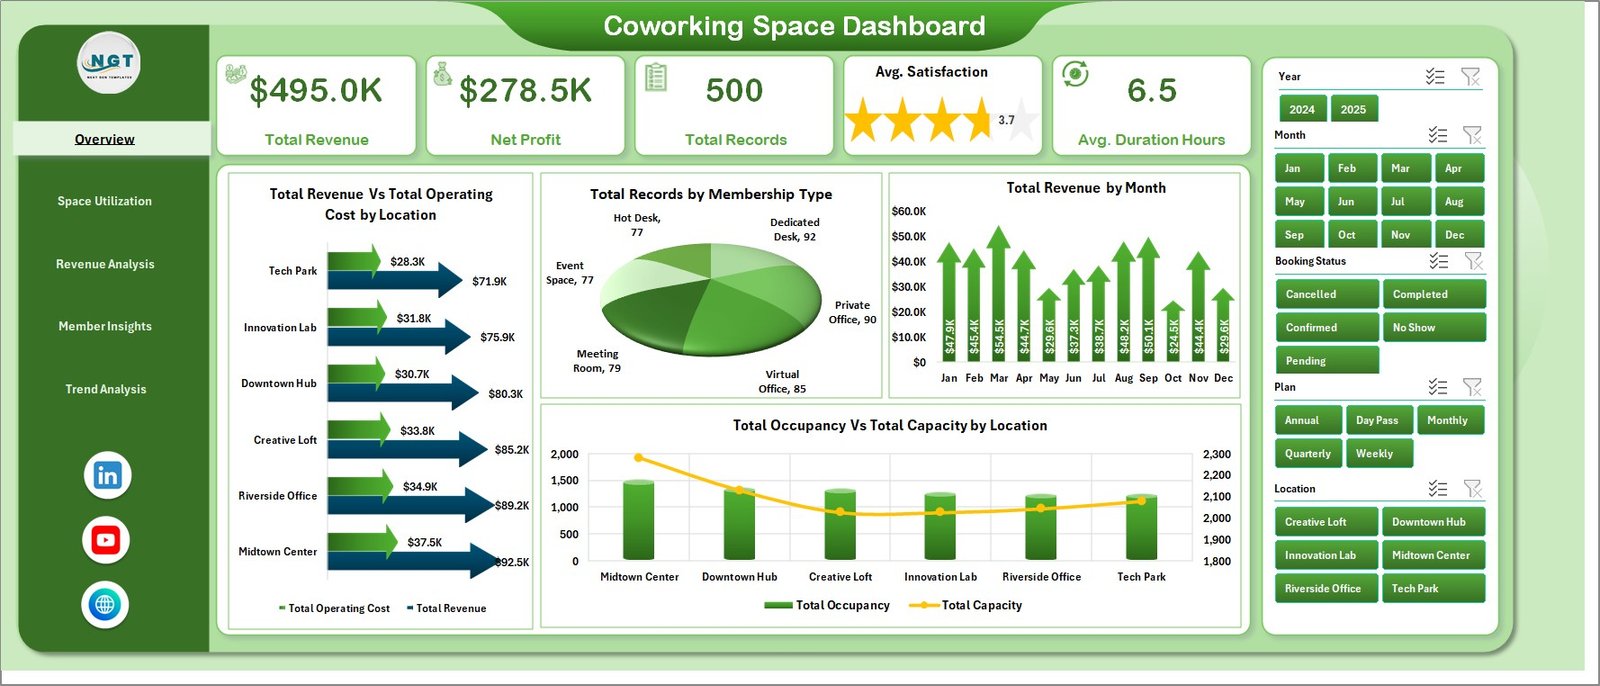
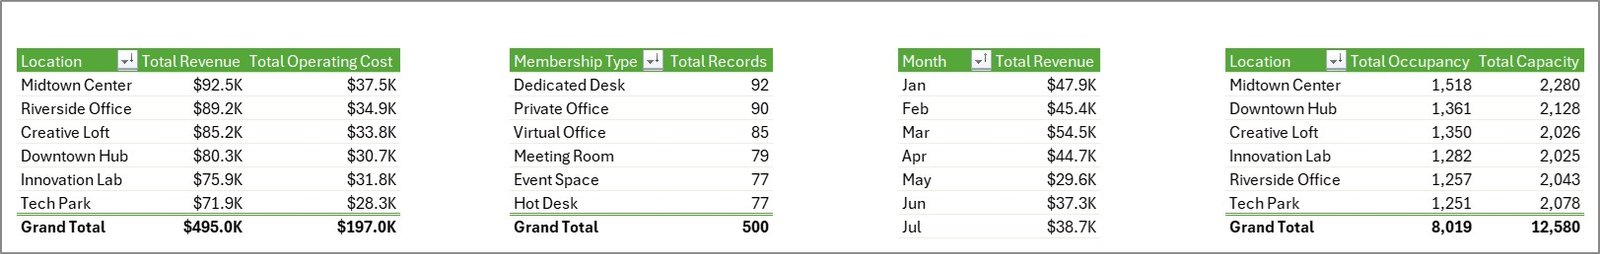
The main command center displays 5 KPI cards — Total Revenue, Net Profit, Total Records, Average Satisfaction, and Average Duration Hours — above a 4-chart grid showing Total Revenue Vs Total Operating Cost by Location (identifies which location drags profit), Total Records by Membership Type (Hot Desk, Dedicated Desk, Private Office, Virtual), Total Revenue by Month (seasonal revenue pattern), and Total Occupancy Vs Total Capacity by Location (utilization gap). Seven slicers on the right filter the entire dashboard.
Coworking Space Dashboard
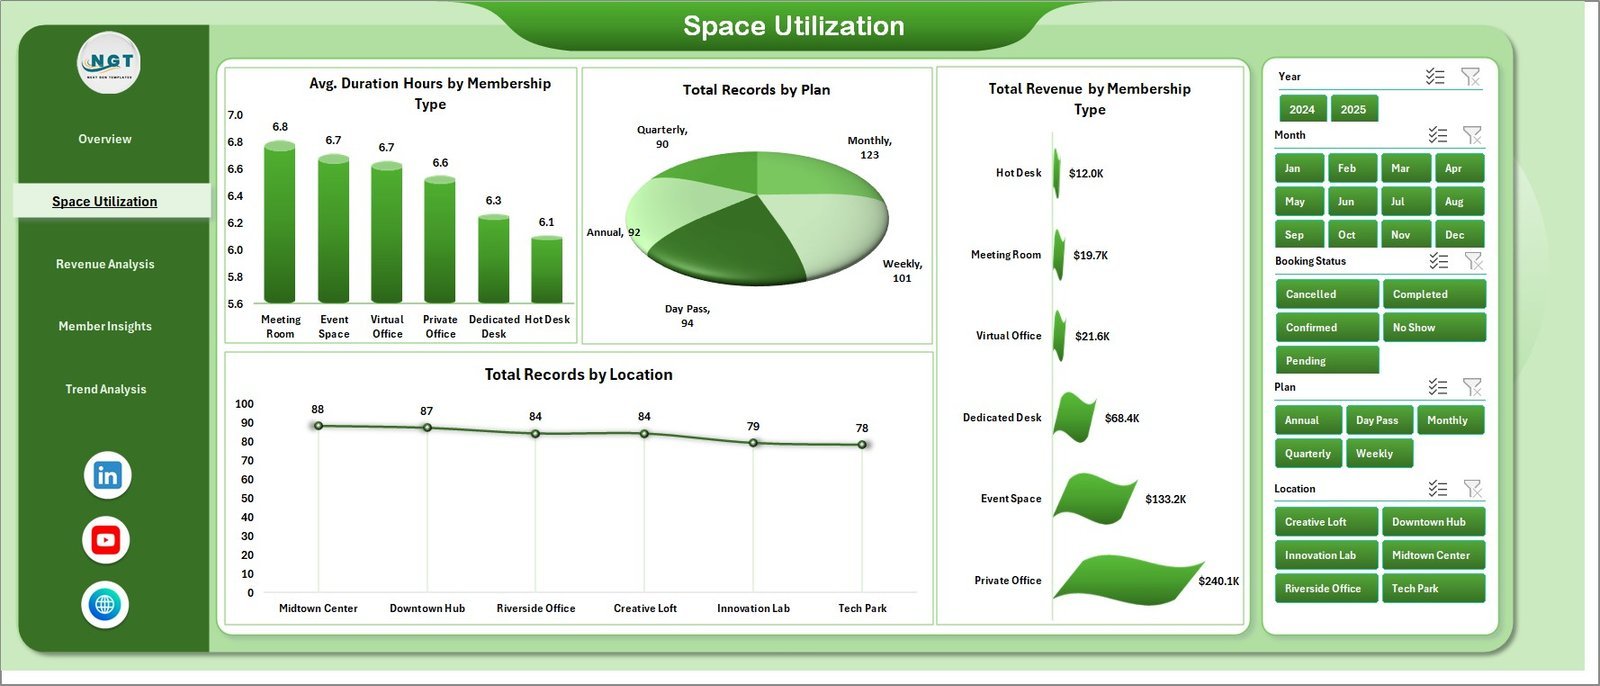
2. Space Utilization Page
Focuses on how members consume time and space. Charts include Avg. Duration Hours by Membership Type (who stays longest), Total Records by Plan (Monthly, Daily, Hourly), Total Revenue by Membership Type (which tier drives revenue), and Total Records by Location (which branch books most).

Space Utilization
3. Revenue Analysis Page
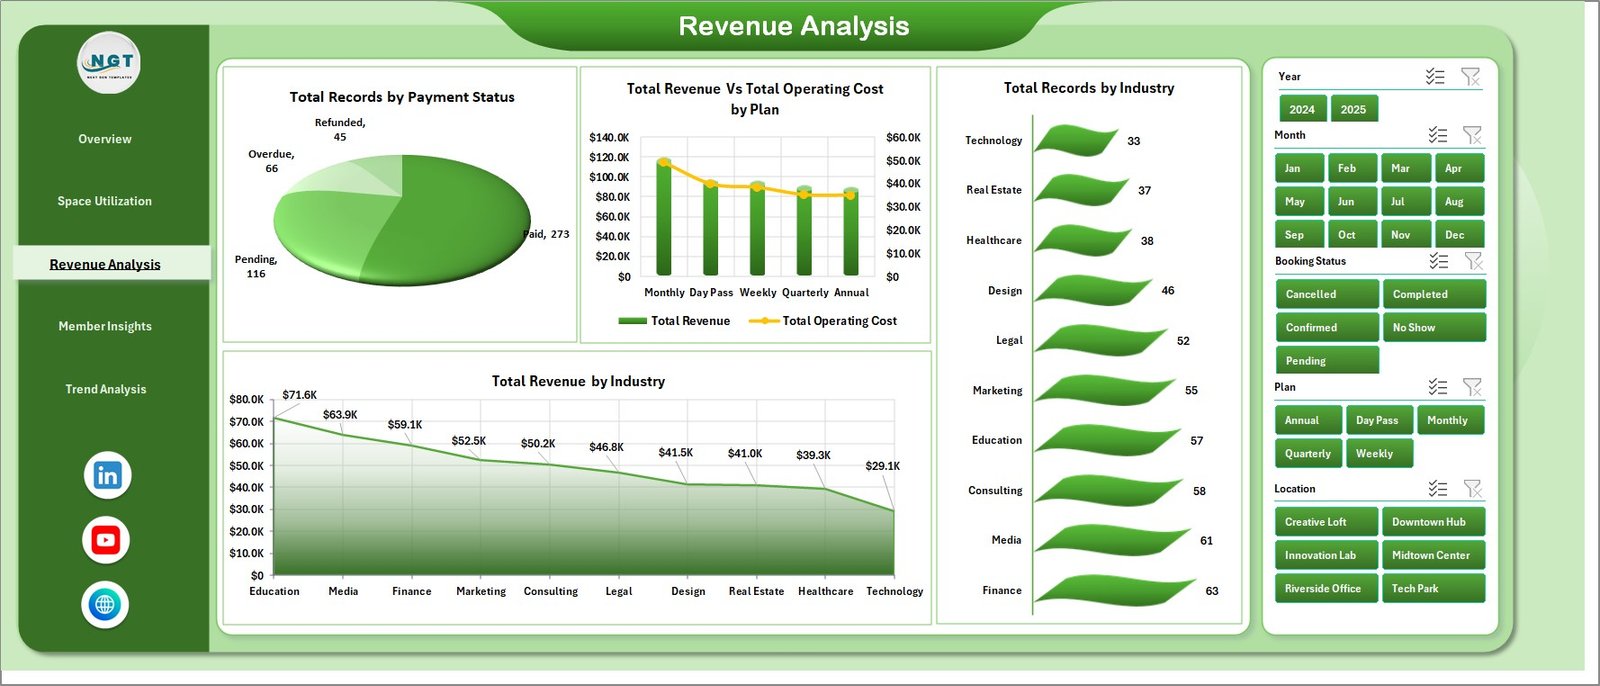
Digs into monetization and collection health. Charts include Total Records by Payment Status (Paid, Pending, Overdue), Total Revenue Vs Total Operating Cost by Plan (which plan is profitable after costs), Total Records by Industry, and Total Revenue by Industry (which member segments fund your space).
Revenue Analysis
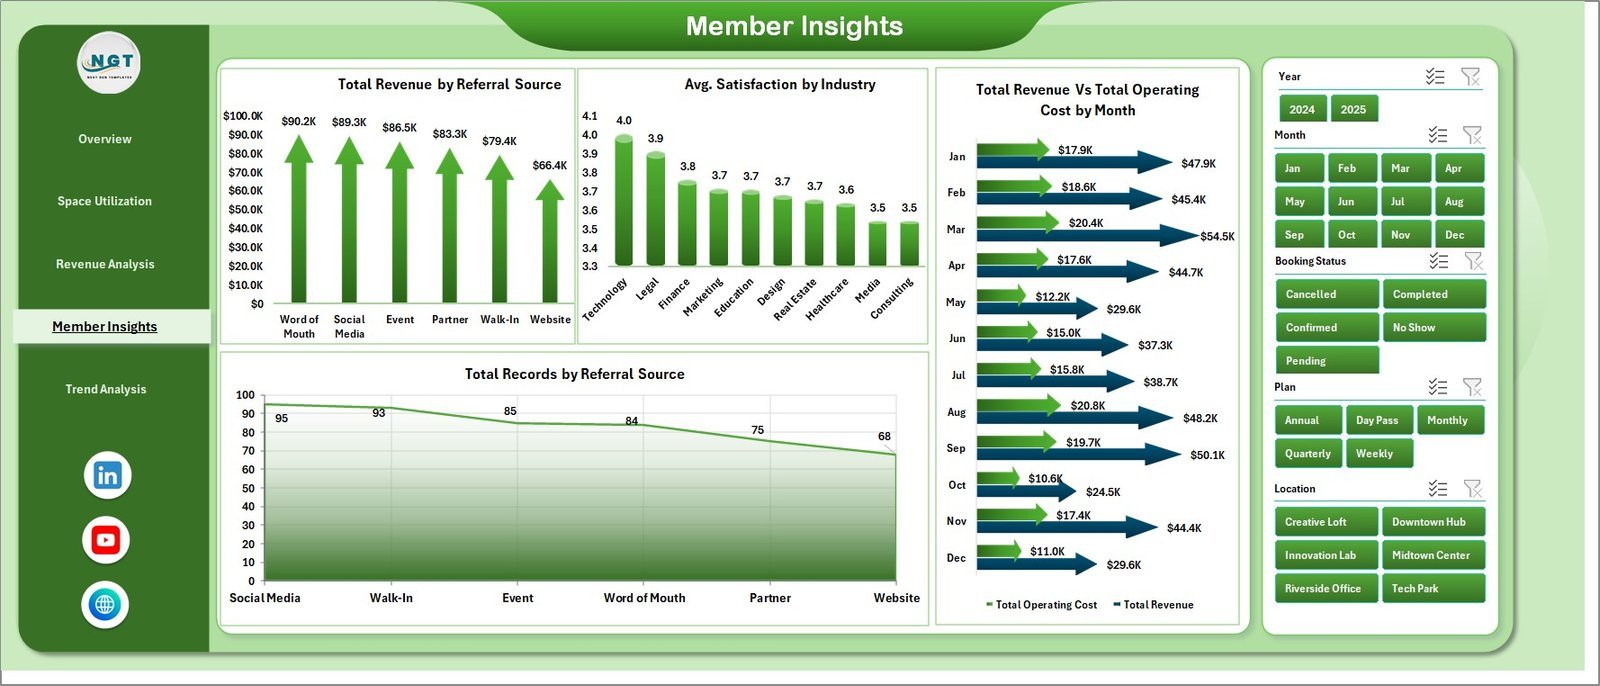
4. Member Insights Page
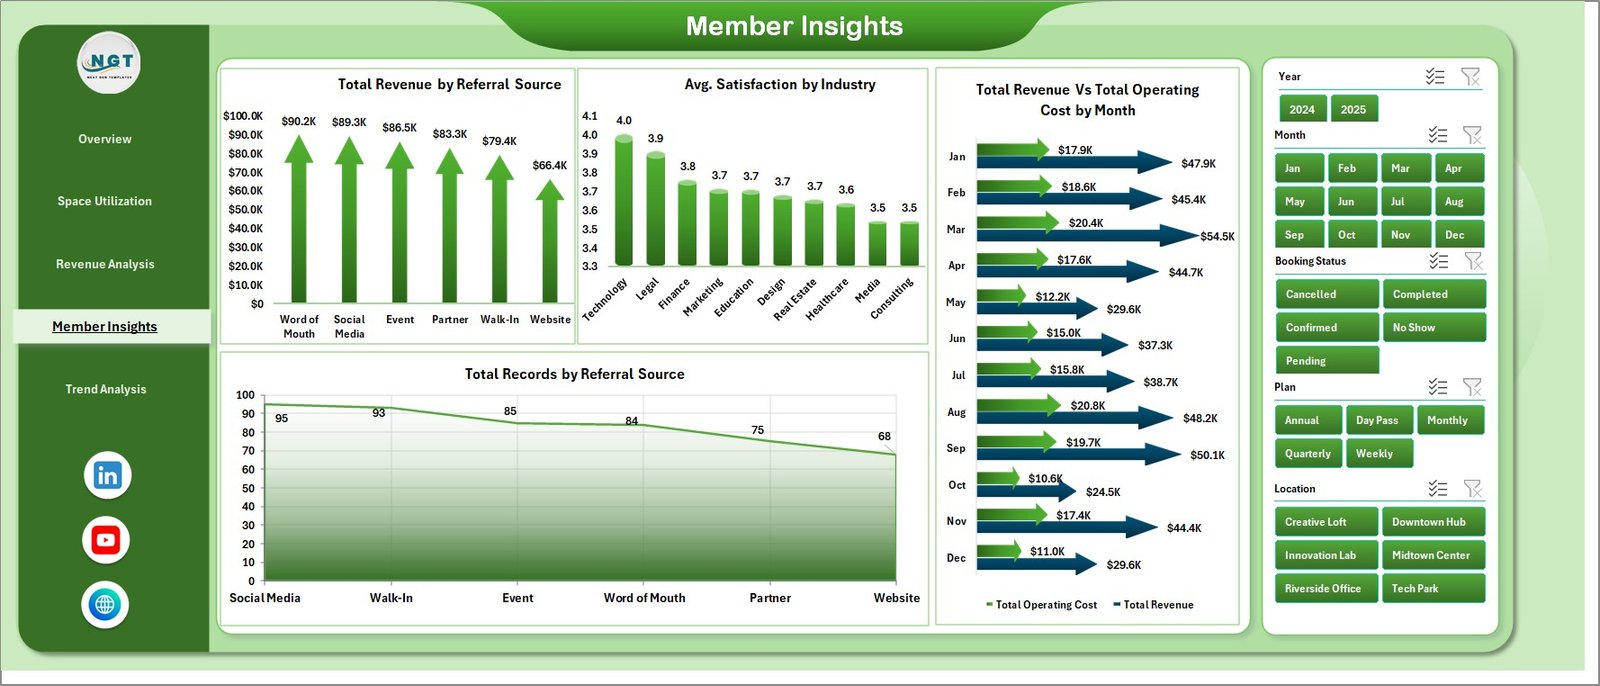
Analyzes acquisition quality and satisfaction. Charts include Total Revenue by Referral Source (which channel pays back), Avg. Satisfaction by Industry (where members feel happiest), Total Revenue Vs Total Operating Cost by Month, and Total Records by Referral Source.
Member Insights
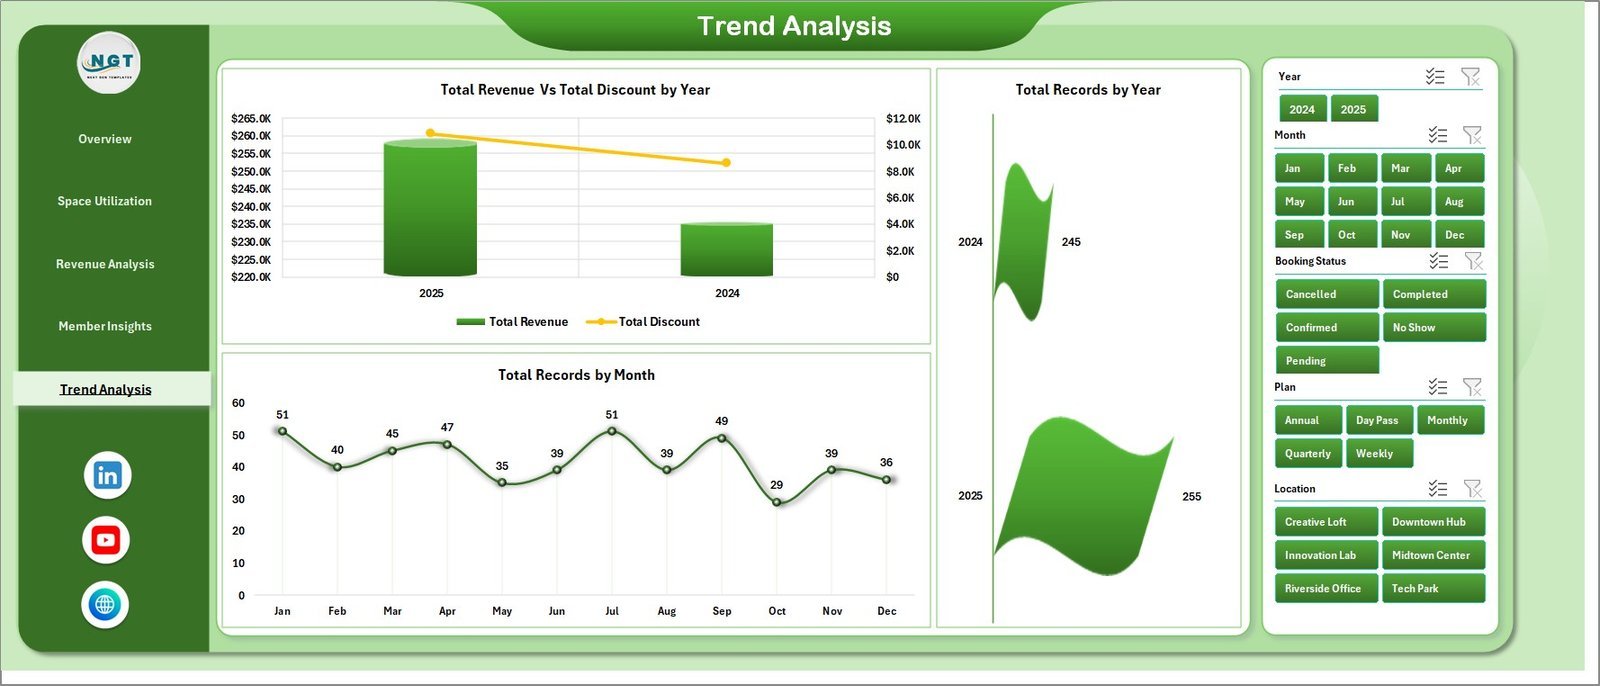
5. Trend Analysis Page
Long-range view for budgeting and forecasting. Charts include Total Revenue Vs Total Discount by Year (discount impact on top line), Total Records by Year (growth trajectory), and Total Records by Month (seasonal curve).

Trend Analysis
6. Data Sheet
The raw data layer. Replace the sample rows with your own booking records in the same column format (Date, Location, Member, Membership Type, Plan, Industry, Referral Source, Payment Status, Duration Hours, Revenue, Operating Cost, Discount, Satisfaction, Capacity).
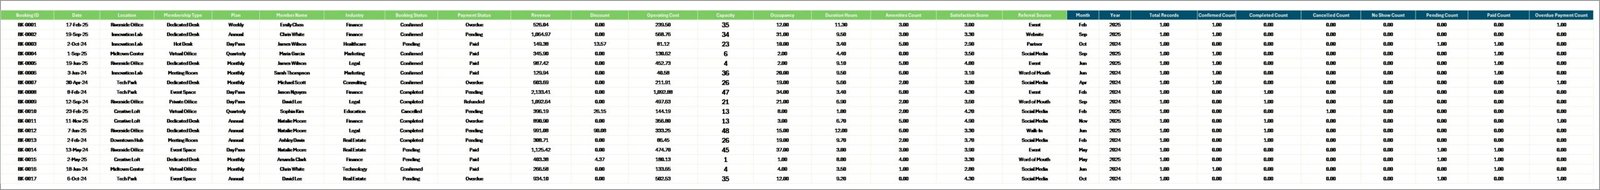
Data Sheet tab
7. Support Sheet
Contains all pivot tables that power the dashboard. After updating the Data Sheet, click Data → Refresh All in the Excel ribbon — every pivot, chart, and KPI updates in one action. This sheet can be hidden from end users.
Support sheet tab
📊 Coworking Space Dashboard in Excel vs. Google Sheets Equivalent vs. Paid Coworking SaaS — Where This Fits
| Feature | Coworking Space Dashboard in Excel | Google Sheets Equivalent | OfficeRnD / Nexudus / Cobot |
|---|---|---|---|
| Cost | $17.99 one-time | $6.99 one-time | $149–$499 / location / month |
| Platform | Microsoft Excel | Google Sheets (browser) | Cloud SaaS (vendor lock-in) |
| Setup time | 10 minutes | 15 minutes | 2–6 weeks onboarding |
| Works offline | ✅ Yes | ❌ Browser only | ❌ Cloud only |
| Real-time team collaboration | ✅ Via OneDrive / SharePoint | ✅ Native | ✅ Native |
| Customizable charts & KPIs | ✅ Unlimited | ✅ Unlimited | ⚠️ Vendor-defined |
| Your data stays with you | ✅ Fully local | ⚠️ Google servers | ❌ Vendor servers |
| Year-1 cost at 3 locations | $17.99 | $6.99 | $5,364–$17,964 |
| Vendor lock-in risk | ❌ None | ⚠️ Low | ✅ High |
For coworking operators that want portfolio-level visibility without paying $5K–$18K a year for SaaS, Coworking Space Dashboard in Excel sits in the sweet spot.
👥 Who This Template Is For — and Who It’s Not For
✅ This template is built for:
- Coworking space founders and owner-operators running 1–10 locations
- Flexible workspace managers tracking occupancy, revenue, and member satisfaction
- Hospitality and real-estate investors analyzing coworking portfolio performance
- Business center and serviced-office managers replacing manual monthly reports
- Consultants and analysts preparing coworking investor decks or quarterly reviews
❌ This template is NOT for:
- Large enterprise chains (50+ locations) needing SSO, SOC 2 compliance, or live API feeds
- Teams that need real-time door-access integration or WiFi-based presence tracking
- Operators who prefer mobile-first, app-native booking and billing tools
⚙️ How to Use the Coworking Space Dashboard in Excel
1️⃣ Download and Unzip — Extract the ZIP file and open Coworking-Space-Dashboard.xlsx in Microsoft Excel (desktop version recommended).
2️⃣ Open the Data Sheet — Navigate to the Data tab and review the column headers. Keep the exact format (dates, numeric fields, text lists).
3️⃣ Replace Sample Data — Delete the sample rows and paste your own booking, membership, and revenue records. Add as many rows as needed.
4️⃣ Refresh Pivots — Click Data → Refresh All in the Excel ribbon. Every pivot, chart, slicer, and KPI card on all 5 analysis pages updates automatically.
5️⃣ Apply Slicers and Analyze — Use the 7 slicers on each page to filter by Location, Membership Type, Plan, Industry, Referral Source, Payment Status, and Year. Export any page as PDF for monthly reports.
💼 Real-World Use Cases
Priya operates three coworking hubs in Bangalore, Mumbai, and Pune. She uses the Coworking Space Dashboard in Excel every month-end to compare revenue versus operating cost by location, spot which branch is leaking margin, and present a 5-page PDF to her investors — without paying ₹12,000 per location per month for OfficeRnD.
Marcus runs a 40-desk boutique coworking space in Berlin. He uses the Member Insights page to track which referral source — Instagram ads, LinkedIn, or walk-ins — delivers the highest-paying members, then doubles down on the channel with the best revenue-to-cost ratio.
Lena is a real-estate asset manager overseeing a mixed-use building. She uses the Trend Analysis page to present year-over-year revenue and discount impact to the building owner, replacing a $299/month dashboard tool she was using before.
❓ Frequently Asked Questions
What KPIs does the Coworking Space Dashboard in Excel track?
The Coworking Space Dashboard in Excel tracks 5 headline KPIs on the Overview page — Total Revenue, Net Profit, Total Records, Average Satisfaction, and Average Duration Hours — plus 15+ supporting charts across Space Utilization, Revenue Analysis, Member Insights, and Trend Analysis pages.
How long does setup take?
Setup takes about 10 minutes for most coworking operators. Download the file, paste your booking data into the Data Sheet in the same column format, and click Data → Refresh All — every chart and KPI in the Coworking Space Dashboard in Excel updates instantly.
How does this compare to OfficeRnD or Nexudus?
The Coworking Space Dashboard in Excel is a $17.99 one-time purchase, while OfficeRnD and Nexudus charge $149–$499 per location per month. For 3 locations, the Excel template saves you $5,364–$17,964 in year one. The trade-off is no real-time door-access or API integrations.
Can I track multiple locations in this dashboard?
Yes. The Location slicer on every page lets you filter the Coworking Space Dashboard in Excel from portfolio-wide totals down to a single location, and the Revenue vs Operating Cost by Location chart exposes which branch drags margin.
Do I need to know Excel formulas or VBA?
No. The Coworking Space Dashboard in Excel is pivot-driven, not formula-driven. All you need to know is how to paste data and click Data → Refresh All. If you can use basic Excel, you can run this dashboard.
Will this template work in Excel for Mac or Excel Online?
Yes. The Coworking Space Dashboard in Excel runs on Excel for Windows, Excel for Mac, and Excel Online (Microsoft 365). Pivot tables and slicers are supported on all three. Excel desktop delivers the smoothest slicer experience.
Can I customize the charts and add my own KPIs?
Absolutely. Since the Coworking Space Dashboard in Excel uses standard Excel pivot tables, you can add columns to the Data Sheet, create new pivots on the Support Sheet, and insert new charts on any analysis page without touching code or scripts.
👤 About the Author
Built by PK — Microsoft Certified Professional with 15+ years of Excel, Google Sheets, and Power BI experience. Founder of NextGenTemplates, reaching 300K+ subscribers across YouTube channels (@PK-AnExcelExpert, @NextGenTemplates, @NeoTechNavigators). Every template is hand-built and tested before release.
🔗 Explore Related Templates
💡 Also available on other platforms and for adjacent use cases:
- Co-working Space KPI Dashboard in Excel — MTD/YTD KPI scorecard version for operators who want target vs actual tracking.
- Space Utilization Dashboard in Google Sheets — Google Sheets alternative for teams on Google Workspace.
- Office Space Utilization Report in Excel — For corporate offices tracking meeting room and desk occupancy.
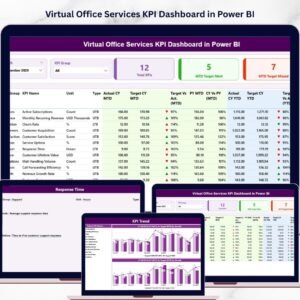
- Virtual Office Services KPI Dashboard in Power BI — Power BI version for virtual office and serviced-office providers.
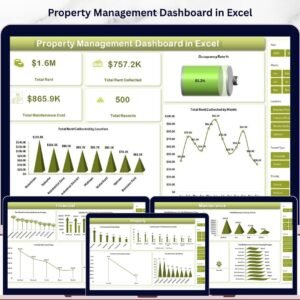
- Property Management Dashboard in Excel — For landlords managing multi-tenant commercial properties.
- Browse more in the Excel Dashboard category.
📖 Click here to read the Detailed Blog Post
🎥 Visit our YouTube channel for step-by-step video tutorials
👉 YouTube.com/@NextGenTemplates
📅 Last updated: April 2026


Reviews
There are no reviews yet.