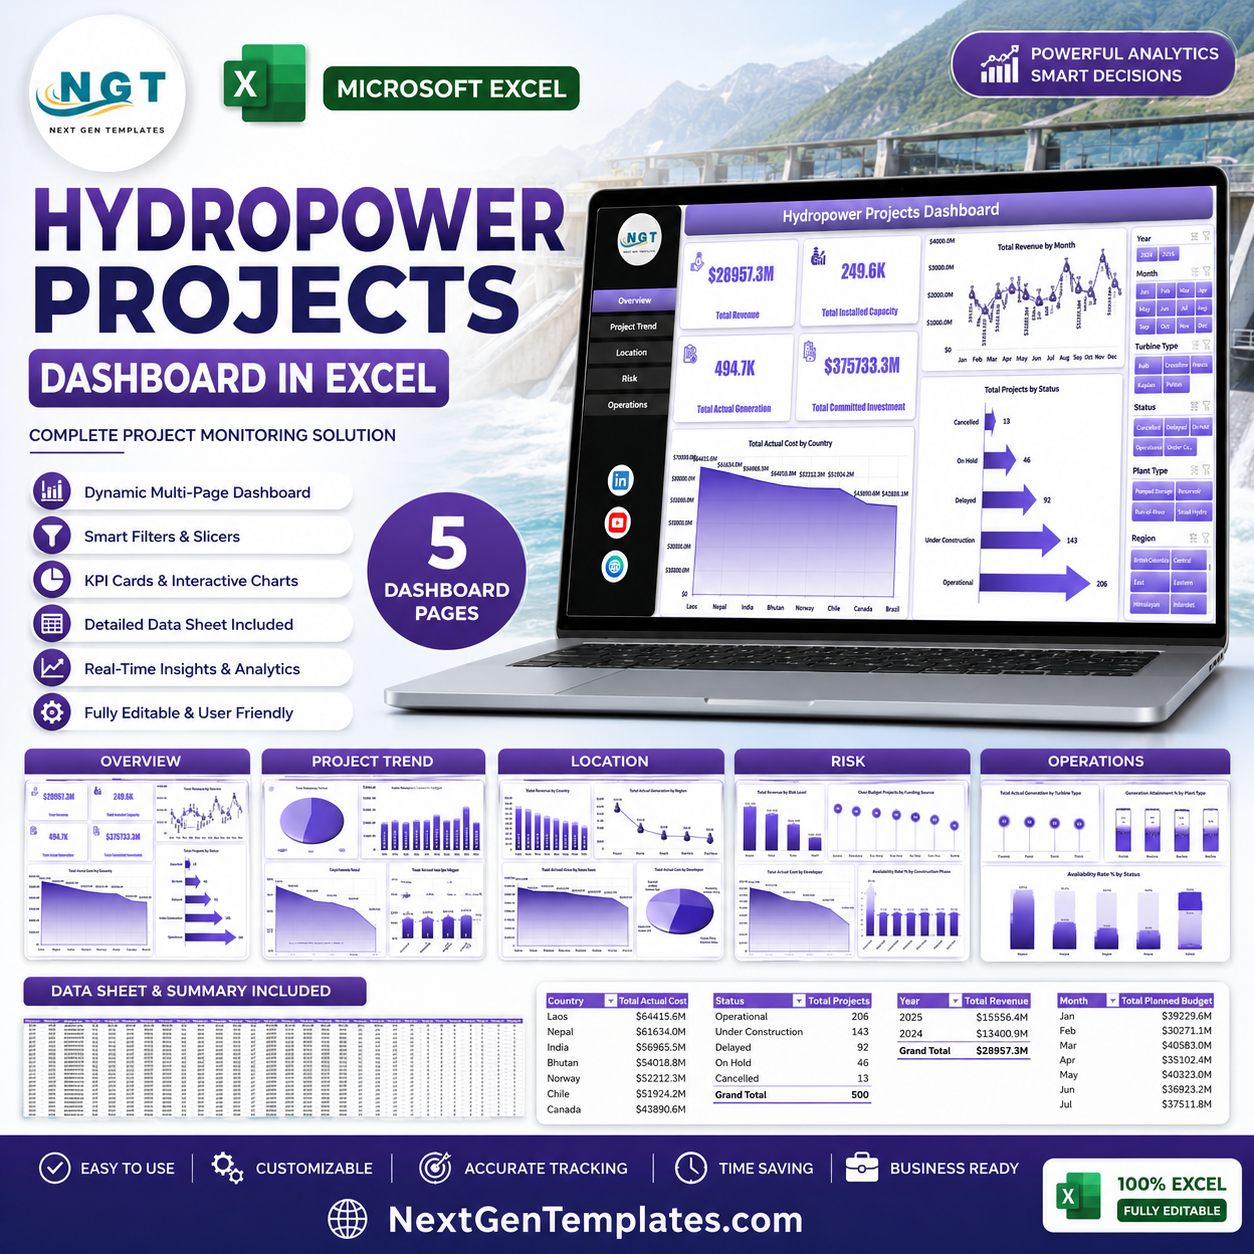
Hydropower Projects Dashboard in Excel gives project managers, developers, energy analysts, operations teams, finance reviewers, and infrastructure leaders a ready-to-use workbook for tracking revenue, installed capacity, actual generation, committed investment, planned budget, actual cost, construction phase, project status, plant type, risk level, funding source, turbine type, region, country, developer, and river basin. Hydropower projects often involve long timelines, high capital investment, multiple contractors, and strict generation targets, so a structured Excel dashboard can reduce reporting delays and help teams catch budget, risk, and operational issues earlier.
Add your project records to the Data sheet, keep the same format, click Refresh All from the Excel Data ribbon, and review multiple dashboard pages with KPI cards, slicers, pivot charts, and supporting pivot tables. This is a one-time downloadable Excel template from NextGenTemplates, so there is no recurring SaaS subscription.
Key Features of Hydropower Projects Dashboard in Excel
- 7 worksheet structure covering Overview, Project Trend, Location, Risk, Operations, Data, and Support sheets.
- 4 executive cards for Total Revenue, Total Installed Capacity, Total Actual Generation, and Total Committed Investment.
- Interactive slicers to filter hydropower project analysis quickly by available project, location, status, phase, developer, risk, and operating fields.
- Pivot-driven charts for revenue, cost, projects, generation, budget, investment, risk, plant type, turbine type, and availability analysis.
- Editable Data sheet for replacing sample records in the same structure.
- Support sheet with pivot tables that can be refreshed and hidden after setup.
- Excel-first workflow for teams that already manage project records in spreadsheets.
What’s Inside the Hydropower Projects Dashboard in Excel
1. Overview Page
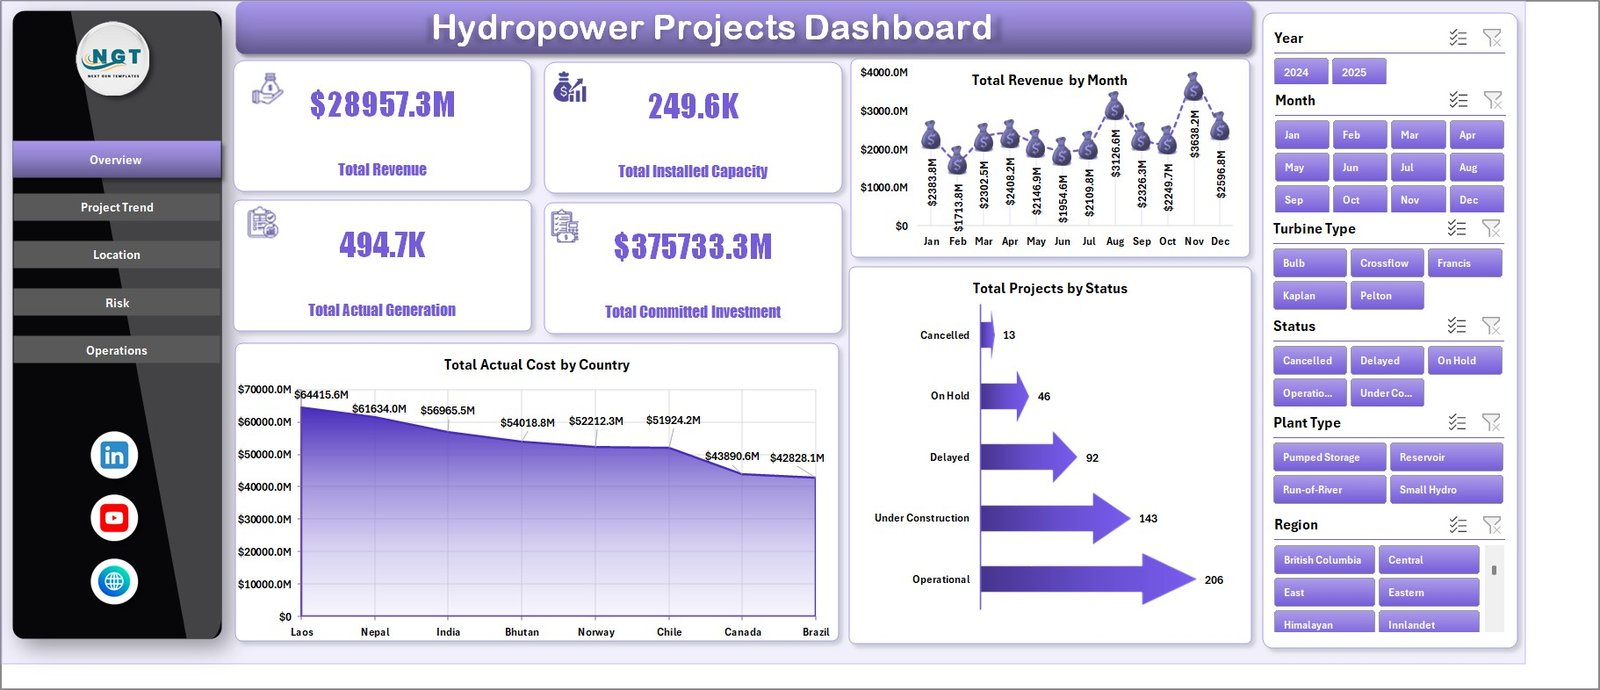
The Overview page gives leaders a fast portfolio snapshot. Cards show Total Revenue, Total Installed Capacity, Total Actual Generation, and Total Committed Investment so users can see commercial scale, capacity, output, and investment in one view.
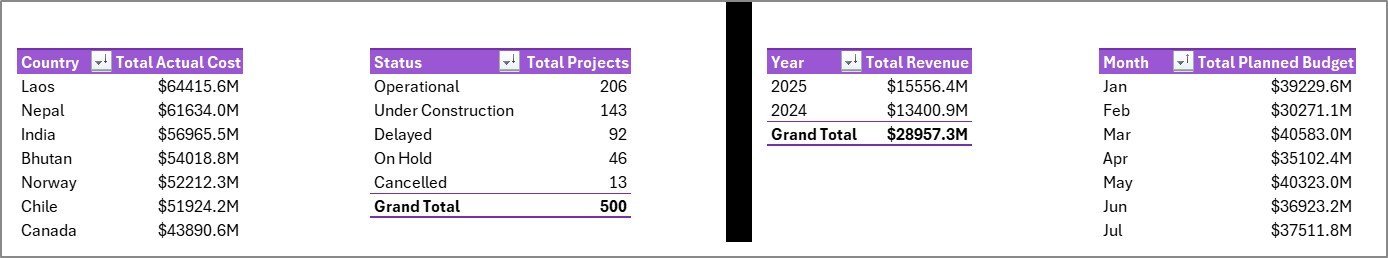
Total Revenue by Month shows monthly revenue movement and helps teams identify strong or weak reporting periods. Total Actual Cost by Country compares cost exposure across countries and supports location-level budget discussion. Total Projects by Status shows how projects are distributed across active, delayed, completed, or other status groups.
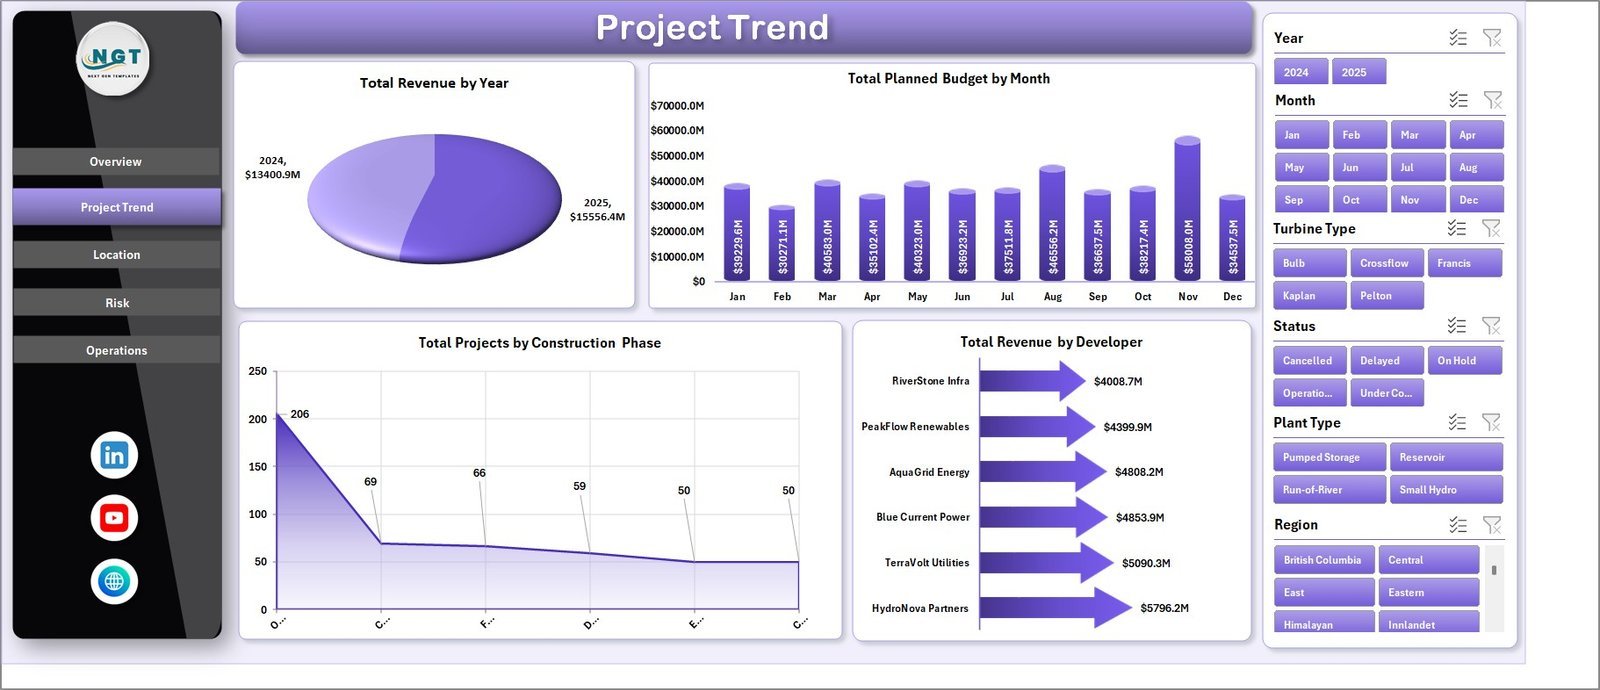
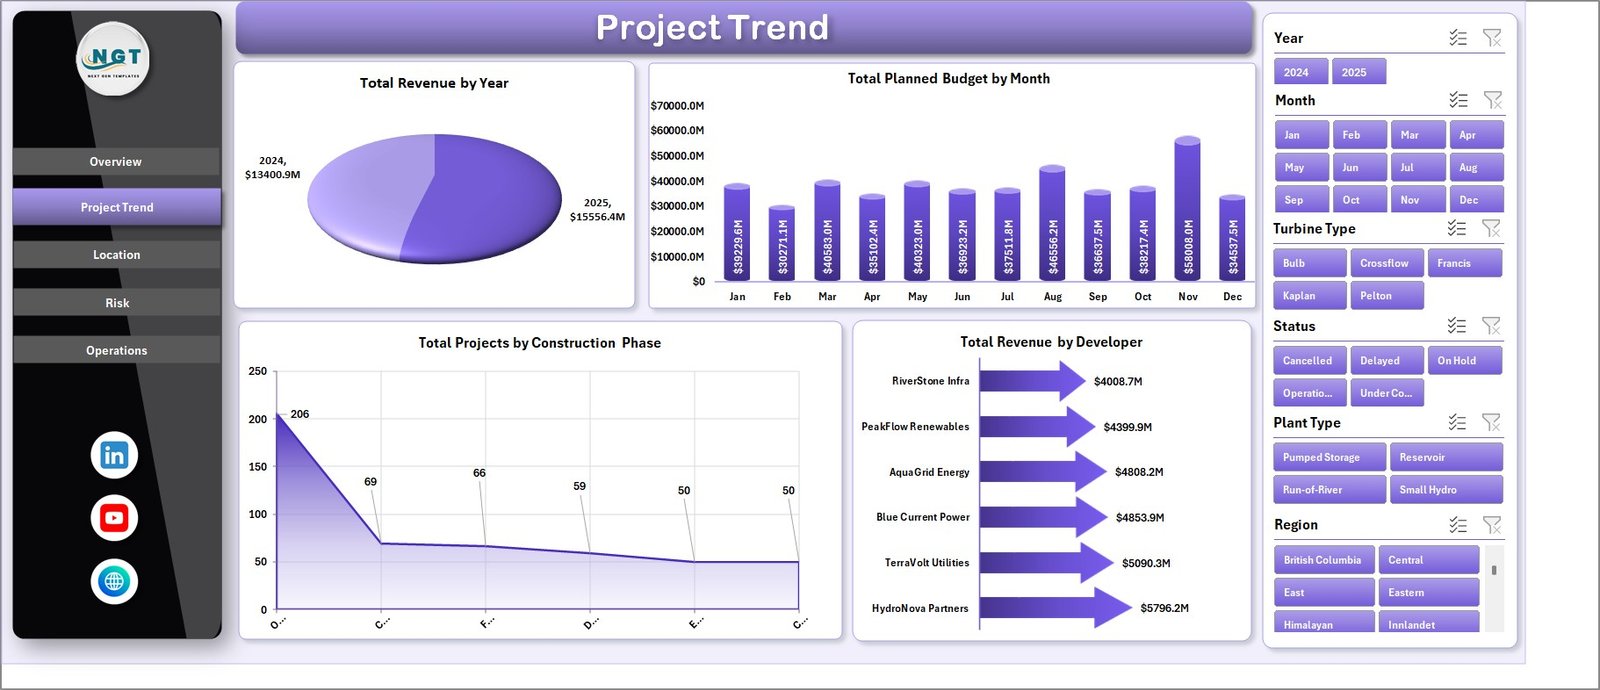
2. Project Trend
Total Revenue by Year compares longer-term revenue movement across the portfolio. Total Planned Budget by Month shows how planned spending changes during the year. Total Projects by Construction Phase helps teams see where projects sit in the delivery pipeline. Total Revenue by Developer compares developer-level contribution.
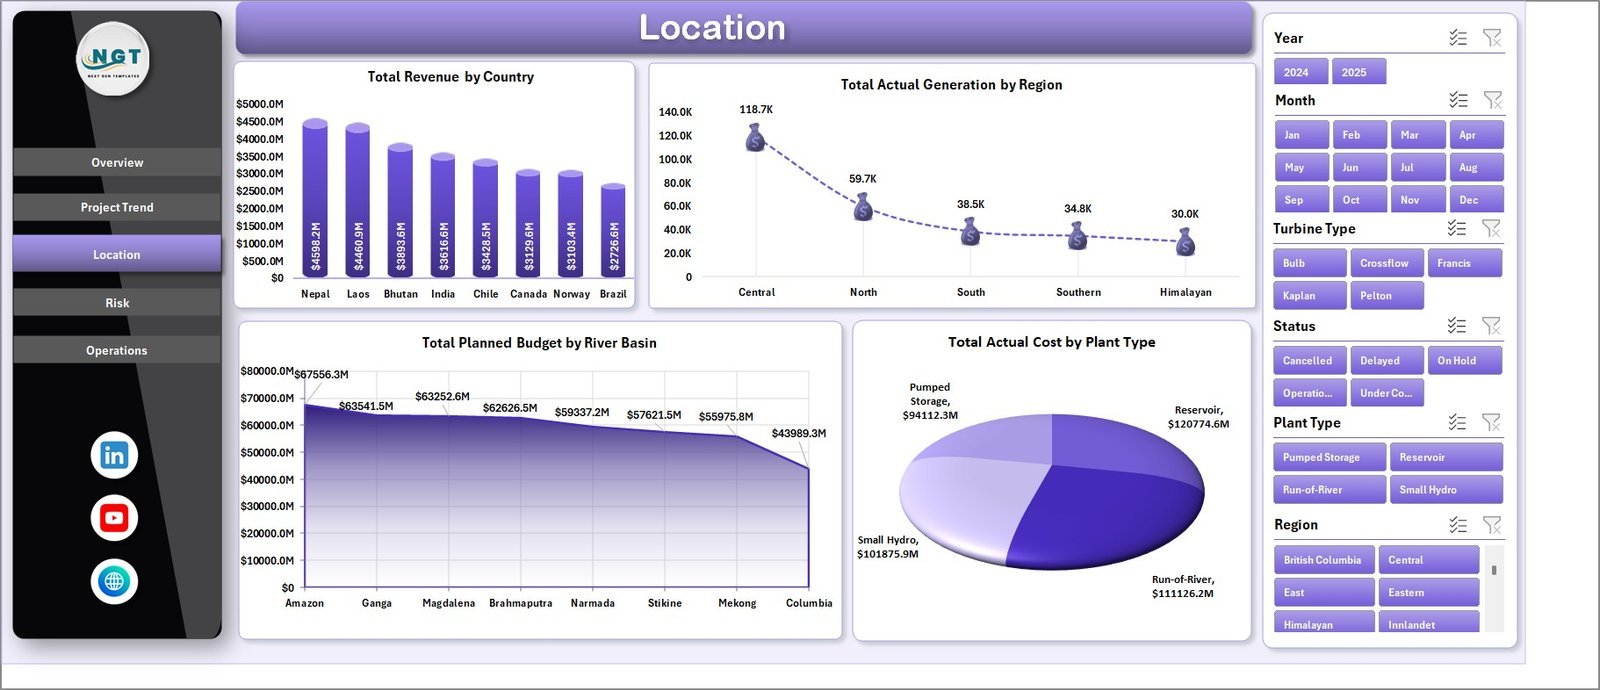
3. Location
Total Revenue by Country identifies markets producing the most revenue. Total Actual Generation by Region compares energy generation by operating region. Total Planned Budget by River Basin supports basin-level planning and investment review. Total Actual Cost by Plant Type explains cost patterns across plant categories.

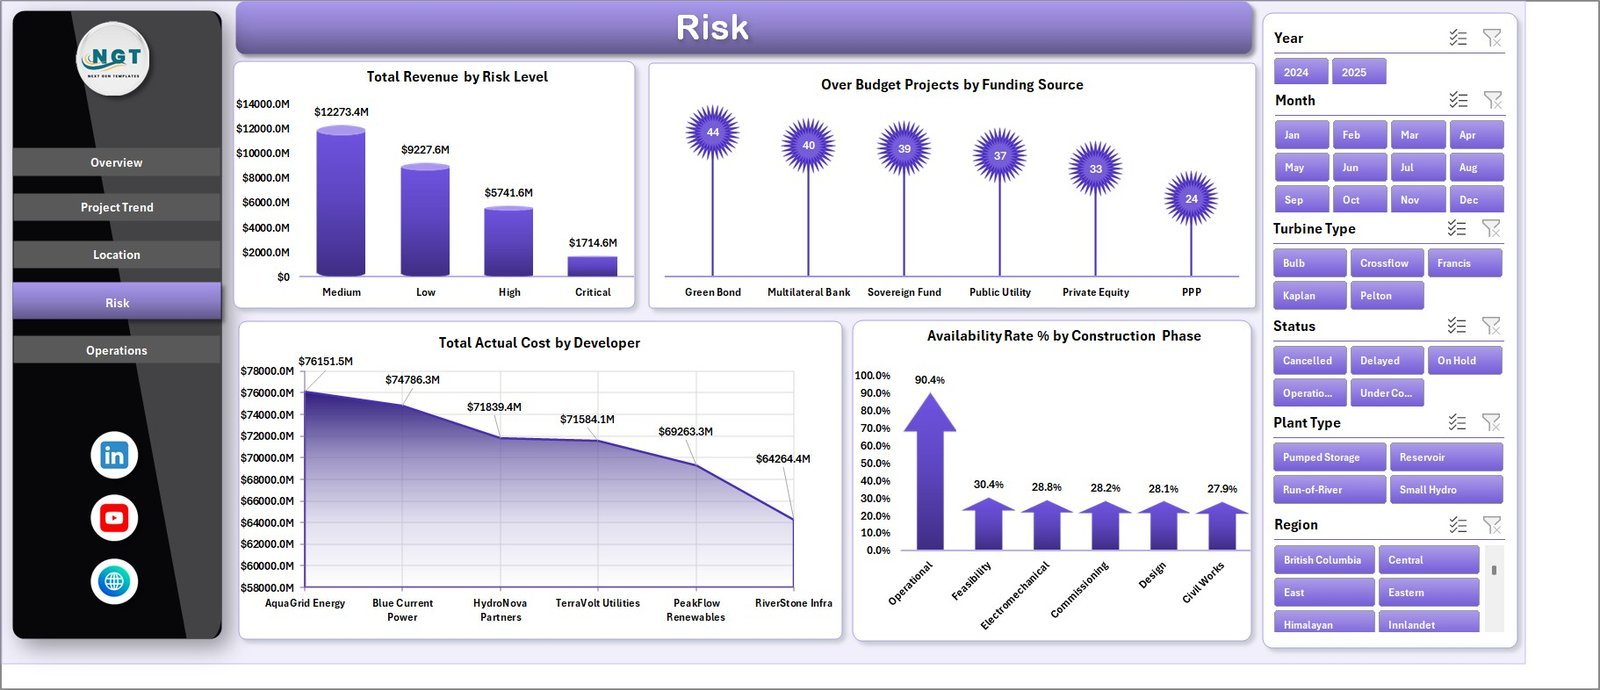
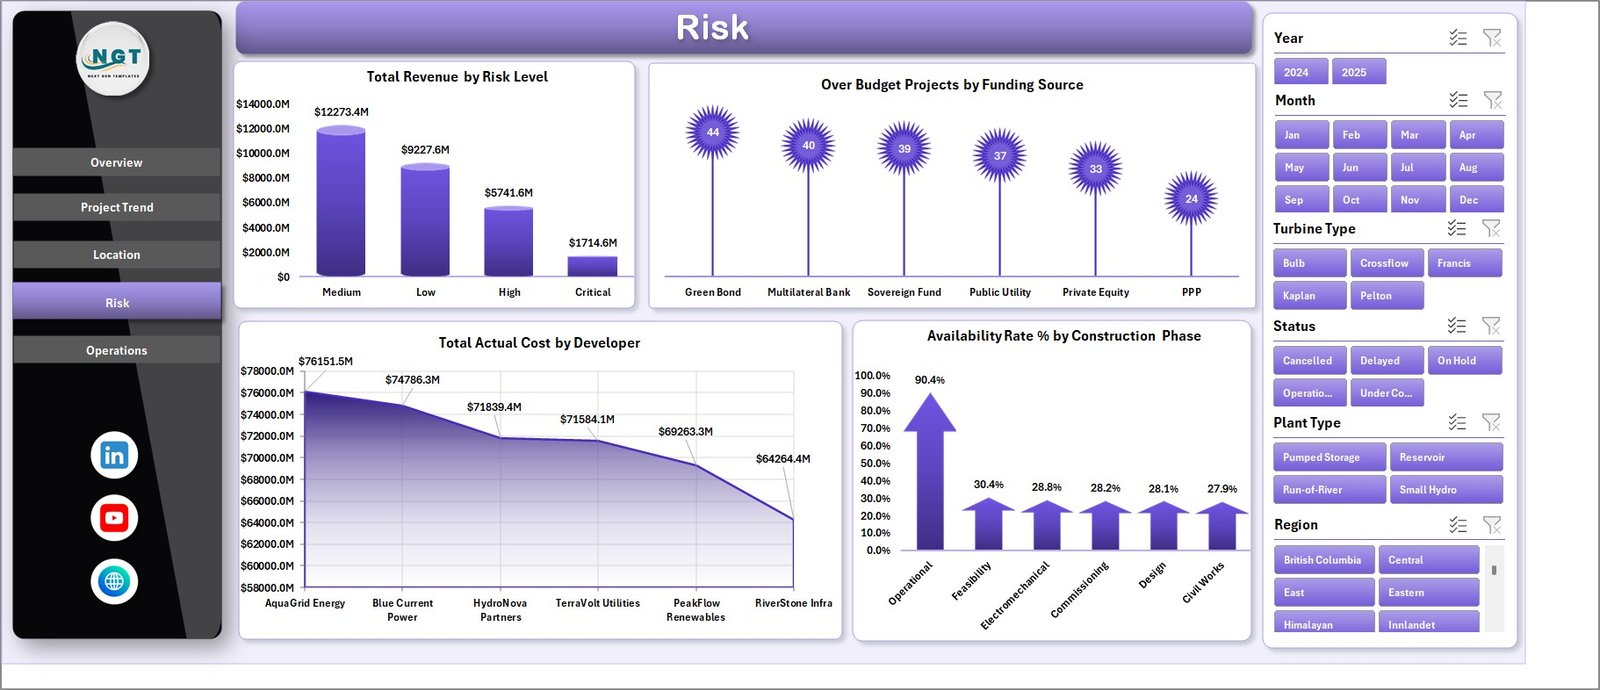
4. Risk
Total Revenue by Risk Level helps teams understand how much revenue is tied to each risk category. Over Budget Projects by Funding Source shows where funding groups may need closer cost control. Total Actual Cost by Developer compares developer-level cost exposure. Availability Rate % by Construction Phase connects project stage with operational readiness or availability trends.
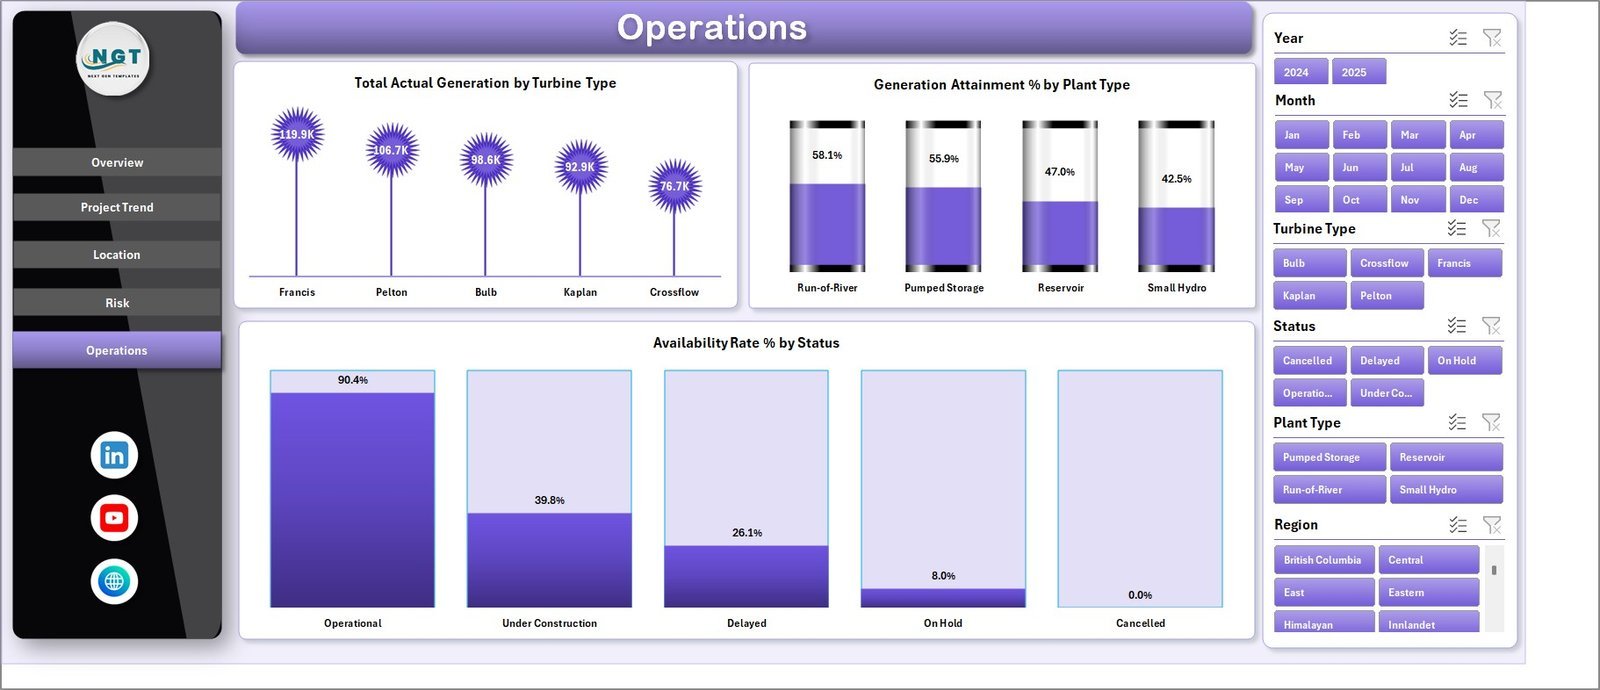
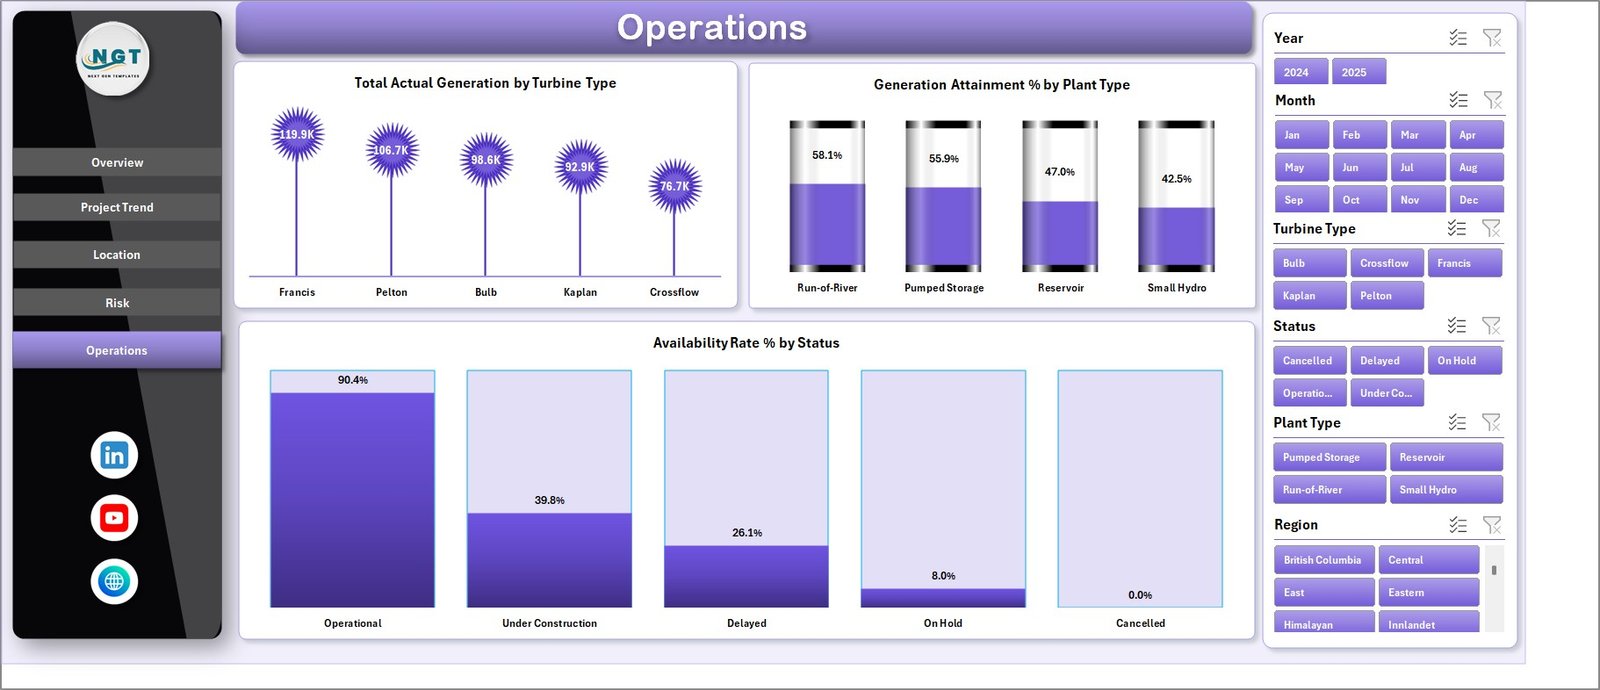
5. Operations
Total Actual Generation by Turbine Type shows which turbine groups contribute the most output. Generation Attainment % by Plant Type compares actual performance against expected generation by plant type. Availability Rate % by Status helps operations teams connect project or plant status with availability performance.
6. Data Sheet Tab
The Data sheet is where users add or replace hydropower project records in the same format. Keep dates, countries, regions, river basins, developers, statuses, phases, plant types, turbine types, cost, revenue, generation, and budget fields consistent so pivots and slicers refresh correctly.

7. Support Sheet Tab
The Support sheet contains the pivot tables used to create the dashboard dynamically. After updating the Data sheet, go to the Data tab in the Excel Ribbon and click Refresh All. The pivots and charts refresh together, and the Support sheet can remain hidden for everyday users.

Hydropower Projects Dashboard in Excel vs. Google Sheets vs. Paid Project SaaS – Where This Fits
| Feature | This Excel dashboard | Google Sheets alternative | Paid project SaaS |
|---|---|---|---|
| Cost | $17.99 one-time | Low cost, usually self-built | Monthly or annual subscription |
| Platform | Microsoft Excel | Browser-based spreadsheet | Vendor cloud system |
| Setup time | Replace data and refresh | Build formulas, charts, and filters manually | Configuration and onboarding |
| Customizable fields | Editable workbook, pivots, charts, and sheets | Editable with permissions | Limited by vendor setup |
| Year-1 cost at 5 users | $17.99 plus Excel already used | Low if self-managed | Often hundreds or thousands |
| Hydropower project analysis | Built in across multiple tabs | Must be built manually | Depends on module |
Who This Template Is For – and Who It’s Not For
This template is for hydropower project managers, renewable energy analysts, EPC teams, developers, finance controllers, operations managers, investment teams, and consultants who need a practical Excel reporting layer for project and plant performance.
It is not a live SCADA system, engineering design tool, financial close platform, document management system, or automated regulatory reporting portal. It works best when you already have structured project data and want a clean Excel dashboard for recurring review.
How to Use the Hydropower Projects Dashboard in Excel
- Download and unzip the product file.
- Open the workbook in Microsoft Excel.
- Replace the sample records in the Data sheet using the same column structure.
- Go to the Data tab in the Excel Ribbon and click Refresh All.
- Use slicers to filter Overview, Project Trend, Location, Risk, and Operations pages.
- Hide the Support sheet after setup if everyday users do not need to see pivot tables.
Real-World Use Cases
Arjun, Hydropower Project Manager: reviews revenue, installed capacity, project status, and construction phase before monthly steering committee meetings.
Meera, Renewable Energy Analyst: compares generation by region, turbine type, plant type, and river basin to prepare performance commentary.
Daniel, Infrastructure Finance Lead: monitors planned budget, actual cost, committed investment, and over-budget projects by funding source.
Frequently Asked Questions
What does this hydropower dashboard track?
It tracks revenue, installed capacity, actual generation, committed investment, actual cost, planned budget, project status, construction phase, developer, country, region, river basin, plant type, turbine type, risk level, funding source, availability rate, and generation attainment.
Can I replace the sample data?
Yes. Add or replace records in the Data sheet, keep the same format, then click Refresh All so pivots, cards, charts, and slicers update.
Does this workbook require macros?
No macro workflow is required for normal dashboard use. The dashboard is built with Excel data, pivot tables, charts, slicers, and refresh logic.
Can I customize the dashboard?
Yes. You can edit fields, pivots, charts, slicers, colors, labels, and worksheet layouts inside Excel.
Is this a subscription?
No. It is a one-time downloadable Excel dashboard template from NextGenTemplates.
About the Author
Built by PK – Microsoft Certified Professional with 15+ years of Excel, Google Sheets, and Power BI experience. Founder of NextGenTemplates, reaching 300K+ subscribers across YouTube channels. Every template is hand-built and tested before release.
Explore Related Templates
Read the detailed blog post for Hydropower Projects Dashboard in Excel. Explore more MS Excel templates and Excel Dashboard templates. You may also like the Hydropower Projects KPI Dashboard in Excel, Hydropower Projects KPI Dashboard in Power BI, and Energy ESG Sustainability Bundle.
Download the
Watch the step-by-step video tutorial:
rel=”noopener”>Hydropower Projects Dashboard in Excel
and start reviewing revenue, cost, generation, risk, location, and operations performance in one refreshable workbook.
Last updated: June 20, 2026.


Reviews
There are no reviews yet.