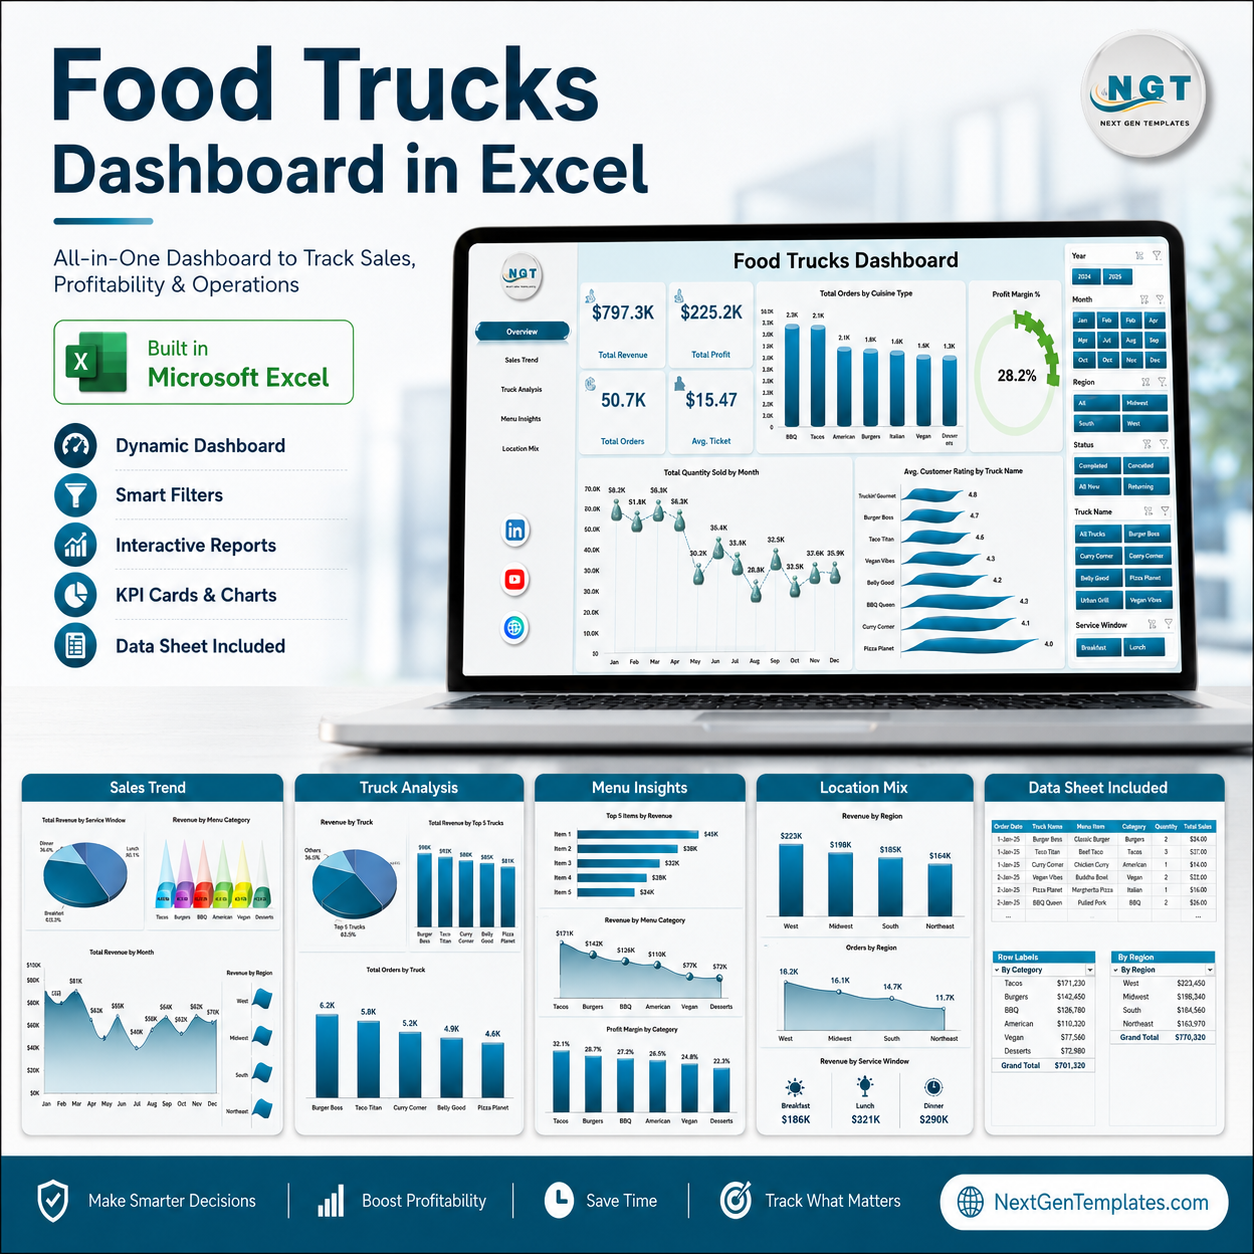


Food Trucks Dashboard in Excel helps food truck owners, fleet operators, and mobile food managers track revenue, orders, operating cost, average ticket, and customer rating from one pivot-driven Excel workbook. The template includes 5 dashboard pages, a data sheet, a support sheet, 15+ ready-to-use charts, and slicers for fast filtering. Join 8,400+ teams in 40+ countries using NextGenTemplates for one-time-purchase dashboard templates. Instant download, no subscription, no per-user fees, and lifetime access.
Key Features of Food Trucks Dashboard in Excel
- 5 analysis pages: Overview, Sales Trend, Truck Analysis, Menu Insights, and Location Mix cover the most important food truck business questions.
- 5 headline cards: Track Total Revenue, Total Orders, Total Operating Cost, Average Ticket, and Average Customer Rating.
- Pivot-driven charts: Analyze profit, orders, operating cost, cuisine, event type, truck name, city, payment method, and region.
- Excel slicers: Filter the dashboard quickly by business dimensions such as month, region, truck, cuisine, and event type.
- Editable data sheet: Replace the sample rows with your own food truck records and refresh the workbook.
- No VBA required: Built with Excel tables, pivot tables, charts, slicers, and formulas.
- One-time purchase: Pay once and use the workbook as often as needed.
What’s Inside the Food Trucks Dashboard in Excel
1. Overview Page
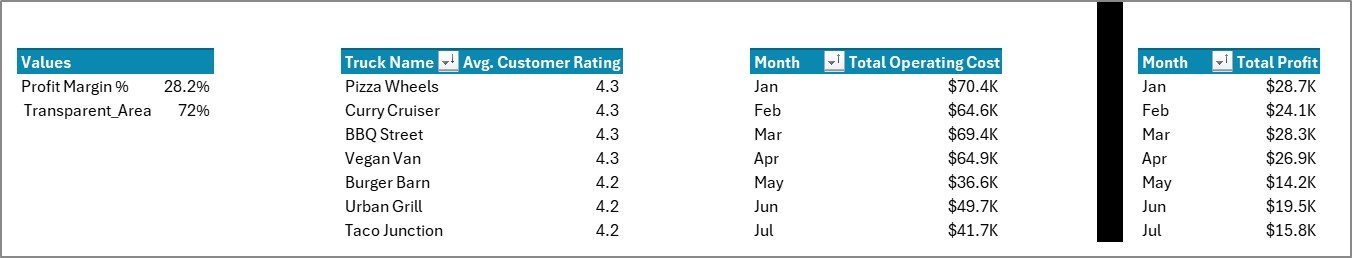
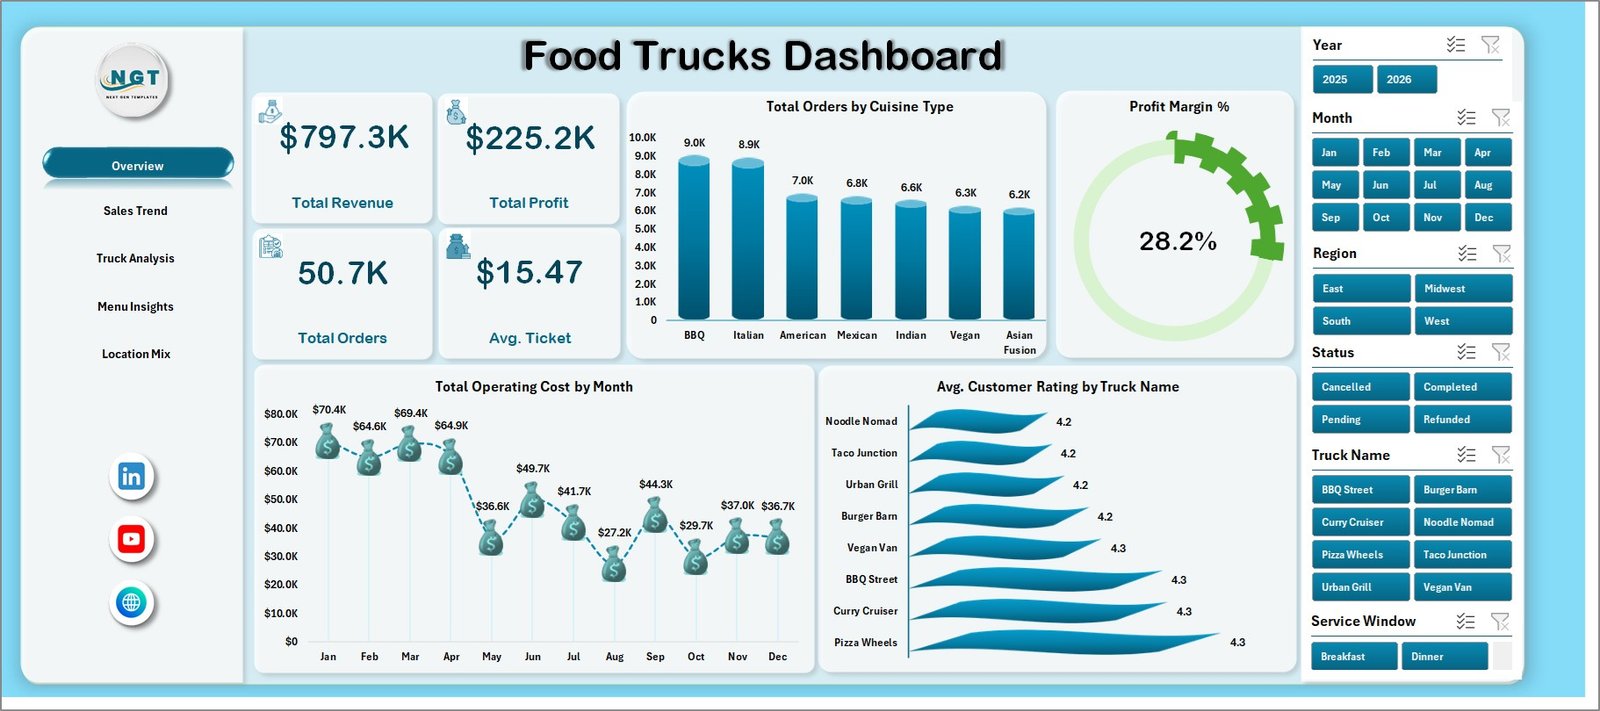
The Overview page gives a high-level view of food truck performance. The top cards show Total Revenue, Total Orders, Total Operating Cost, Average Ticket, and Average Customer Rating, so managers can review sales volume, cost pressure, customer experience, and order value in one place.
The Total Profit by Region chart compares profitability across operating regions and helps identify where route planning or event selection is working best. Total Orders by Cuisine Type shows which cuisines attract the most demand, while Total Operating Cost by Month Name highlights seasonal cost movement and months that need closer margin control.
Food Trucks Dashboard in Excel
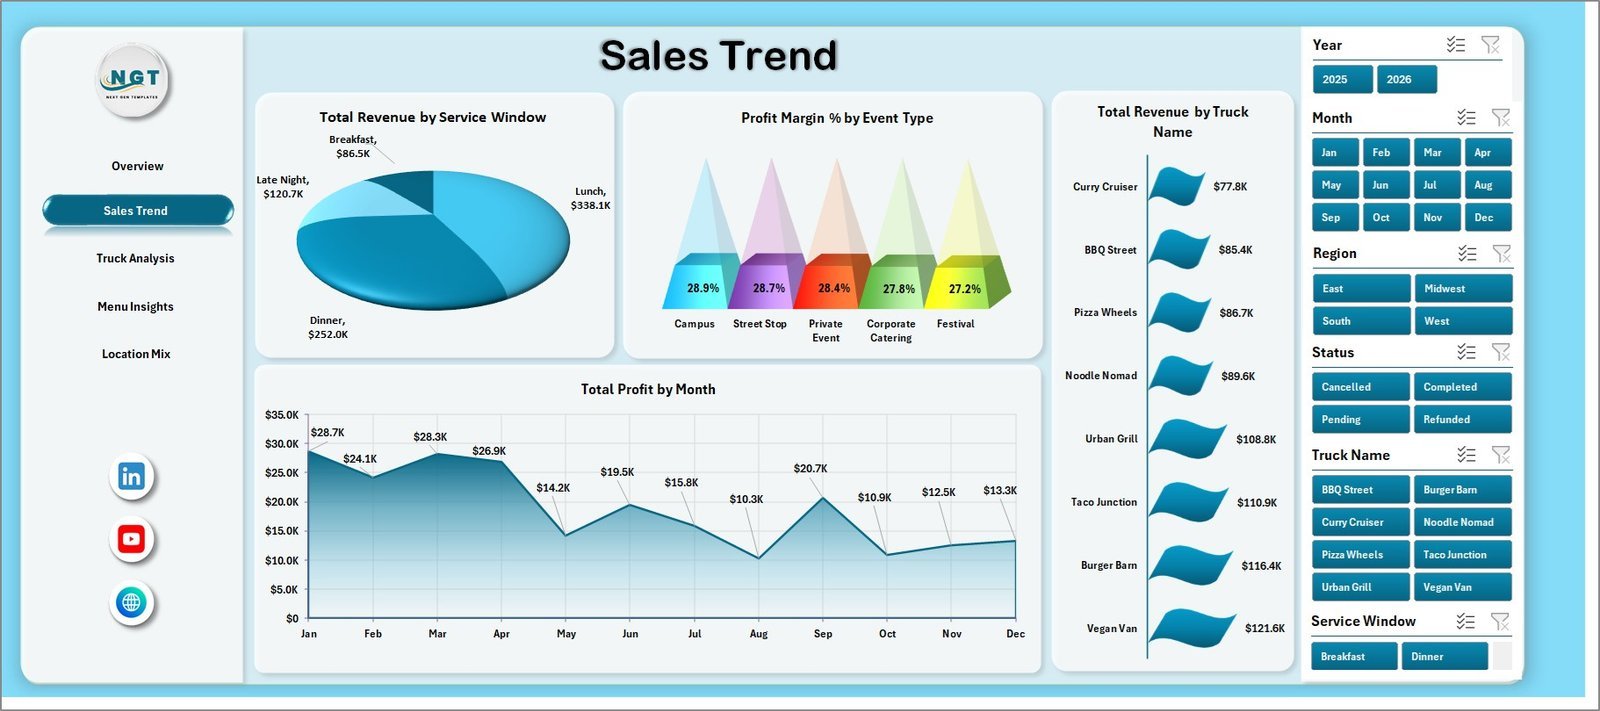
2. Sales Trend
The Sales Trend page focuses on margin and revenue timing. Profit Margin by Event Type shows which event formats produce stronger returns after cost, helping owners prioritize festivals, corporate bookings, markets, or private events.
Total Revenue by Service Window compares revenue by selling window, making it easier to understand lunch, dinner, late-night, or event-based demand. Total Profit by Month Name shows month-by-month profit movement for planning staffing, inventory, promotions, and route schedules.

Sales Trend
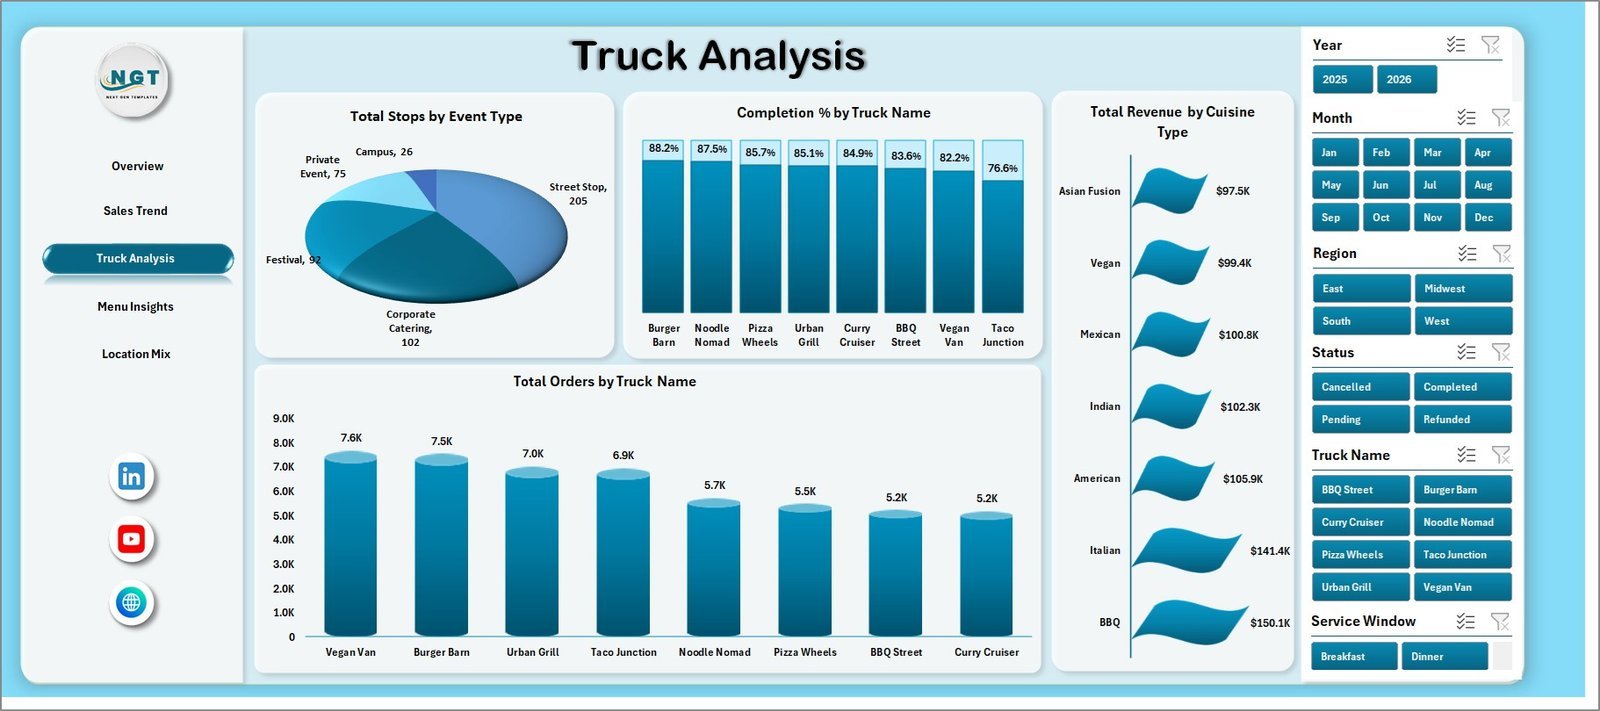
3. Truck Analysis
The Truck Analysis page compares business results across trucks, cuisines, and event types. Total Revenue by Event Type shows which event categories bring the most sales for the fleet.
Total Operating Cost by Cuisine Type helps owners see which cuisine lines carry higher cost pressure. Total Orders by Truck Name ranks individual trucks by order volume, making it useful for staffing decisions, maintenance planning, and route allocation.

Truck Analysis
4. Menu Insights
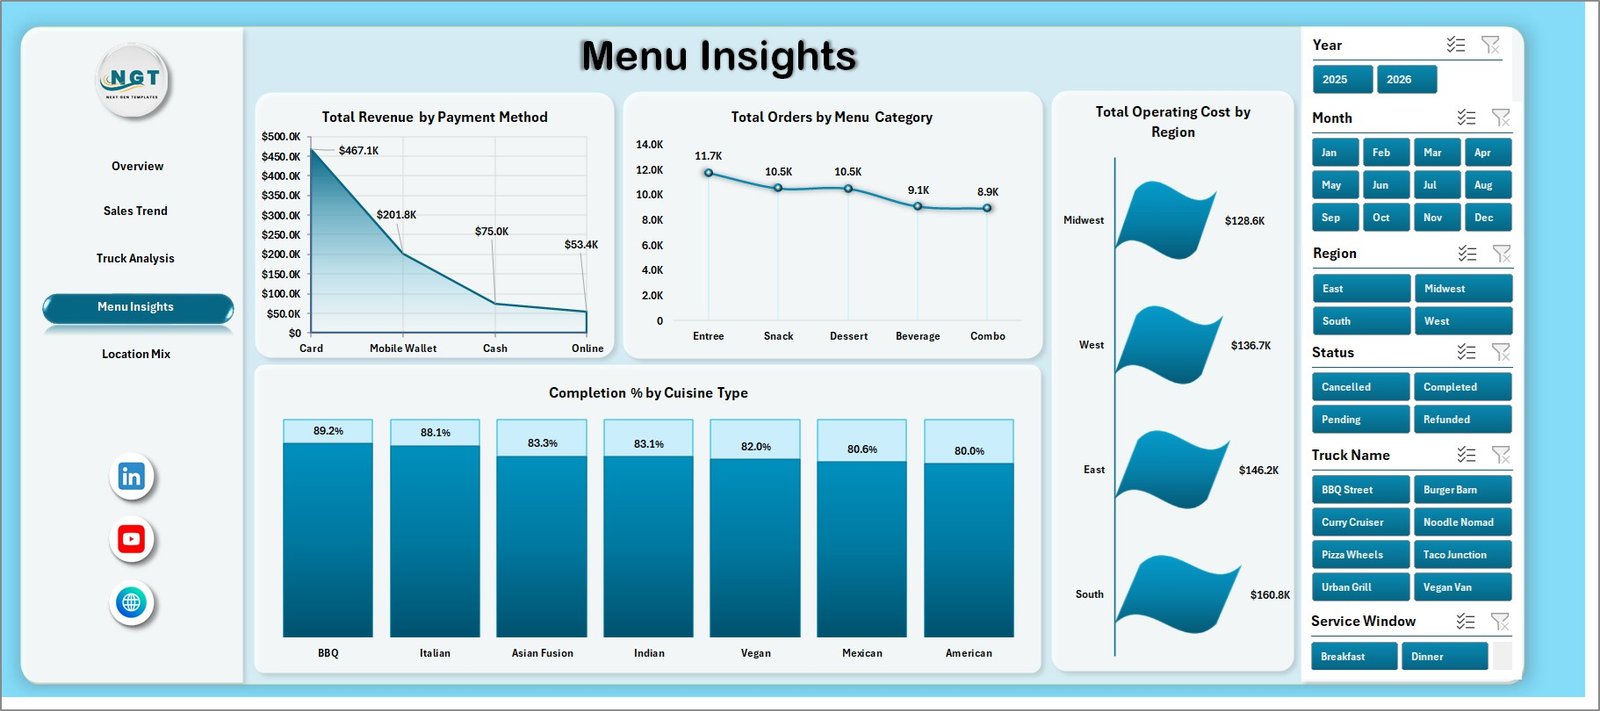
The Menu Insights page helps managers understand what customers buy and how they pay. Total Orders by Menu Category highlights the categories that drive volume, useful for simplifying the menu or preparing inventory.
Total Revenue by Payment Method shows payment mix across cash, card, online, or other methods. Average Customer Rating by Cuisine Type compares customer satisfaction across cuisine styles, helping teams protect quality while growing sales.
Menu Insights
5. Location Mix
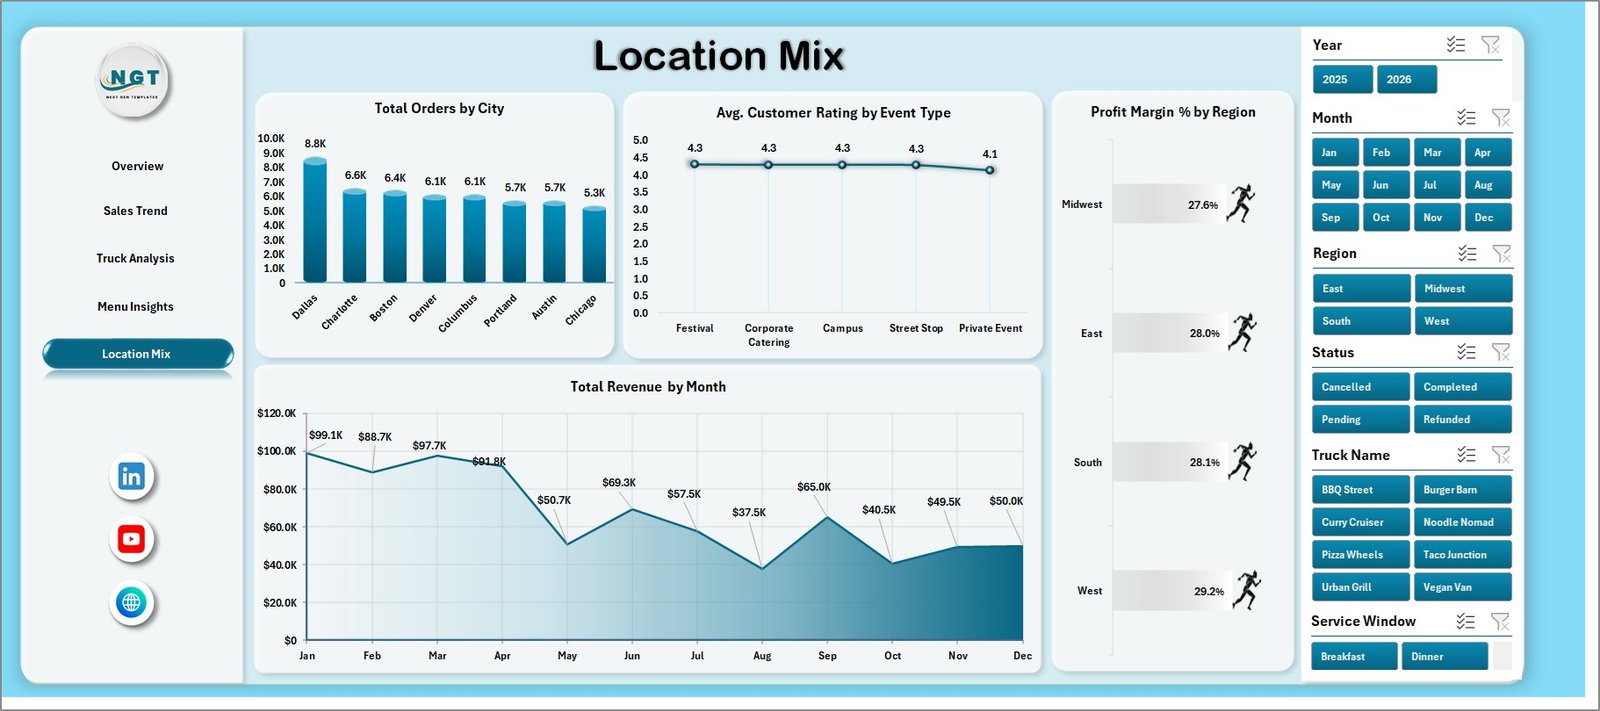
The Location Mix page turns location data into route and market decisions. Average Ticket by Region shows where customers spend more per order and which regions may support premium menu options.
Total Orders by City compares demand by city, helping owners pick better weekly stops. Total Revenue by Month Name adds the time trend needed for monthly sales reviews and seasonal planning.
Location Mix
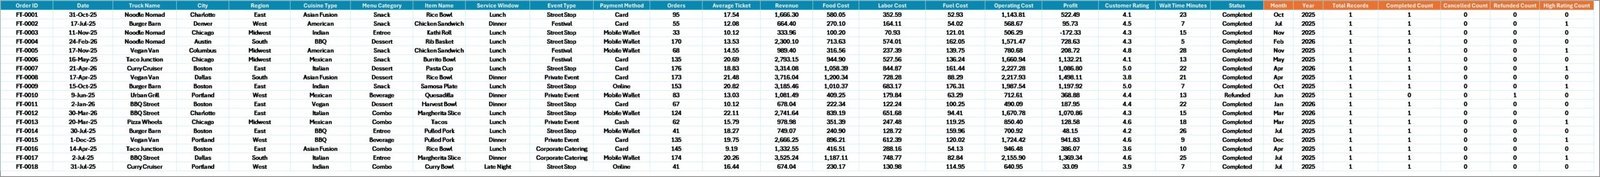
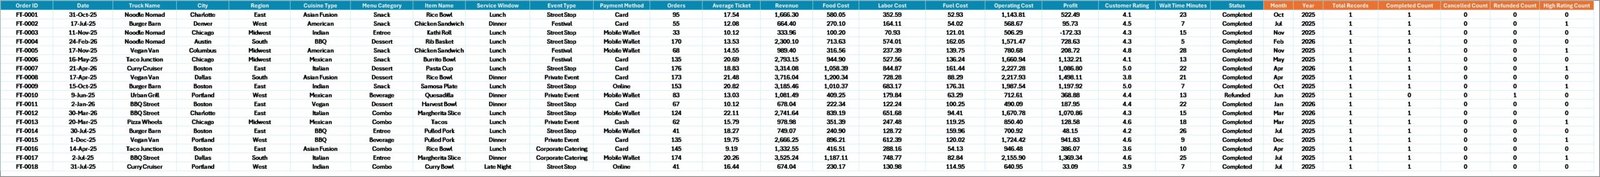
6. Data Sheet
The Data Sheet stores the source records for the workbook. Add or replace rows using the same structure as the sample data, then refresh the workbook so all cards, charts, slicers, and pivot tables update.
Data Sheet tab
7. Support Sheet
The Support sheet contains the pivot tables used to feed the dashboard pages. After updating the Data Sheet, go to the Excel Data tab and click Refresh All. You can keep this sheet hidden during normal use.

Support Sheet tab
Food Trucks Dashboard in Excel vs. Google Sheets vs. Paid Restaurant SaaS – Where This Fits
| Feature | This Excel Dashboard | Google Sheets Alternative | Paid Restaurant SaaS |
|---|---|---|---|
| Cost | $17.99 one-time | One-time or shared spreadsheet | Monthly subscription |
| Platform | Microsoft Excel | Browser-based Google Sheets | Vendor-hosted cloud |
| Setup time | Open workbook, replace data, refresh | Copy sheet and replace data | Onboarding and configuration |
| Real-time team collaboration | Possible with OneDrive | Native sharing | Built in |
| Mobile access | Excel app or browser | Google Sheets app | Vendor app |
| Customizable fields | Editable workbook structure | Editable sheet structure | Limited by plan |
| Share with link | OneDrive or SharePoint | Google Drive link | Built in |
| Food truck route analysis | Built around trucks, regions, cities, events, and cuisine | Possible with setup | Depends on vendor |
| Year-1 cost at 5 users | $17.99 plus Excel access | Template cost plus Google access | Often hundreds or thousands of dollars |
Who This Template Is For – and Who It’s Not For
This template is built for food truck owners, mobile food vendors, street food businesses, event catering teams, regional food truck fleets, and analysts who already use Excel for reporting. It is useful when you want a reusable file for revenue, orders, cost, ratings, menu, truck, event, and location review.
It is not a full POS system, live inventory application, payroll tool, route optimization system, or accounting platform. If you need automatic order syncing, payment processing, barcode inventory, or staff scheduling, use this dashboard as a reporting layer alongside those systems.
How to Use the Food Trucks Dashboard in Excel
- Download and unzip the file after purchase.
- Open the workbook in Microsoft Excel.
- Go to the Data Sheet and replace the sample rows with your own food truck records.
- Keep the same column structure so pivots and charts continue working.
- Click Data > Refresh All in the Excel ribbon.
- Use slicers on the dashboard pages to filter by truck, month, region, cuisine, event type, and other fields.
- Review Overview first, then move into Sales Trend, Truck Analysis, Menu Insights, and Location Mix for deeper analysis.
Real-World Use Cases
Maria, a food truck owner, uses the Overview and Sales Trend pages every Monday to compare revenue, operating cost, and profit by month before planning the next week’s event schedule.
Daniel, a fleet manager, reviews Total Orders by Truck Name to decide which truck should handle high-volume events and which truck needs staffing, menu, or service adjustments.
Aisha, an operations analyst, uses Location Mix to compare orders by city and average ticket by region before recommending new stops for the next quarter.
Frequently Asked Questions
Is this dashboard built in Excel?
Yes. Food Trucks Dashboard in Excel is designed for Microsoft Excel and uses pivot tables, charts, slicers, and a structured data sheet.
Can I replace the sample data?
Yes. Replace the sample rows in the Data Sheet with your own records while keeping the same columns, then click Refresh All.
What KPIs are included?
The Overview page includes Total Revenue, Total Orders, Total Operating Cost, Average Ticket, and Average Customer Rating.
Does it include analysis by truck and location?
Yes. The workbook includes Truck Analysis and Location Mix pages, with visuals by truck name, city, region, event type, and month.
Do I need macros?
No. The dashboard is designed without VBA macros. It uses Excel’s built-in pivots, charts, slicers, and formulas.
Can this replace restaurant software?
It can replace manual reporting for many small teams, but it does not replace POS, accounting, inventory, or staff scheduling software.
About the Author
Built by PK – Microsoft Certified Professional with 15+ years of Excel, Google Sheets, and Power BI experience. Founder of NextGenTemplates, reaching 300K+ subscribers across YouTube channels. Every template is hand-built and tested before release.
Explore Related Templates
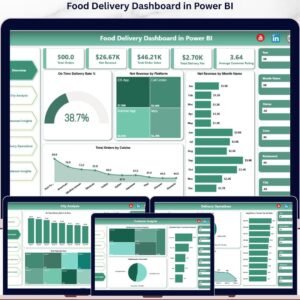
For similar reporting needs, explore Food Truck Dashboard in Excel, Food Truck Dashboard in Power BI, Food Delivery Dashboard in Google Sheets, and Restaurants & Food Services KPI Dashboard in Excel. You can also browse all Excel Dashboard templates.
Download the Food Trucks Dashboard in Excel today and turn truck, menu, city, event, and sales data into a clear operating view.
Last updated: June 14, 2026.


Reviews
There are no reviews yet.