
Concert Promoters Dashboard in Excel gives promoters, venue teams, event agencies, and entertainment finance managers a ready-to-use reporting workbook for monitoring gross revenue, net profit, tickets sold, total expenses, and event activity across multiple concert campaigns. Instead of rebuilding pivot charts after every show, you can paste your updated event data, refresh the workbook, and review seven connected pages built around revenue, event performance, marketing spend, sponsorship, artist insights, raw data, and pivot support. Built by PK, a Microsoft Certified Professional with 15+ years of Excel dashboard experience and 300K+ YouTube subscribers, this template is a practical one-time purchase with editable Excel logic and no monthly SaaS subscription.
Key Features of Concert Promoters Dashboard in Excel
- Multi-page Excel dashboard for overview, revenue analysis, event performance, marketing, sponsorship, and artist insights.
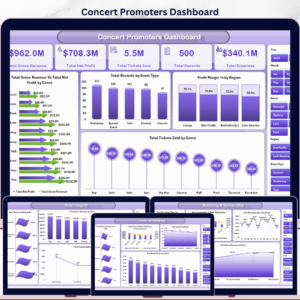
- Executive KPI cards showing Total Gross Revenue, Total Net Profit, Total Tickets Sold, Total Records, and Total Expenses.
- Slicer-driven analysis so users can filter the workbook quickly by available fields and review the filtered dashboard instantly.
- Pivot-powered charts built from a structured data sheet and support sheet for easy refresh.
- Revenue and profitability views covering city, genre, region, event type, year, and month-level performance.
- Event operations insights for ticket sales, venue capacity, record status, and marketing spend.
- Artist and genre analysis to see which performers, regions, and music genres drive the most value.
- Editable Excel workbook that can be customized for your own concert, festival, touring, or live entertainment workflow.
What’s Inside the Concert Promoters Dashboard in Excel
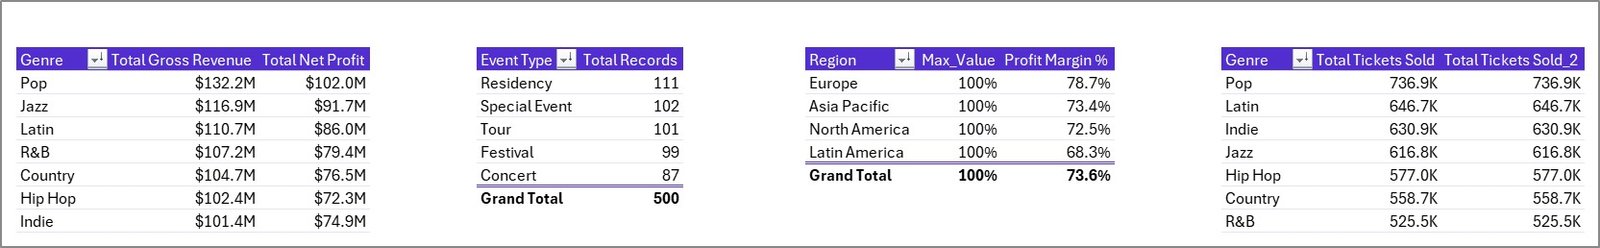
Overview Page
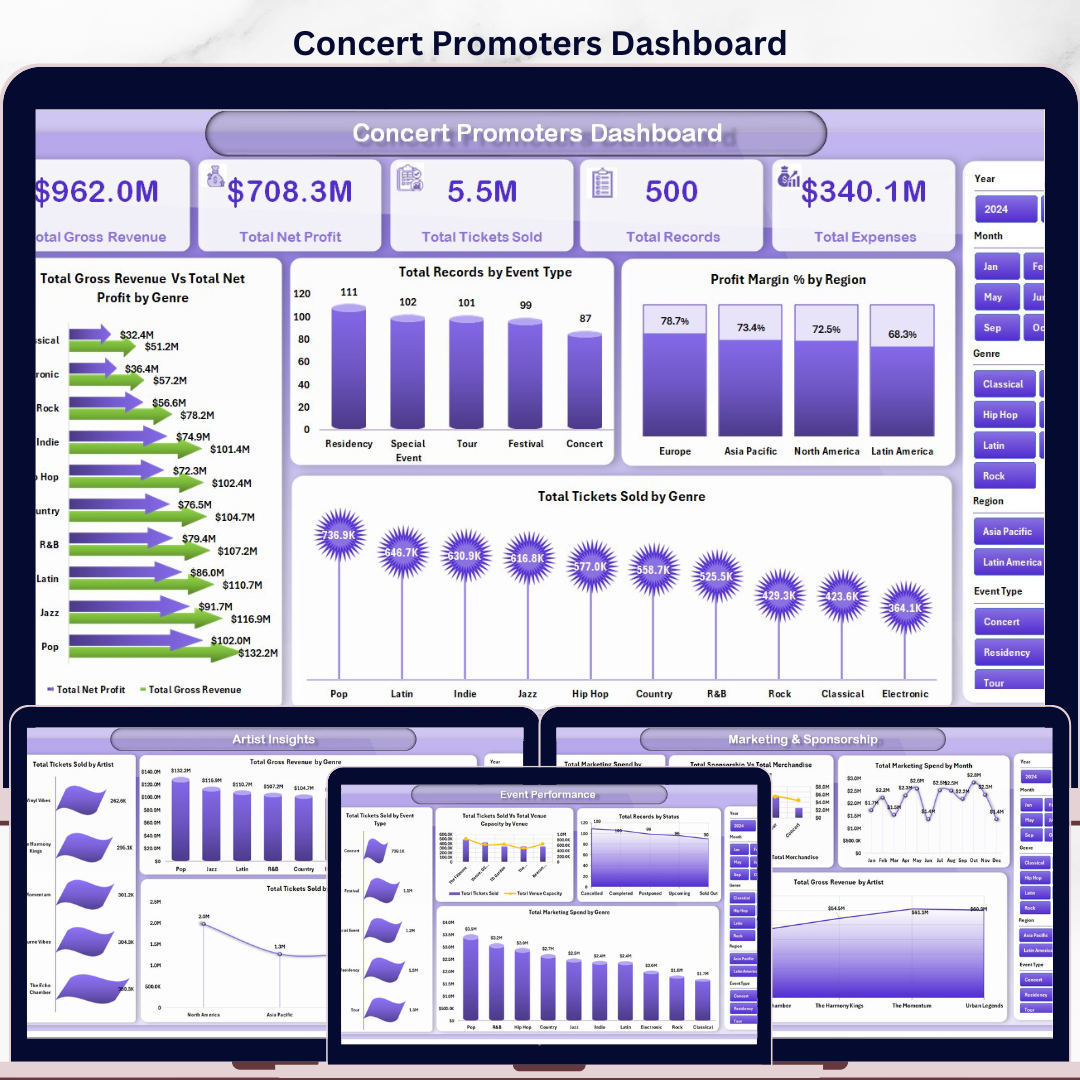
The Overview page works as the high-level control room for the workbook. KPI cards summarize Total Gross Revenue, Total Net Profit, Total Tickets Sold, Total Records, and Total Expenses, while the connected charts compare gross revenue vs. net profit by genre, record volume by event type, profit margin by region, and tickets sold by genre. This is the page leadership can open first to understand overall concert performance.
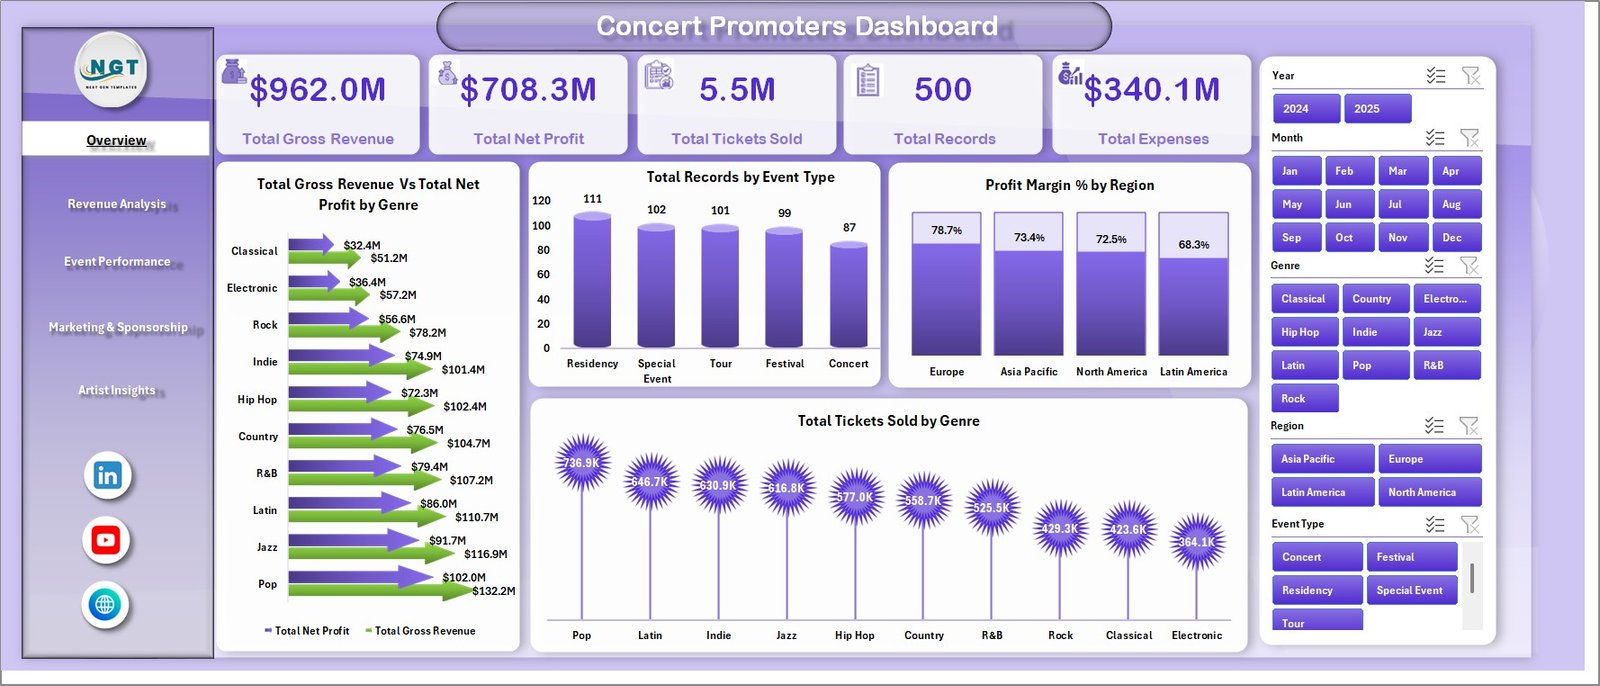
Concert Promoters Dashboard in Excel
Revenue Analysis
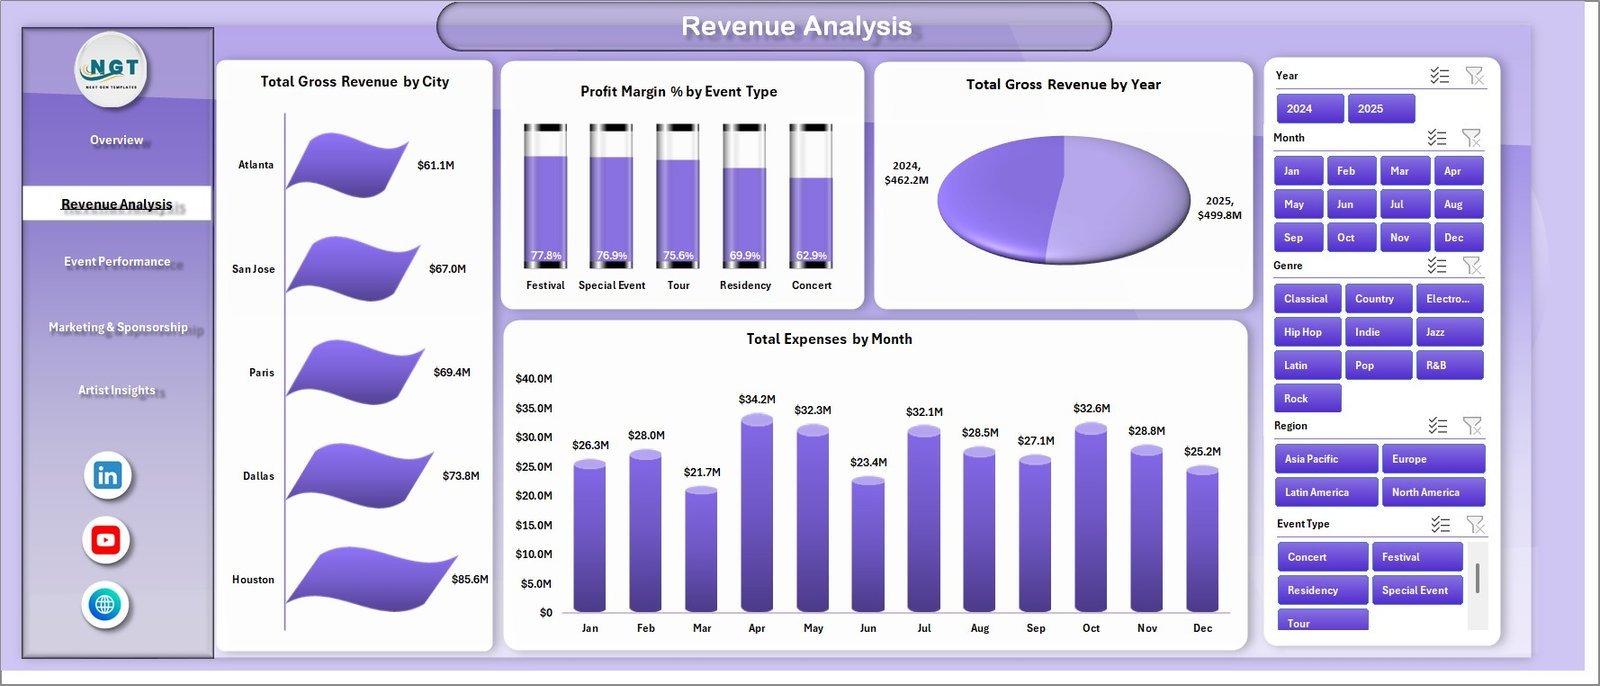
The Revenue Analysis sheet focuses on where money is coming from and where expenses are rising. It includes Total Gross Revenue by City, Profit Margin % by Event Type, Total Gross Revenue by Year, and Total Expenses by Month, helping promoters compare cities, formats, seasons, and expense patterns without manual chart rebuilding.

Revenue Analysis
Event Performance
The Event Performance page tracks operational results by event type, venue, status, and genre. Charts include Total Tickets Sold by Event Type, Total Tickets Sold vs. Total Venue Capacity by Venue, Total Records by Status, and Total Marketing Spend by Genre, making it easier to spot strong venues, underfilled capacity, and campaign-level execution gaps.
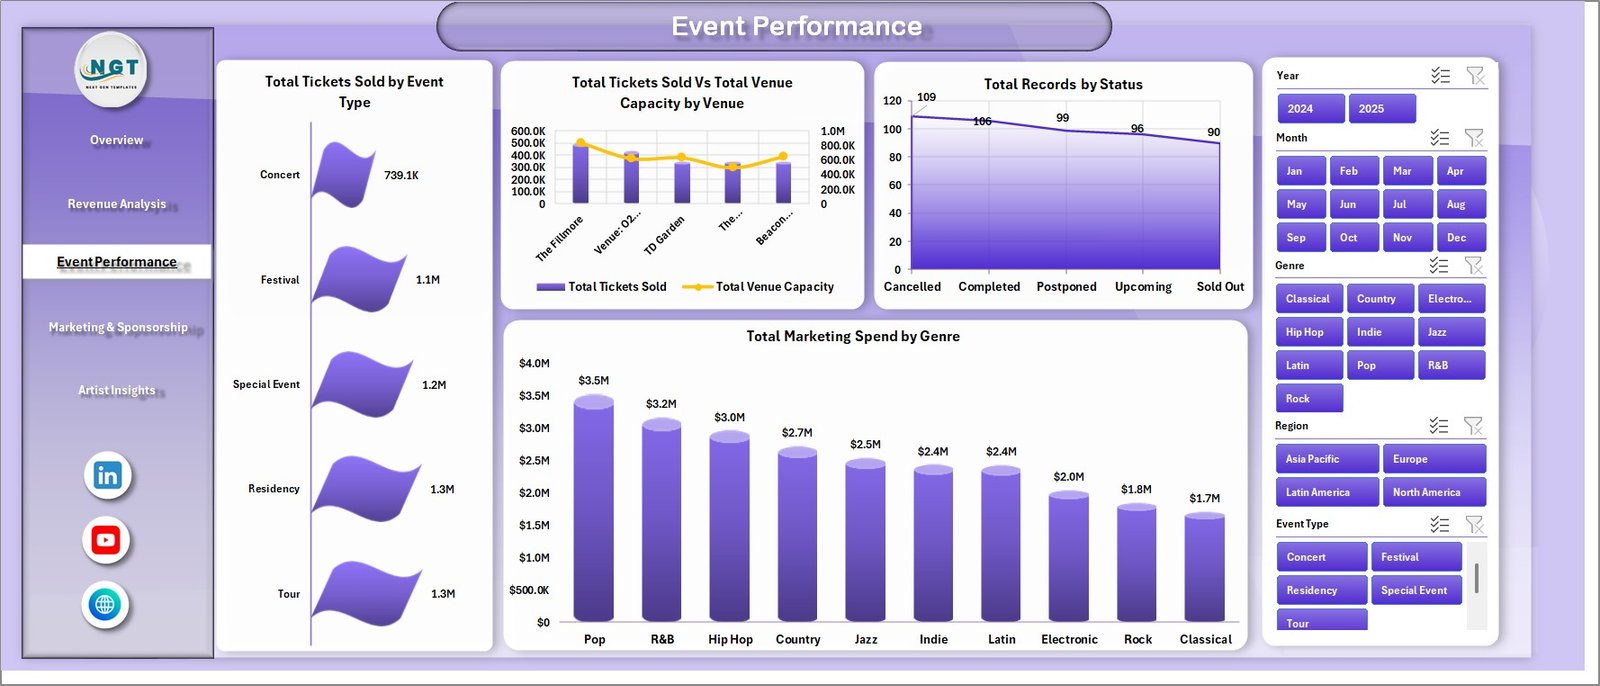
Event Performance
Marketing and Sponsorship
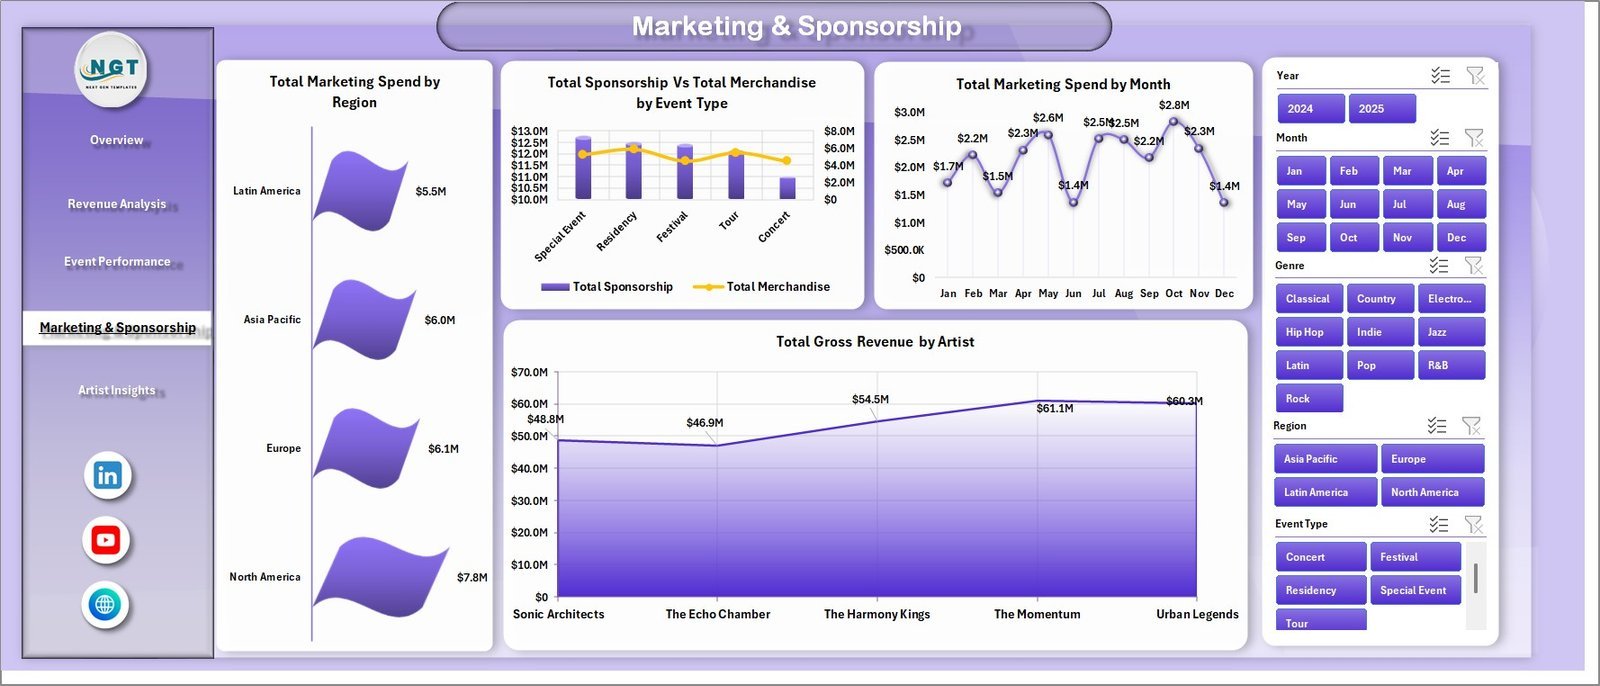
The Marketing and Sponsorship sheet connects promotional spend with sponsorship and merchandise performance. It shows Total Marketing Spend by Region, Total Sponsorship vs. Total Merchandise by Event Type, Total Marketing Spend by Month, and Total Gross Revenue by Artist, helping teams review whether marketing budget is being placed behind the right regions, artists, and event categories.

Marketing and Sponsorship
Artist Insights
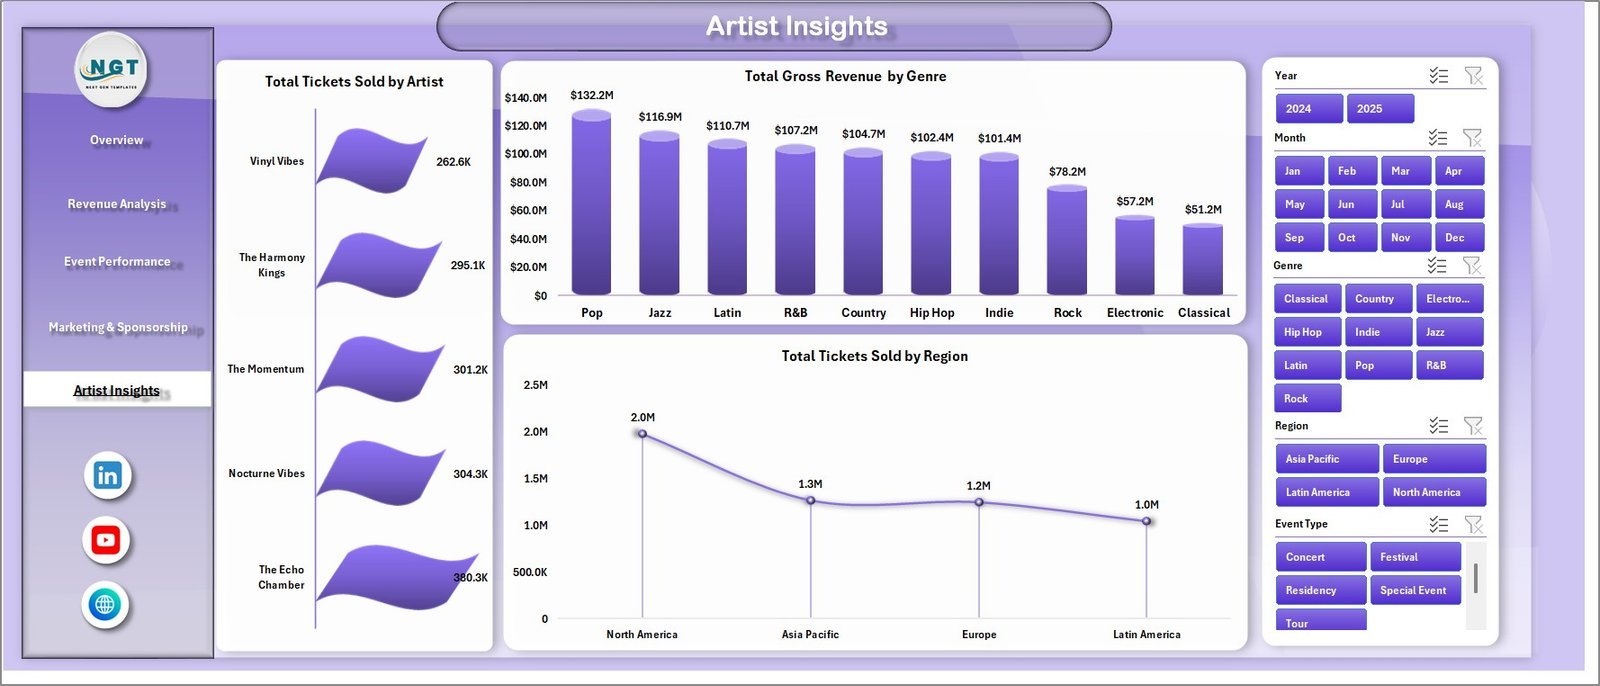
The Artist Insights page helps promoters compare artist contribution across tickets, revenue, genre, and region. It includes Total Tickets Sold by Artist, Total Gross Revenue by Genre, and Total Tickets Sold by Region, which is useful when planning future lineups, negotiating bookings, and choosing markets for repeat events.

Artist Insights
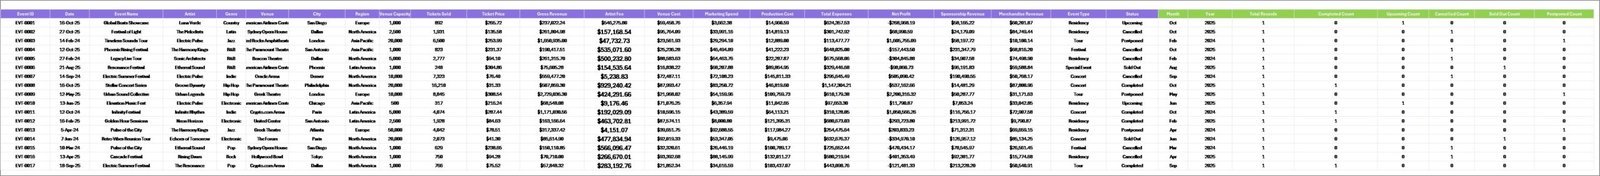
Data Sheet Tab
The Data sheet is where you add or replace the event records in the same structured format. After updating the rows, refresh the workbook so every pivot table and dashboard chart reflects the latest concert data.
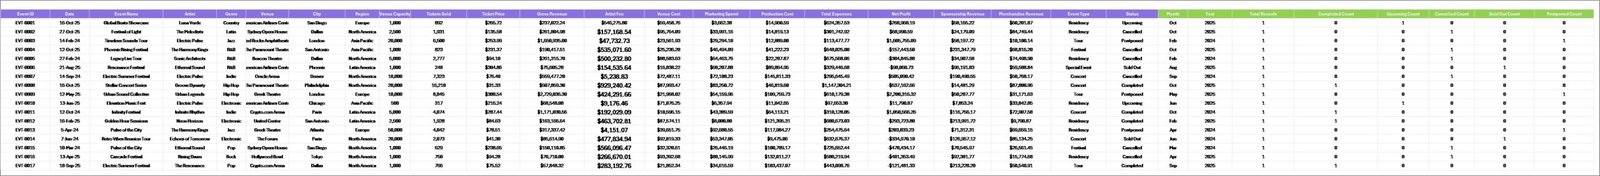
Data Sheet tab
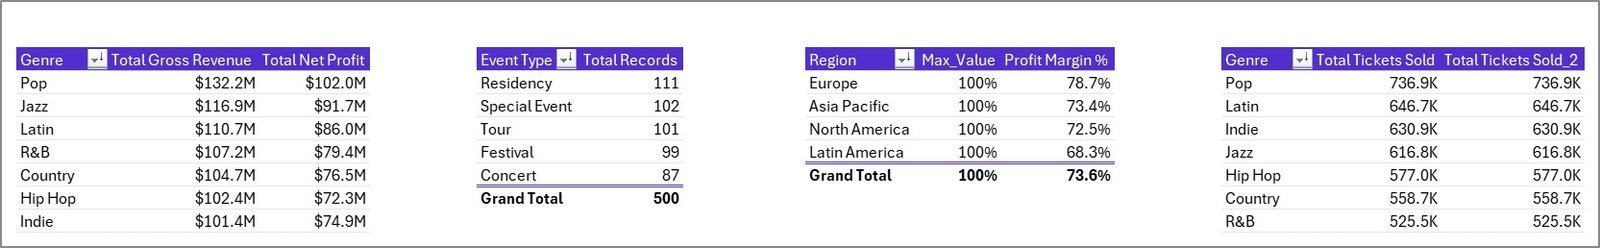
Support Sheet Tab
The Support sheet contains the pivot tables used to create the dashboard dynamically. After updating the Data sheet, go to the Data tab in the Excel Ribbon and click Refresh All. The pivots and charts will update together, and this support sheet can be hidden during normal use.
Support Sheet tab
Concert Promoters Dashboard in Excel vs. Google Sheets vs. Paid Event SaaS – Where This Fits
| Feature | This Excel Dashboard | Google Sheets Alternative | Paid Event SaaS |
|---|---|---|---|
| Cost | $17.99 one-time sale price | Template or custom build effort | Monthly or annual subscription |
| Platform | Microsoft Excel desktop or Microsoft 365 | Browser-based spreadsheet | Vendor cloud platform |
| Setup time | Under 10 minutes after download | Varies by template and sharing setup | Days or weeks for configuration |
| Offline access | Yes, when stored locally | Limited offline mode | Usually internet required |
| Customizable fields | Editable workbook, data sheet, pivots, and charts | Editable but may need formula rebuilds | Limited by plan and permissions |
| Year-1 cost at 5 users | $17.99 plus Excel licenses you already use | Low cost but more manual setup | Can reach hundreds or thousands per year |
| Best fit | Concert promoters who want fast Excel analytics | Teams needing live browser collaboration | Large teams needing ticketing operations, CRM, and automation |
Who This Template Is For – and Who It’s Not For
This template is for independent concert promoters, live event agencies, venue managers, artist managers, entertainment finance analysts, and small festival teams that already keep event records in Excel and want a faster way to review revenue, expenses, tickets, artist performance, and marketing spend.
It is not for teams that need live ticketing-system integrations, automated settlements, CRM communication, barcode scanning, or multi-user transactional workflows. For those needs, use a dedicated ticketing or event management platform and treat this Excel dashboard as a reporting layer.
How to Use the Concert Promoters Dashboard in Excel
- Download and unzip the file after purchase.
- Open the workbook in Microsoft Excel.
- Go to the Data sheet and replace the sample rows with your own concert promoter data in the same format.
- Keep the column structure consistent so the pivots can read the data correctly.
- Go to the Data tab in the Excel Ribbon and click Refresh All.
- Use slicers on the dashboard pages to filter by the available event fields.
- Review the Overview, Revenue Analysis, Event Performance, Marketing and Sponsorship, and Artist Insights pages for decision-making.
Real-World Use Cases
Ravi, independent concert promoter: Ravi imports event revenue, sponsorship, merchandise, tickets, and expenses after every show. Before negotiating a new venue contract, he filters the dashboard by region and compares venue capacity against tickets sold.
Maya, entertainment finance analyst: Maya uses the Revenue Analysis sheet during month-end review to compare gross revenue by city and expenses by month. This helps her explain why one tour segment produced strong revenue but weak margin.
Andre, artist manager: Andre reviews Artist Insights before planning next quarter’s bookings. By comparing tickets sold by artist and gross revenue by genre, he can prioritize stronger lineups and more profitable markets.
Frequently Asked Questions
What is the Concert Promoters Dashboard in Excel?
It is a ready-to-use Excel dashboard for analyzing concert promoter data, including revenue, profit, ticket sales, event performance, marketing spend, sponsorship, merchandise, artists, genres, regions, cities, and venues.
Can I replace the sample data?
Yes. The Data sheet is designed for replacing the sample data with your own records. Keep the same format and refresh all pivots after updating the data.
Do I need advanced Excel skills?
No. Basic Excel knowledge is enough for normal use. You only need to update rows, refresh the workbook, and use slicers to filter the dashboard.
Can I customize the charts?
Yes. The workbook is editable, so you can adjust chart titles, colors, pivot fields, slicers, and sheet formatting to match your reporting style.
Does this connect directly to ticketing platforms?
No. This is an Excel reporting workbook. Export your ticketing or event data to Excel format, paste it into the Data sheet, and refresh the dashboard.
Can I hide the Support sheet?
Yes. The Support sheet contains pivot tables for the dashboard and can be hidden after setup to keep the workbook clean for end users.
About the Author
Built by PK – Microsoft Certified Professional with 15+ years of Excel, Google Sheets, and Power BI experience. Founder of NextGenTemplates, reaching 300K+ subscribers across YouTube channels. Every template is hand-built and tested before release.
Explore Related Templates
- Ticketing and Live Events KPI Dashboard in Excel – KPI-style tracking for ticketing and live events.
- Music Industry KPI Dashboard in Power BI – Power BI analytics for music business performance.
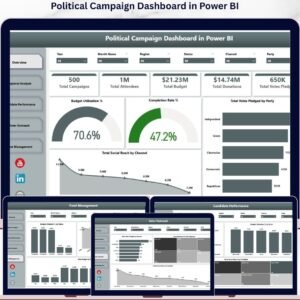
- Political Campaign Dashboard in Power BI – campaign-style analytics with multi-page reporting.
- Browse Excel Dashboard templates.
Ready to analyze concert revenue, tickets, expenses, and artist performance in Excel? Download the Concert Promoters Dashboard in Excel and turn your event records into decision-ready visuals.
Last updated: May 2026.
Click here to read the detailed blog post


Reviews
There are no reviews yet.