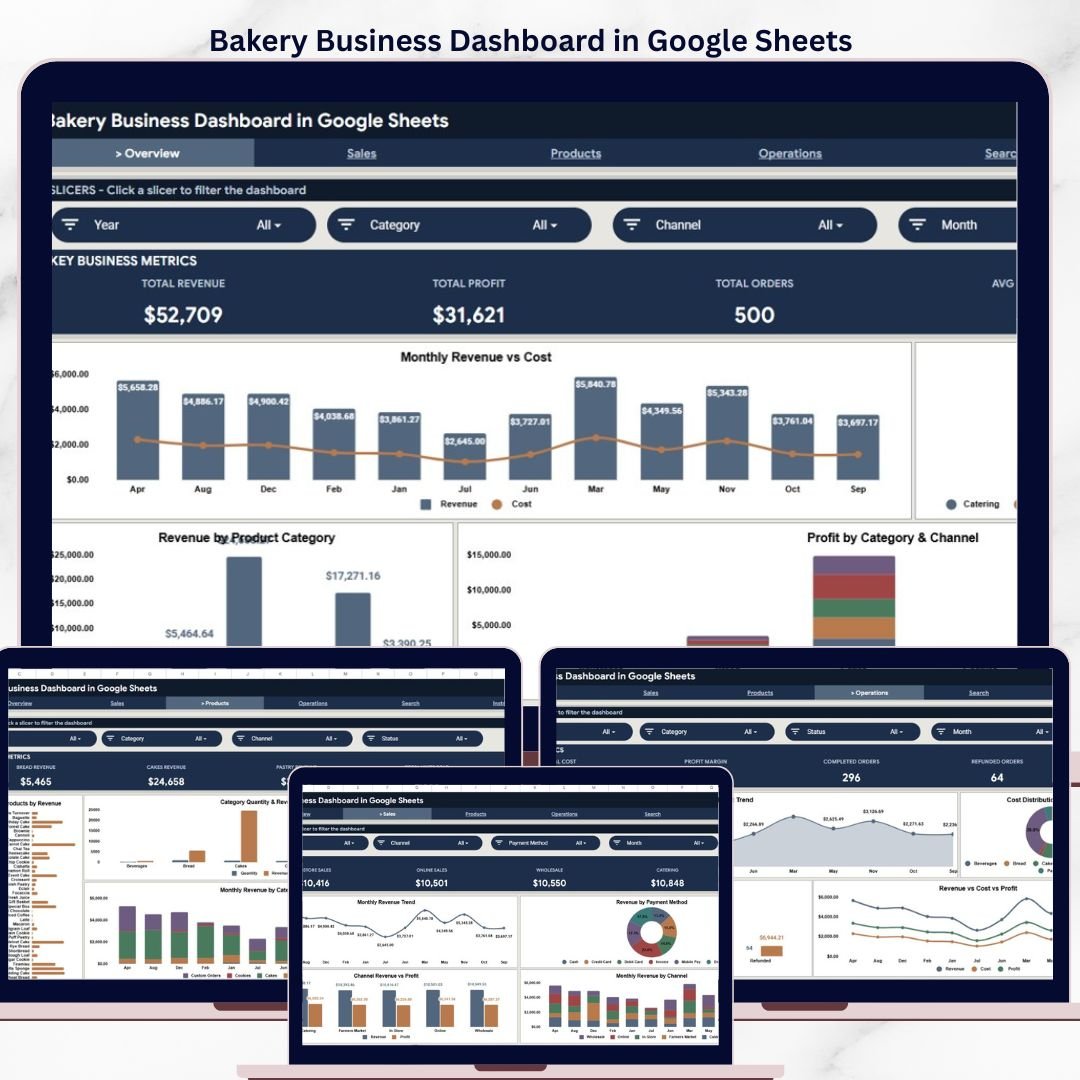


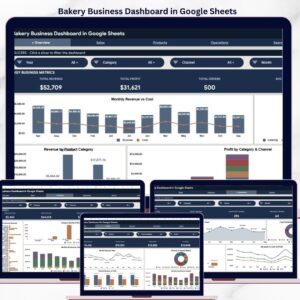
The Bakery Business Dashboard in Google Sheets tracks 4 KPI cards, 4 analysis charts, and multi-slicer filtering across 6 interactive pages — covering revenue, profit, orders, products, and operations. Setup takes under 10 minutes — just replace the 500-row sample dataset with your own bakery data and every chart, card, and filter updates automatically.Bakery Business Dashboard in Google Sheets
🌍 Join 8,400+ teams in 40+ countries using NextGenTemplates to replace paid SaaS tools with one-time-purchase Excel, Google Sheets, Power BI, and HTML templates.Bakery Business Dashboard in Google Sheets
✅ Instant download · One-time payment · No subscription · No per-user fees · Lifetime access
🔑 Key Features of Bakery Business Dashboard in Google Sheets
The Bakery Business Dashboard in Google Sheets includes 6 structured pages designed specifically for bakery and food retail businesses. The Overview page displays Total Revenue, Total Profit, Total Orders, and Average Order Value as KPI cards, with charts showing Monthly Revenue vs Cost, Revenue by Sales Channel, Revenue by Product Category, and Profit by Category and Channel. Interactive slicers let you filter by date range, category, channel, and payment method instantly.Bakery Business Dashboard in Google Sheets
This template tracks bakery-specific metrics including revenue distribution across online, in-store, and wholesale channels, product category performance for breads, pastries, cakes, and specialty items, and operational cost breakdowns. Each analysis page uses pivot-driven charts that auto-expand as new data rows are added — no manual chart adjustment needed.Bakery Business Dashboard in Google Sheets
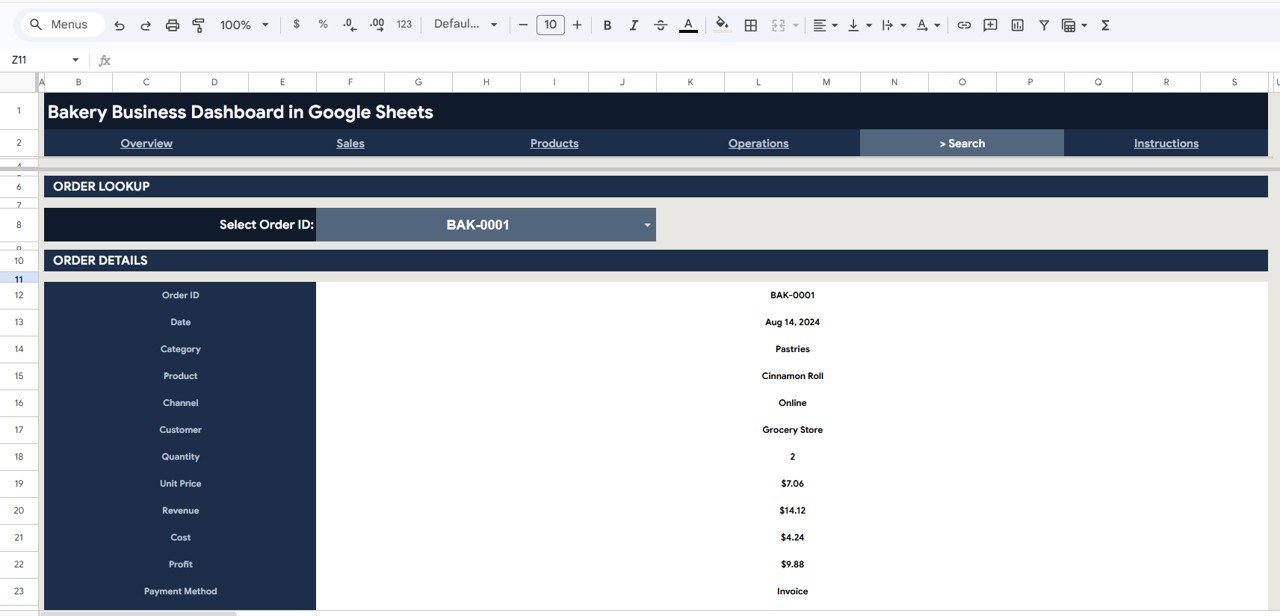
The Search sheet provides instant order lookup by selecting any Order ID from a dropdown, displaying all related details including date, category, product, channel, customer, quantity, unit price, revenue, cost, profit, and payment method. Explore more Google Sheets Dashboard Templates for other industries.Bakery Business Dashboard in Google Sheets
📦 What’s Inside the Bakery Business Dashboard
📌 Overview Page — 4 KPI cards (Total Revenue, Total Profit, Total Orders, Avg Order Value) + 4 analysis charts + multiple slicers for instant filtering
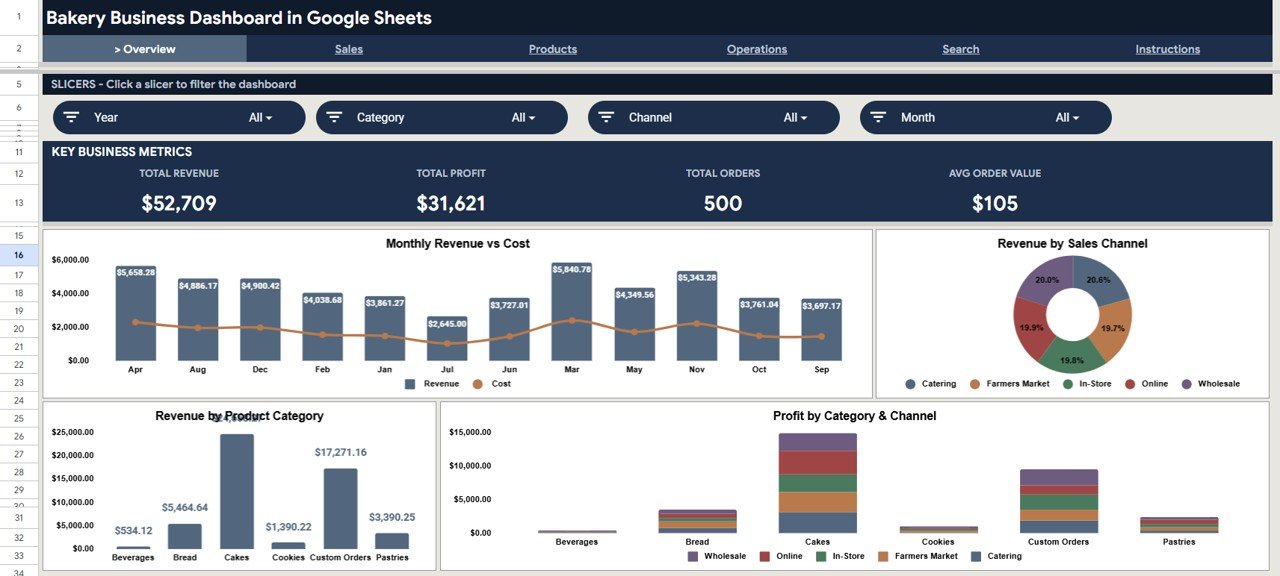 Bakery Business Dashboard in Google Sheets — Overview Page
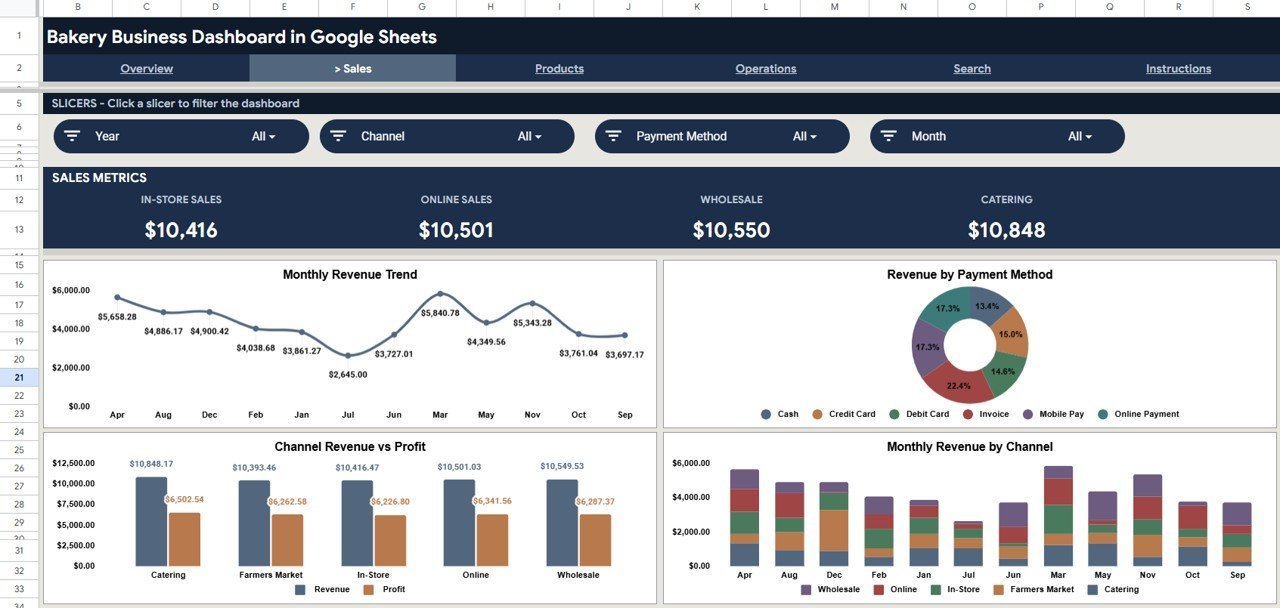
📌 Sales Analysis Page — Monthly Revenue Trend, Revenue by Payment Method, Channel Revenue vs Profit, Monthly Revenue by Channel. This page helps you understand which sales channels drive the most revenue and how payment methods distribute across your bakery orders.
 Sales Analysis Page
📌 Products Analysis Page — Top Products by Revenue, Category Quantity and Revenue, Products by Quantity Sold, Monthly Revenue by Category. This page reveals which bakery products sell the most and which categories generate the highest revenue.
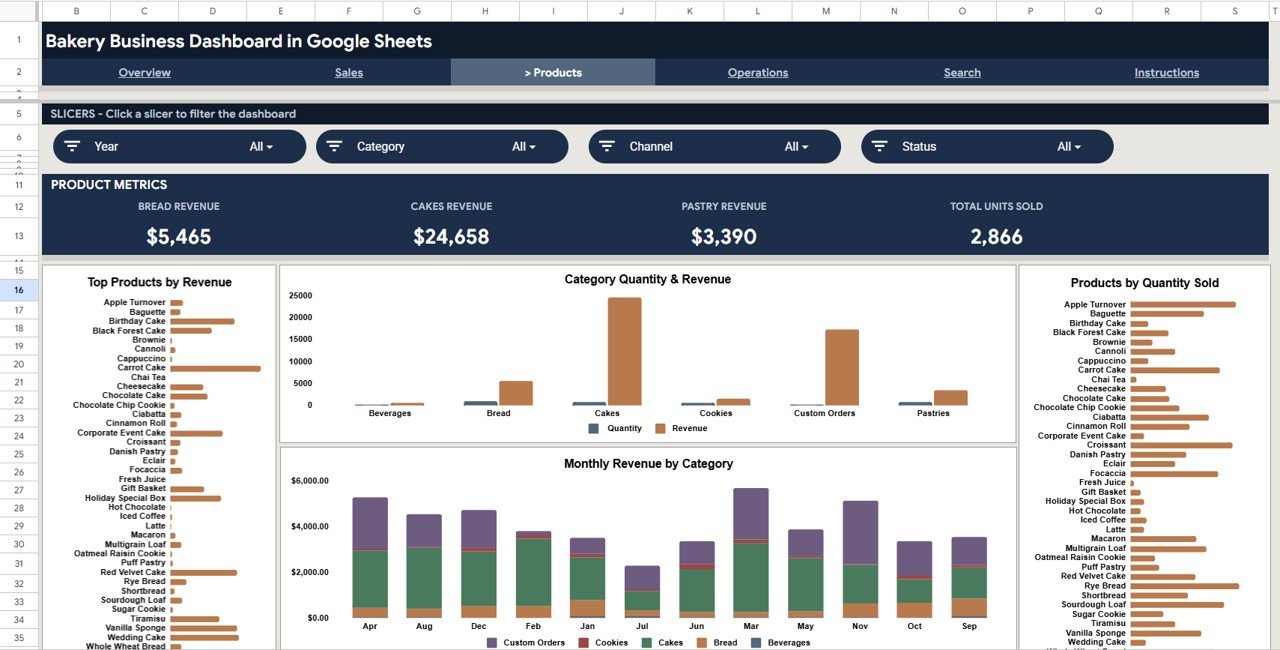 Products Analysis Page
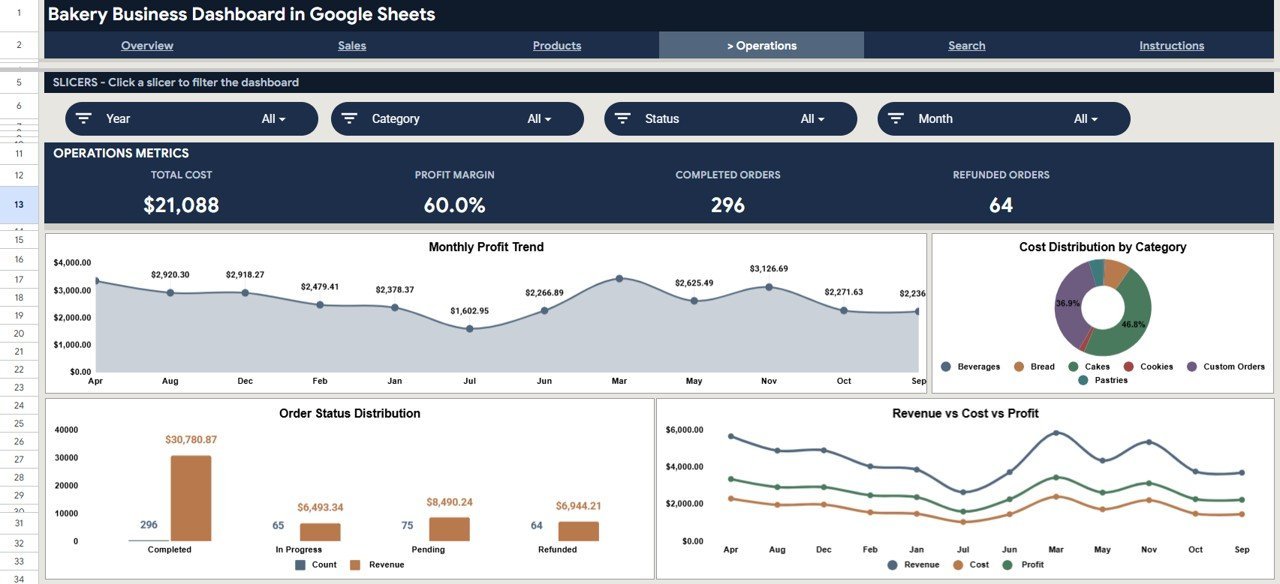
📌 Operations Page — Monthly Profit Trend, Cost Distribution by Category, Order Status Distribution, Revenue vs Cost vs Profit. This page provides operational visibility into where costs accumulate and how profit margins trend over time.
 Operations Page
📌 Search Sheet — Select any Order ID from a dropdown and instantly view all order details including date, category, product, channel, customer, quantity, unit price, revenue, cost, profit, and payment method.
 Search Sheet
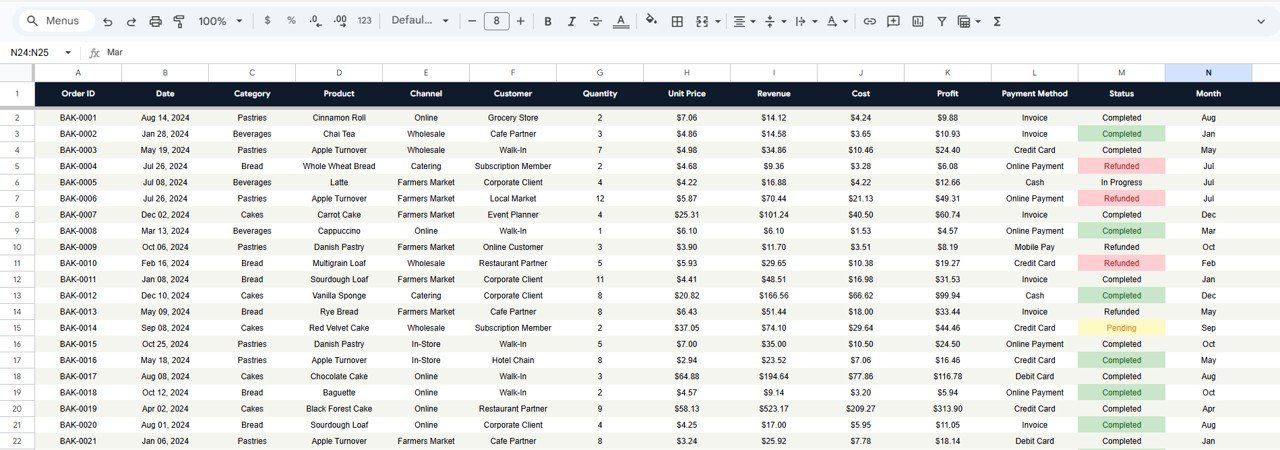
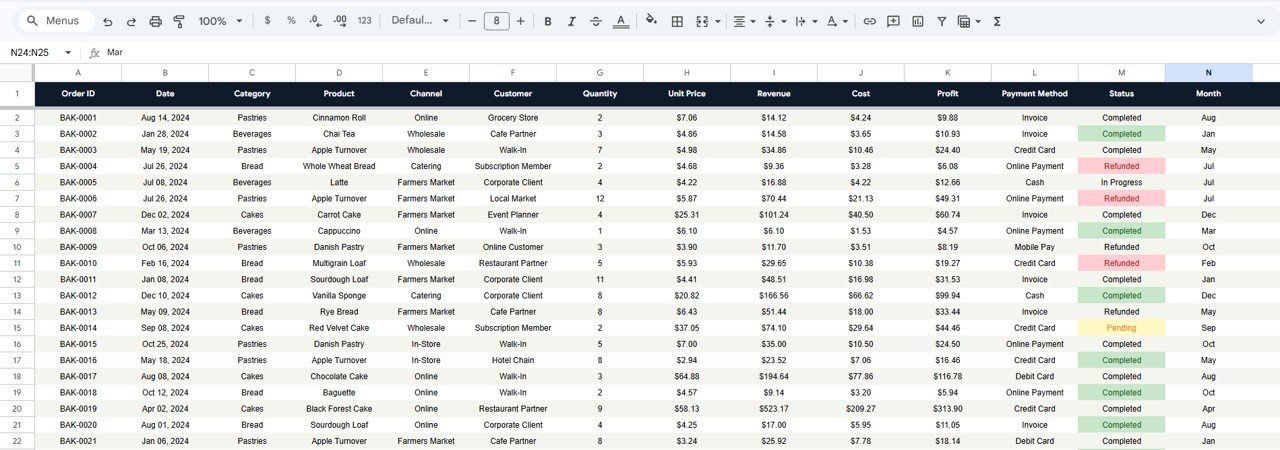
📌 Data Sheet — Enter your bakery data in the structured format provided. The dashboard reads from this sheet and updates all pages automatically.
 Data Sheet
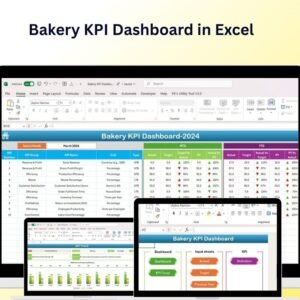
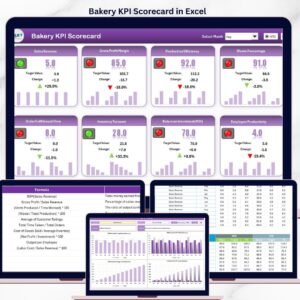
Also check out the Bakery KPI Dashboard in Google Sheets for KPI scorecard-style tracking with MTD and YTD comparisons, and the Bakery KPI Dashboard in Excel for an Excel-based alternative.
📊 Bakery Business Dashboard vs. Microsoft Excel Dashboard vs. Toast POS Analytics — Where This Fits
| Feature | Bakery Business Dashboard (Google Sheets) | Microsoft Excel Dashboard | Toast POS Analytics |
|---|---|---|---|
| Cost | $9.99 one-time | $14.99+ one-time (template cost) | $69–165/month per location |
| Platform | Google Sheets (cloud, free) | Microsoft Excel (license needed) | Toast proprietary platform |
| Setup time | Under 10 minutes | 10–15 minutes | 1–2 weeks onboarding |
| Real-time team collaboration | ✅ Built-in (Google Sheets) | ❌ Requires OneDrive/SharePoint | ✅ Yes |
| Mobile access | ✅ Google Sheets app | Limited on mobile | ✅ Yes |
| Customizable fields | ✅ Fully editable | ✅ Fully editable | Limited customization |
| Share with link | ✅ One-click sharing | ❌ File sharing required | ✅ Role-based access |
| Year-1 cost at 5 users | $9.99 total | $14.99 + Excel licenses | $828–1,980+ |
| Slicer-based filtering | ✅ Multiple slicers | ✅ Pivot table slicers | Limited filters |
For bakeries that want data-driven insights without paying $69–165/month per location, the Bakery Business Dashboard in Google Sheets sits in the sweet spot.
👥 Who This Template Is For — and Who It’s Not For
✅ This template is built for:
- Bakery owners and managers running 1–10 locations who need centralized sales and operations tracking
- Food business operators who want to analyze revenue by channel, product, and category without BI software
- Small bakery startups tracking orders, costs, and profit margins in Google Sheets
❌ This template is NOT for:
- Enterprise bakery chains needing real-time POS integration with 50+ locations
- Businesses requiring automated inventory management with barcode scanning
⚙️ How to Use the Bakery Business Dashboard
1️⃣ Open the PDF guide included in your download and click the Google Sheets copy link to create your own editable copy
2️⃣ Go to the Data Sheet tab and replace the sample data with your bakery order records — keep the same column format
3️⃣ Return to the Overview page to see your KPI cards and charts update automatically
4️⃣ Use the slicers to filter by date, category, channel, or payment method for targeted analysis
5️⃣ Explore Sales, Products, and Operations pages for detailed breakdowns
6️⃣ Use the Search sheet to look up any individual order by selecting its Order ID
💼 Real-World Use Cases
Maria runs a neighborhood bakery with 2 retail locations and an online store. She uses the Bakery Business Dashboard to compare revenue across her in-store, online, and wholesale channels. Each month she identifies which products generate the highest margins and adjusts her production schedule to reduce waste on low-demand items.
James manages operations for a mid-size artisan bread company. He uses the Operations page to track cost distribution by product category and monitors profit trends monthly. The slicer filters help him quickly isolate specific channels for quarterly business reviews with his team.
Priya recently launched a home bakery and sells through Instagram and local markets. She enters every order into the Data Sheet and uses the dashboard to track her average order value, best-selling products, and total profit — replacing the notebook she used to rely on.
❓ Frequently Asked Questions
What KPIs does the Bakery Business Dashboard track?
The Bakery Business Dashboard tracks Total Revenue, Total Profit, Total Orders, and Average Order Value as primary KPIs. It also provides detailed analysis of revenue by channel, category, product, and payment method across 4 dedicated analysis pages.
Can I customize the product categories in this dashboard?
Yes. The Bakery Business Dashboard reads categories directly from the Data Sheet. You can rename, add, or remove product categories — such as Breads, Pastries, Cakes, or Cookies — and all charts and slicers update automatically.
How does this compare to Toast POS or Square Analytics?
Toast POS and Square Analytics charge $69–165+ per month per location. The Bakery Business Dashboard costs $9.99 one-time with no recurring fees and gives you full control over data customization in Google Sheets.
Does the dashboard work on mobile devices?
Yes. Since it runs in Google Sheets, you can view and interact with the Bakery Business Dashboard on any device with the Google Sheets app installed — including phones and tablets.
How long does setup take?
Setup takes under 10 minutes. Open the PDF guide, click the copy link, replace sample data with your bakery records, and the dashboard updates instantly with your numbers.
Can multiple team members access the dashboard at the same time?
Yes. Google Sheets supports real-time collaboration. Multiple bakery staff or managers can view and update the dashboard simultaneously from any location.
Is any coding or technical knowledge required?
No coding is required. The Bakery Business Dashboard uses built-in Google Sheets features — pivot tables, charts, slicers, and formulas. Anyone familiar with spreadsheets can use it immediately.
👤 About the Author
Built by PK — Microsoft Certified Professional with 15+ years of Excel, Google Sheets, and Power BI experience. Founder of NextGenTemplates, reaching 300K+ subscribers across YouTube channels (@PK-AnExcelExpert, @NextGenTemplates, @NeoTechNavigators). Every template is hand-built and tested before release.
🔗 Explore Related Templates
📌 Bakery KPI Dashboard in Google Sheets — KPI scorecard with MTD/YTD tracking and trend analysis for bakeries
📌 Bakery KPI Dashboard in Excel — Excel version with conditional formatting and performance indicators
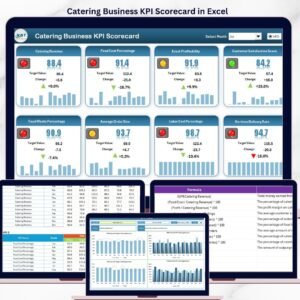
📌 Catering Business KPI Dashboard in Excel — Tracks catering-specific KPIs across 4 interactive worksheets
📌 Food and Beverage Report in Excel — Production, sales, and inventory reporting for F&B businesses
📖 Click here to read the Detailed Blog Post
Watch the step-by-step video tutorial:
🎥 Visit our YouTube channel for step-by-step video tutorials
👉 YouTube.com/@NextGenTemplates


Reviews
There are no reviews yet.