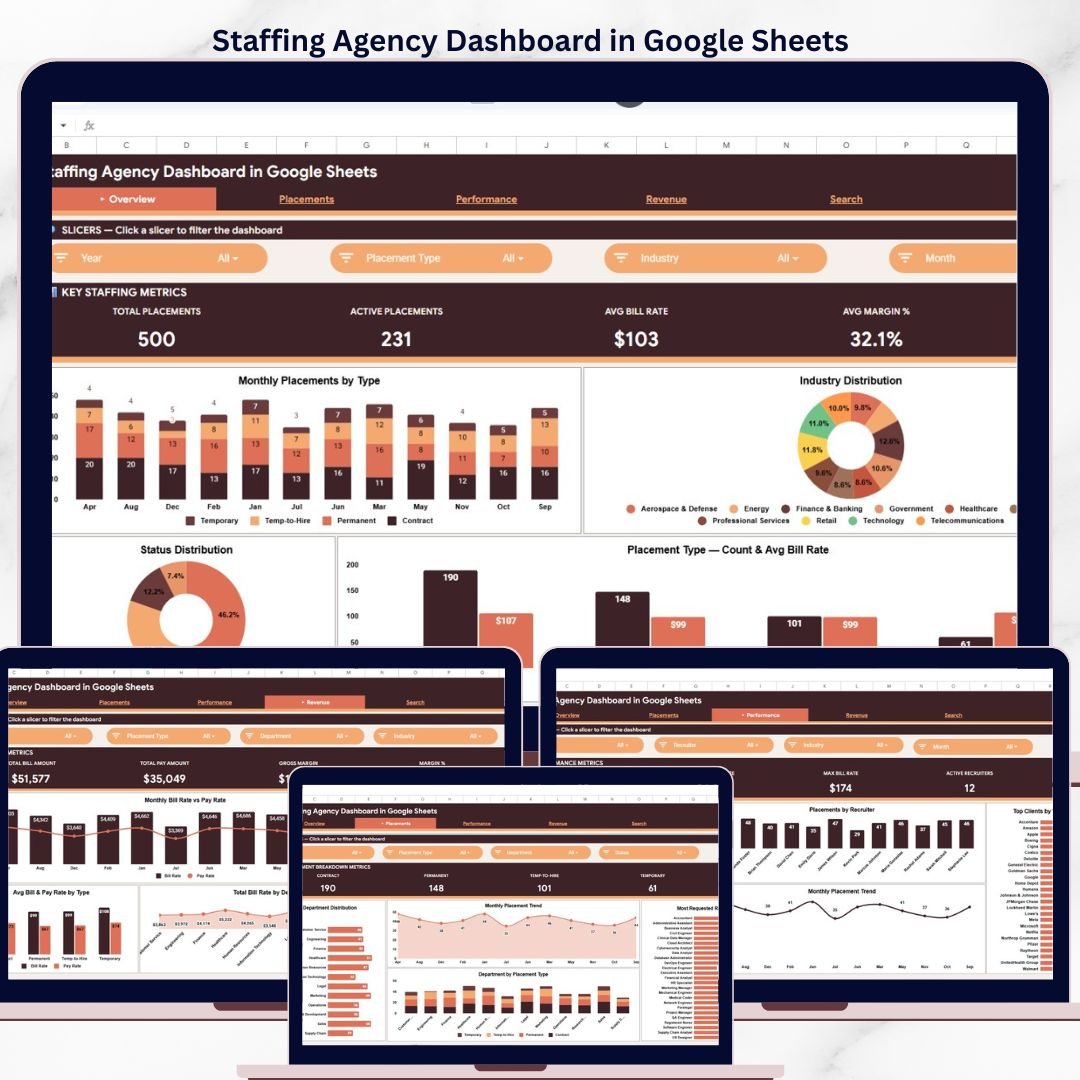

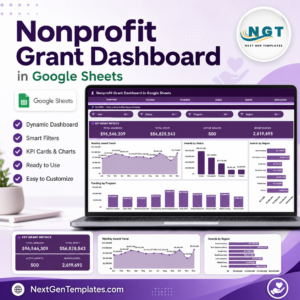
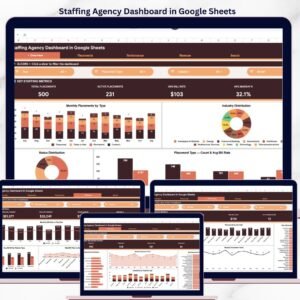
The Staffing Agency Dashboard in Google Sheets tracks 4 headline KPIs and 15+ chart visualizations across 6 interactive sheet tabs. With dedicated pages for Overview, Placements, Performance, Revenue, Search, and a Data Sheet, this template gives staffing agencies and recruitment firms a single source of truth for placement activity, bill rates, recruiter output, and margin trends — all inside a free, browser-based Google Sheets file that requires zero software installation.
Whether you run a 5-person boutique staffing firm or a 50-recruiter agency, tracking placements across clients, industries, and recruiters manually in spreadsheets or paying $30–$99/user/month for Bullhorn or Zoho Recruit is either error-prone or expensive. The Staffing Agency Dashboard in Google Sheets solves both problems: it delivers real-time, auto-updating analytics with built-in collaboration — for a one-time cost of $9.99.
Key Features of the Staffing Agency Dashboard in Google Sheets
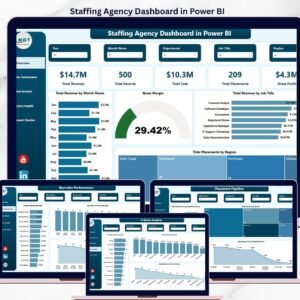
This Google Sheets staffing dashboard includes 4 KPI cards on the Overview page — Total Placements, Active Placements, Avg Bill Rate, and Avg Margin % — all driven by native formulas that update automatically as you add new placement data.
The template contains 15+ interactive charts spanning placement trends by month and placement type, industry breakdowns, status tracking, recruiter performance comparisons, client-level analytics, and bill rate vs. pay rate analysis. Multiple slicers on the Overview page let you filter the entire dashboard by department, recruiter, placement type, and date range.
A dedicated Search Sheet provides a placement lookup feature where you can select any Placement ID from a dropdown and instantly view 11 fields including date, client company, job title, candidate name, recruiter, bill rate, pay rate, and status. This makes individual placement lookups instant during client calls or review meetings.
Dashboard Pages Explanation
1 — Overview Page
The Overview page displays 4 KPI cards at the top: Total Placements, Active Placements, Avg Bill Rate, and Avg Margin %. Below these cards, you’ll find 5 charts that provide a high-level snapshot of your staffing operations.
The Placements by Month and Placement Type chart tracks monthly placement volume segmented by contract, permanent, and temp-to-hire. The Placements by Industry chart shows which verticals (IT, Healthcare, Finance, Manufacturing) generate the most activity. Placements by Status breaks down active, completed, and cancelled placements. Placement Count by Placement Type and Avg Bill Rate by Placement Type round out the view, letting you compare volume and pricing across service categories.
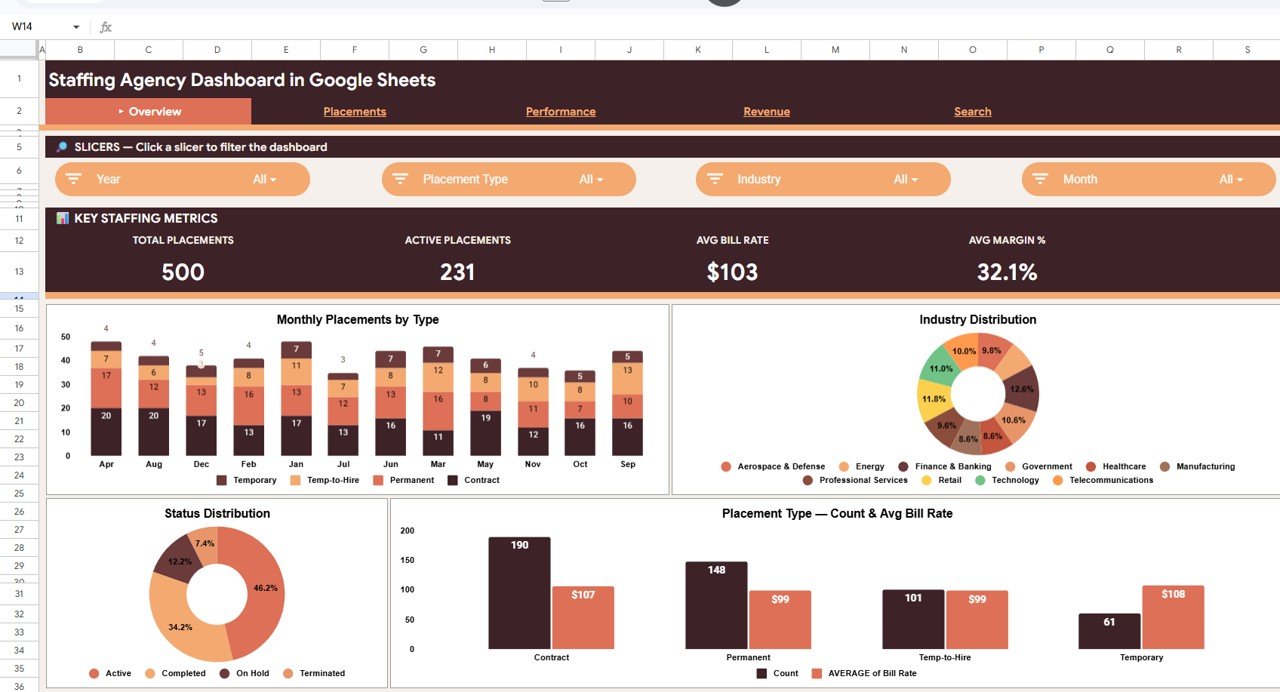
Staffing Agency Dashboard in Google Sheets — Overview Page
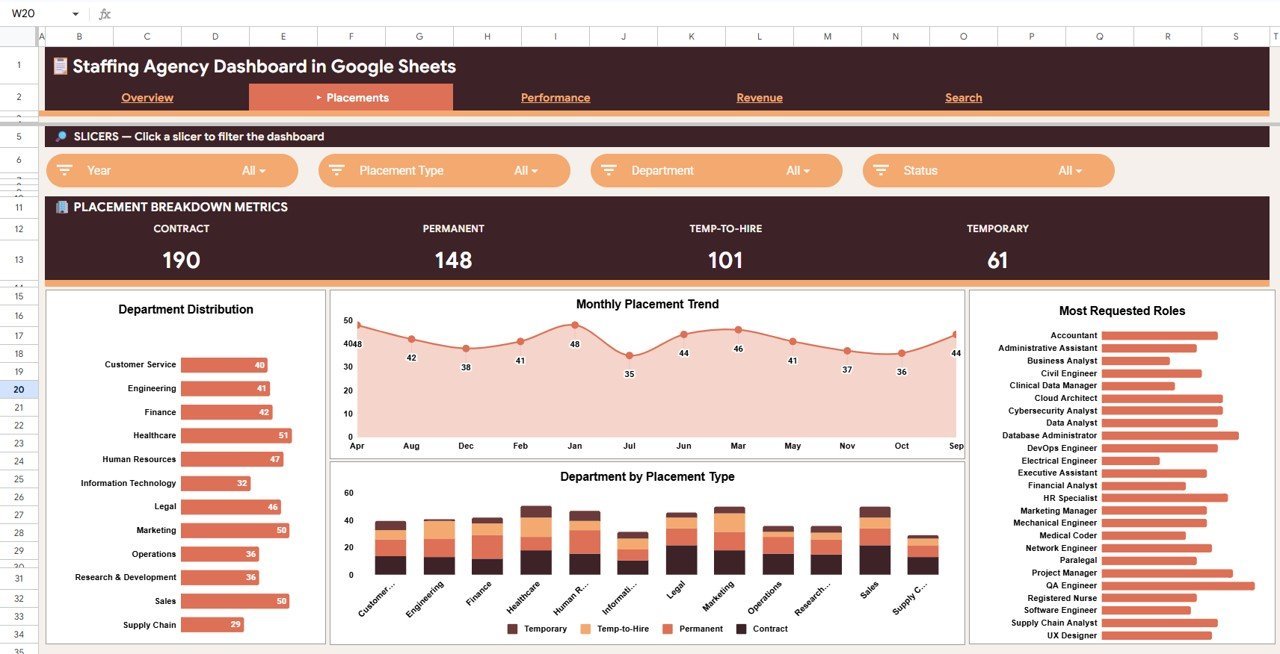
2 — Placements Page
The Placements page goes deeper into placement distribution with 4 charts: Placements by Department shows which departments (Engineering, Sales, Operations, HR) are generating the most hiring activity. Placements by Month provides a trend line for growth patterns and seasonal cycles. Placements by Role breaks down which specific job titles you fill most frequently. Placements by Department and Placement Type provides a cross-tabulation of department vs. placement type for granular resource planning.

Placements Page
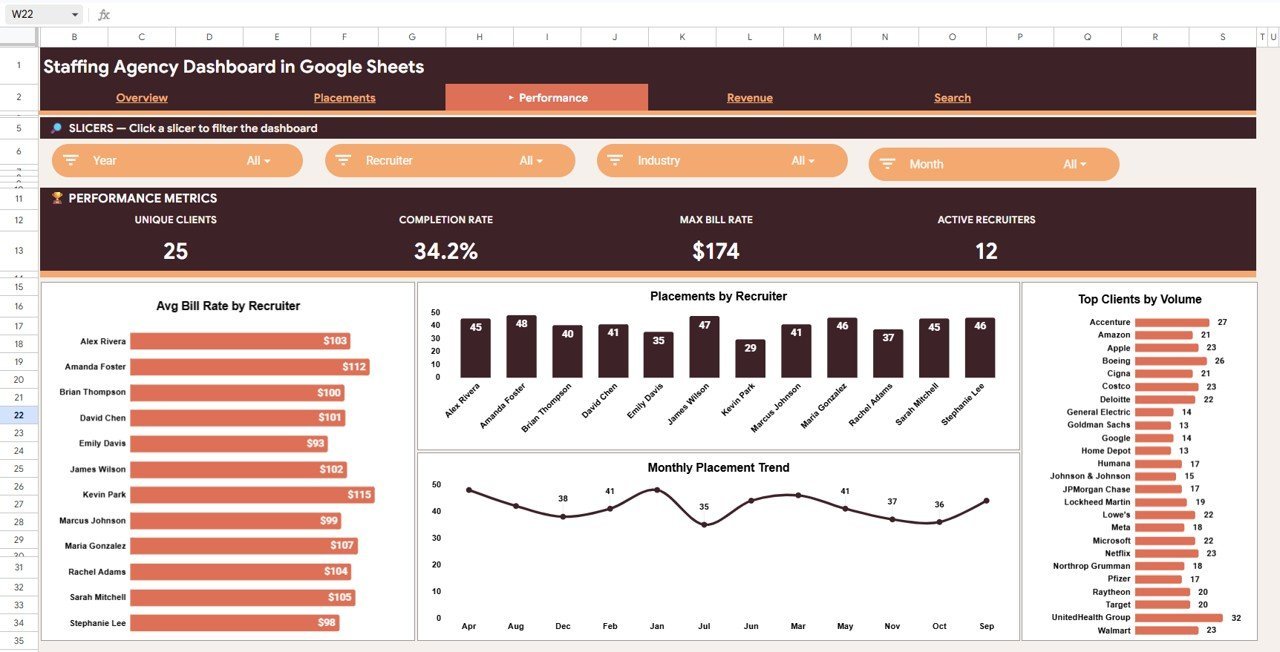
3 — Performance Page
The Performance page focuses on recruiter-level and client-level metrics. Avg Bill Rate by Recruiter ranks recruiters by the average bill rate they command — higher rates indicate stronger client relationships. Placements by Recruiter compares total volume across your team. Placements by Client shows which client companies generate the most activity, and Placements by Month provides a monthly trend filtered to recruiter-level performance.

Performance Page
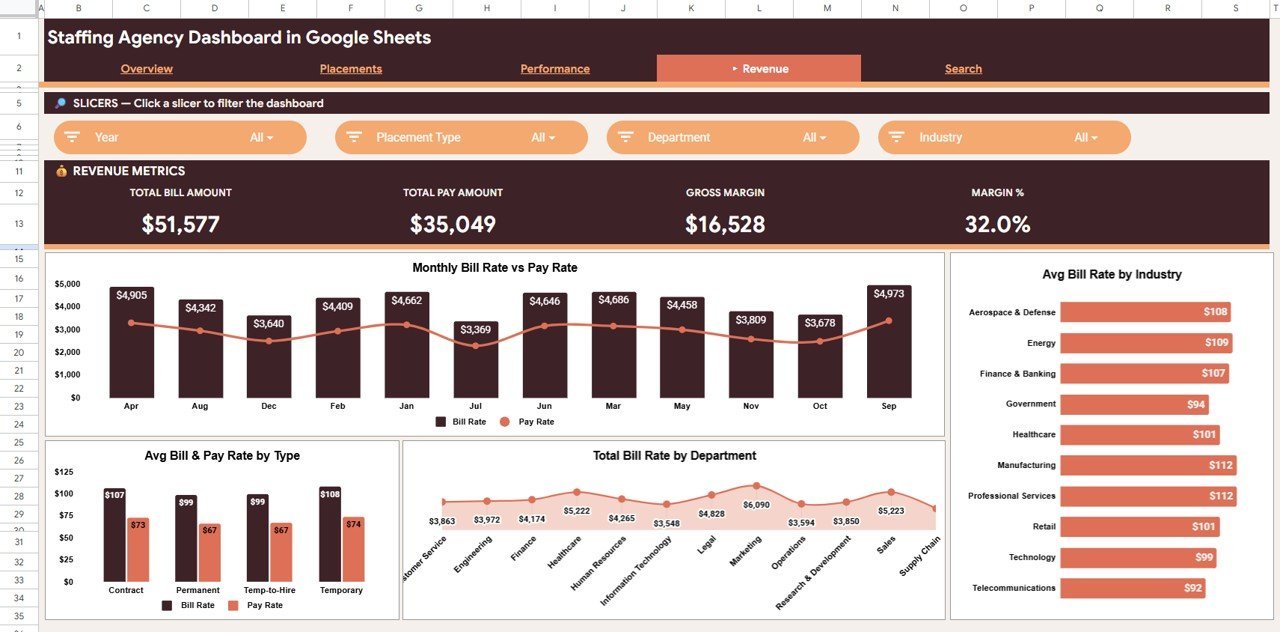
4 — Revenue Page
The Revenue page delivers margin-focused analytics with 4 charts. Bill Rate and Pay Rate by Month shows the monthly spread between what you charge and what you pay. Avg Bill Rate by Industry identifies high-margin verticals. Avg Bill Rate and Pay Rate by Placement Type compares profitability across contract, permanent, and temp-to-hire. Total Bill Rate by Department shows revenue concentration by department.

Revenue Page
5 — Search Sheet
The Search Sheet is a placement lookup tool. Select any Placement ID from the dropdown and instantly see: Placement ID, Date, Client Company, Job Title, Department, Candidate Name, Recruiter, Bill Rate, Pay Rate, Placement Type, and Status. This is useful during client calls, recruiter reviews, or audit meetings.
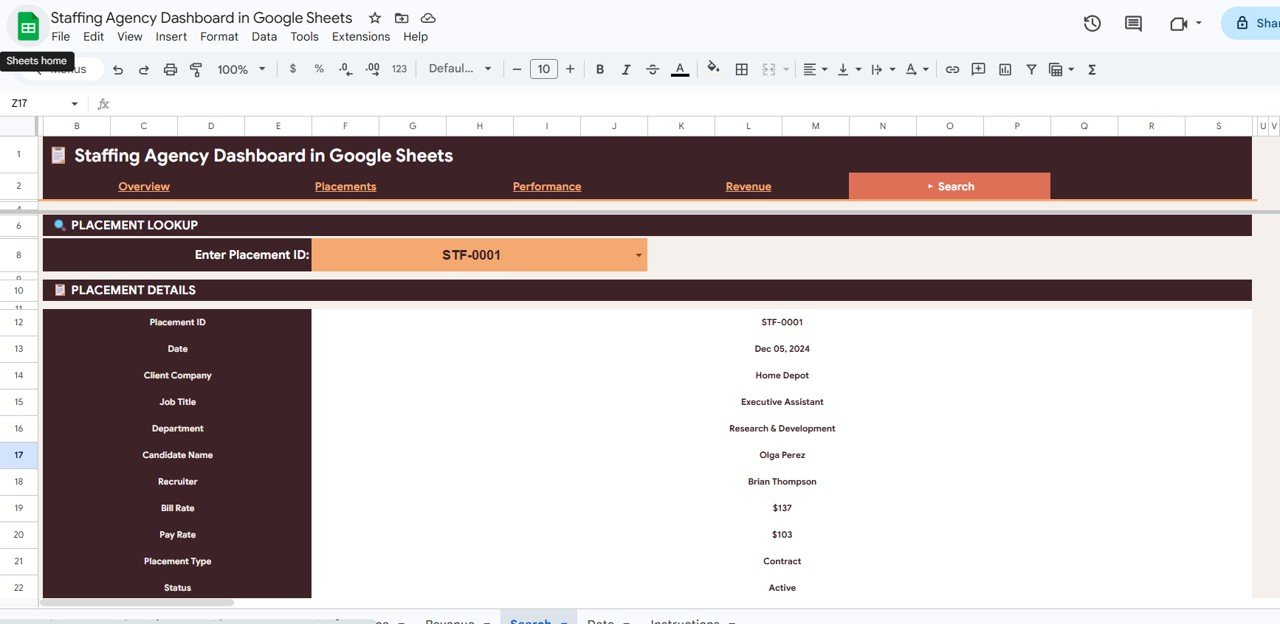
Search Sheet Tab
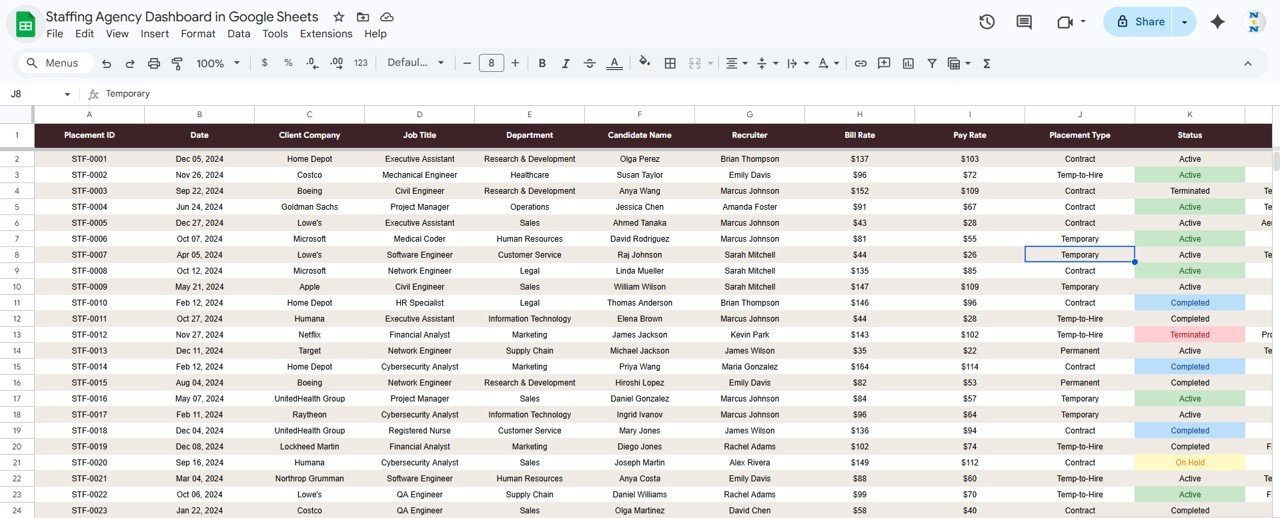
6 — Data Sheet
The Data Sheet is where you enter or paste your placement records. All dashboard pages, KPI cards, and charts update automatically from this single data source. No formulas to maintain — just add rows in the specified column format.
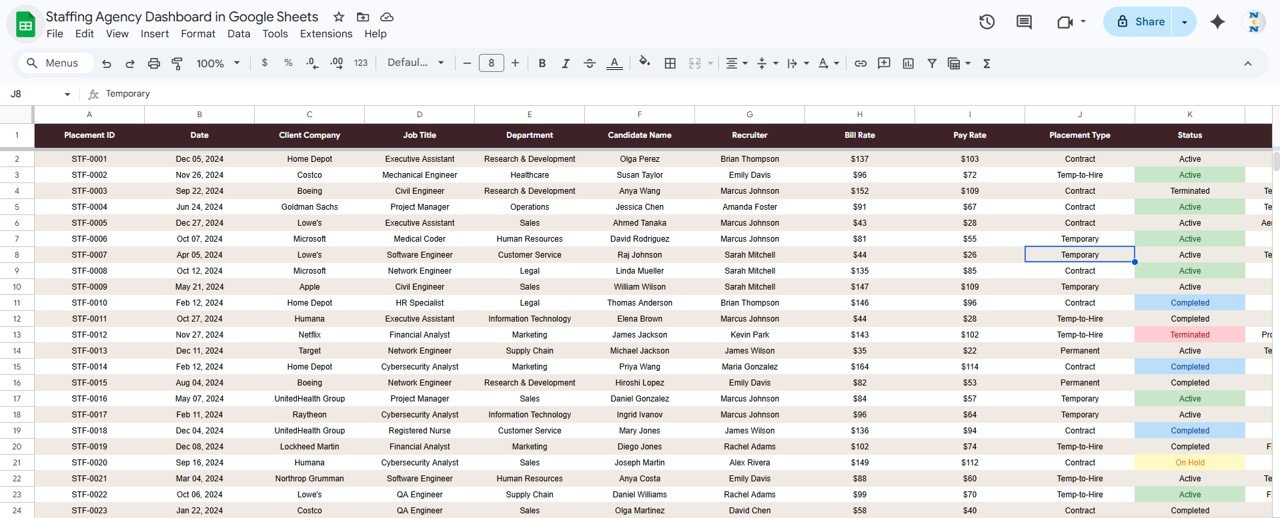
Data Sheet Tab
Staffing Agency Dashboard in Google Sheets vs. Microsoft Excel Dashboard vs. Bullhorn / Zoho Recruit — Feature Comparison
| Feature | Staffing Agency Dashboard in Google Sheets | Microsoft Excel Dashboard | Bullhorn / Zoho Recruit |
|---|---|---|---|
| Cost | $9.99 one-time | $17.99 one-time | $30–$99 / user / month |
| Platform | Google Sheets (free, browser-based) | Microsoft Excel (license needed) | Web-based ATS |
| Setup time | Under 10 minutes | Under 10 minutes | 2–4 weeks onboarding |
| Real-time team collaboration | ✅ Built-in, simultaneous editing | ❌ File-based | ✅ |
| Mobile access | ✅ Google Sheets app | ⚠️ Limited | ✅ |
| Customizable fields | ✅ Fully editable | ✅ | ⚠️ Limited by plan |
| Share with link | ✅ One-click sharing | ❌ File attachment | ✅ |
| Year-1 cost at 5 users | $9.99 | $17.99 | $1,800–$5,940 |
| No subscription | ✅ One-time only | ✅ | ❌ |
For staffing firms that want Bullhorn-grade analytics with real-time collaboration and no monthly fees, the Staffing Agency Dashboard in Google Sheets sits in the sweet spot.
Who Should Use This Template
Perfect for:
- Staffing agency owners with 2–50 recruiters tracking placements, bill rates, and margins
- Recruitment operations managers who need a collaborative, cloud-based dashboard
- In-house talent acquisition leaders reporting to the CHRO or founder
- Solo recruiters who want analytics without $30–$99/month SaaS fees
Not a fit if:
- You need an enterprise ATS with CV parsing, SOC 2, and SSO
- Your agency has 500+ recruiters needing row-level security
- Your team exclusively uses Microsoft Excel and doesn’t use Google Workspace
Real-World Use Cases
Neha runs a 15-person IT staffing agency in Pune. She uses the Staffing Agency Dashboard in Google Sheets every Monday to review placements, check avg bill rate by recruiter, and share a live link with her ops manager. She cancelled her $49/month Zoho Recruit analytics add-on after switching.
James leads business development at a contract staffing firm in Chicago. He filters the Revenue page by industry before client pitches, using bill rate trend data to justify premium pricing. The dashboard gives him concrete numbers instead of guesswork.
Priya is a solo recruitment consultant placing finance candidates on contract. She uses the Search Sheet during client calls and the Performance page to track her own monthly output. The $9.99 dashboard replaced a $49/month reporting tool.
Watch the step-by-step video tutorial:
🎥 Visit our YouTube channel: Youtube.com/@NeoTechNavigators


Reviews
There are no reviews yet.