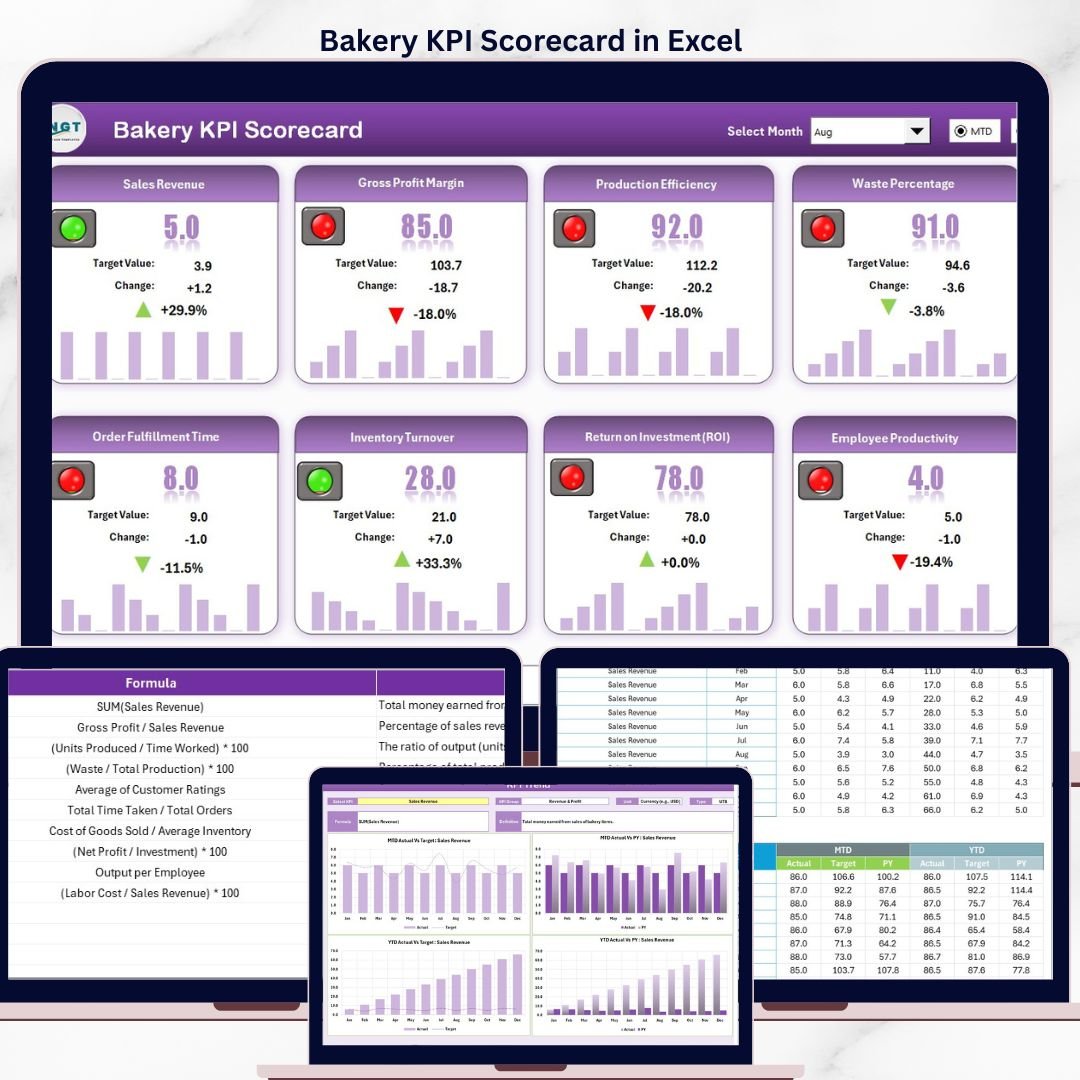
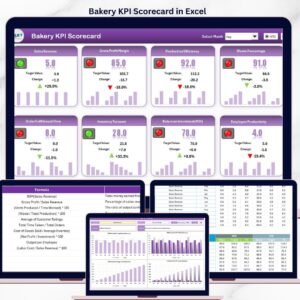
The Bakery KPI Scorecard in Excel tracks 15+ bakery KPIs across 4 worksheet tabs, with MTD and YTD comparisons, Actual vs Target values, and color-coded performance indicators. Setup takes under 10 minutes — enter your KPI definitions, input your monthly data, and every scorecard metric recalculates automatically.
🌍 Join 8,400+ teams across 40+ countries using NextGenTemplates to monitor bakery operations, food production quality, and retail performance without paying $39–$199 per user per month for SaaS platforms like Toast POS or MarketMan.
✅ Instant download · One-time payment · No subscription · No per-user fees · Lifetime access
Bakery KPI Scorecard in Excel
🔑 Key Features of Bakery KPI Scorecard in Excel
📌 Month, MTD, and YTD Dropdown Filters — The scorecard sheet includes dropdown menus that let you switch between monthly, month-to-date, and year-to-date views instantly. Every KPI value refreshes automatically based on your selection, giving you a real-time snapshot of bakery performance across any time frame.
📌 Actual vs Target Comparison — Each KPI row displays actual performance alongside the target value for that period. You can see at a glance whether your bakery is hitting production targets, revenue goals, waste reduction benchmarks, and customer satisfaction scores.
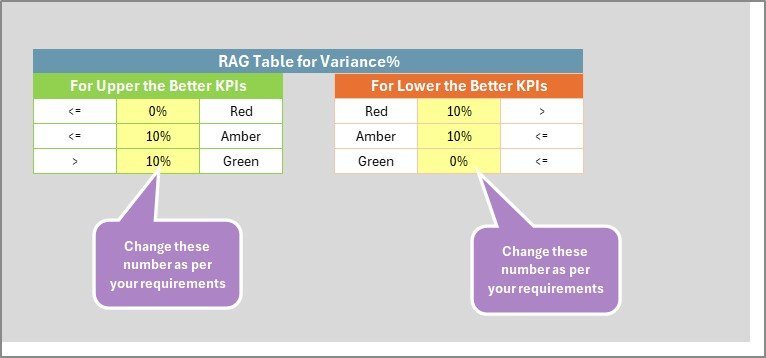
📌 Color-Coded Visual Indicators — Conditional formatting highlights KPIs in green, amber, or red based on how actual numbers compare to targets. This traffic-light system makes it easy for bakery owners and managers to spot underperforming areas without reading every number.
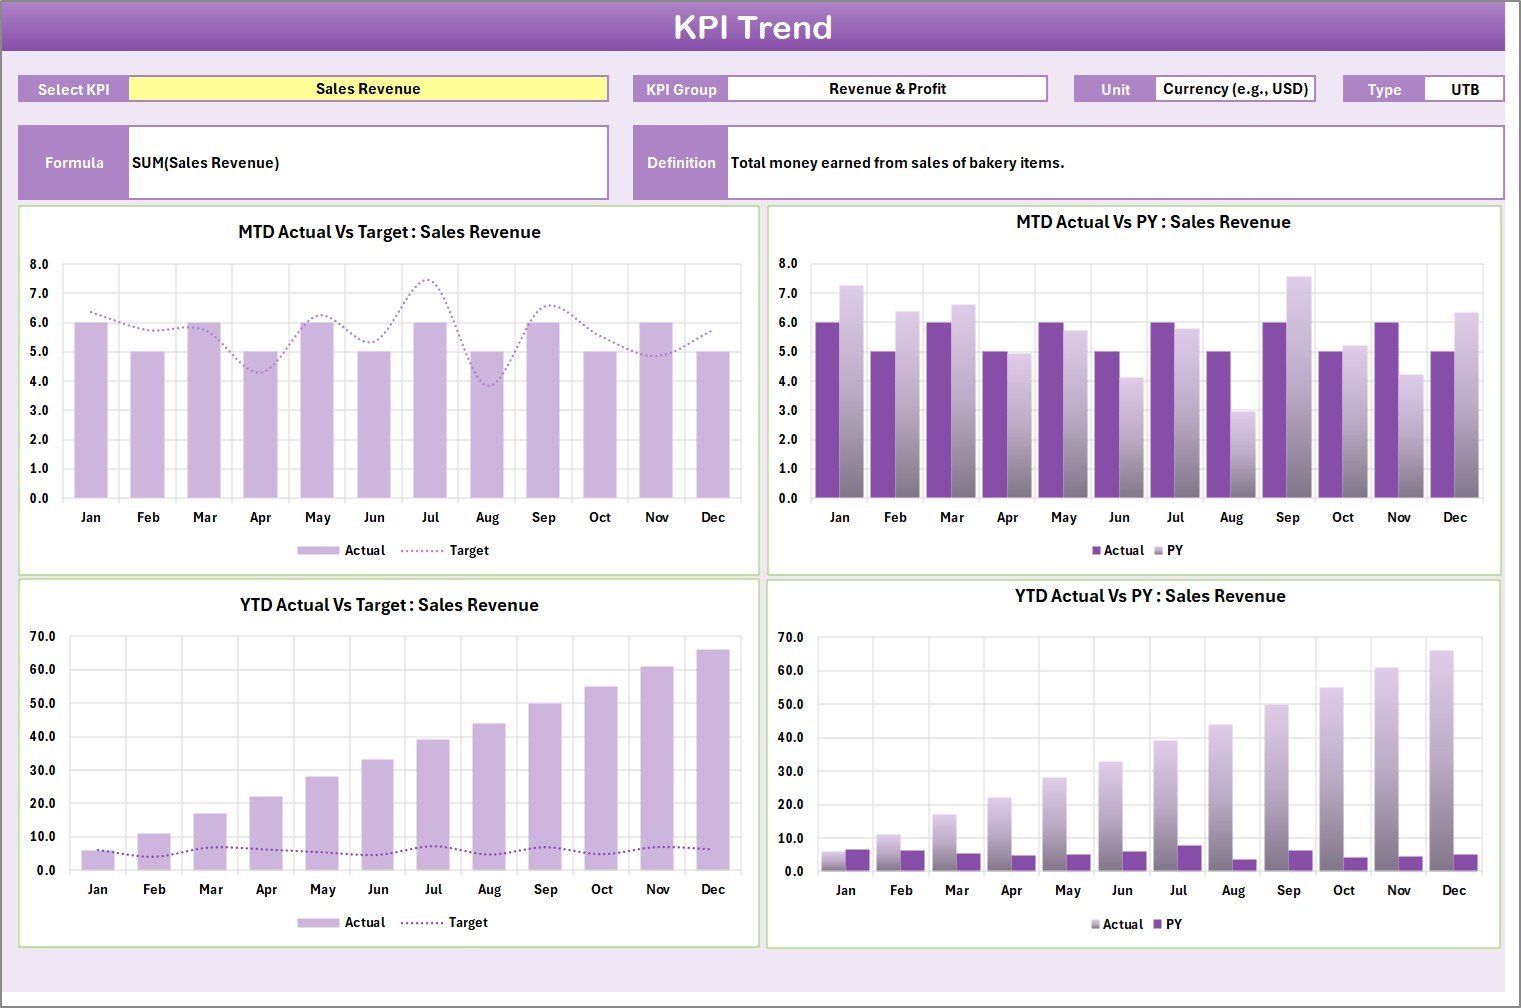
📌 KPI Trend Analysis with Charts — The KPI Trend sheet tab lets you select any KPI from a dropdown and instantly view its MTD and YTD trend chart showing Actual, Target, and Prior Year (PY) numbers side by side. You also see the KPI Group, Unit, Type (Lower the Better or Upper the Better), Formula, and Definition for the selected metric.
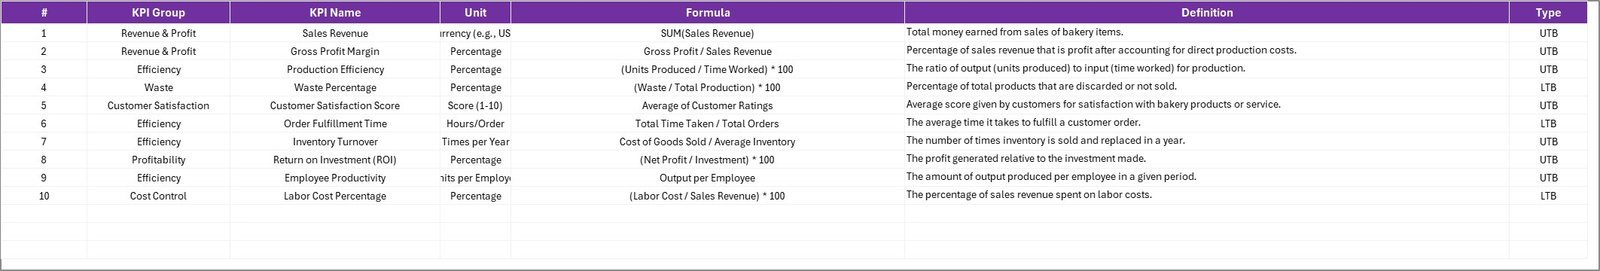
📌 Flexible KPI Definition Sheet — Define unlimited bakery-specific KPIs by entering the KPI Name, KPI Group, Unit, Formula, and Definition. This sheet drives the entire scorecard, so you can customize it for any bakery operation — from artisan bread shops to large-scale commercial bakeries.
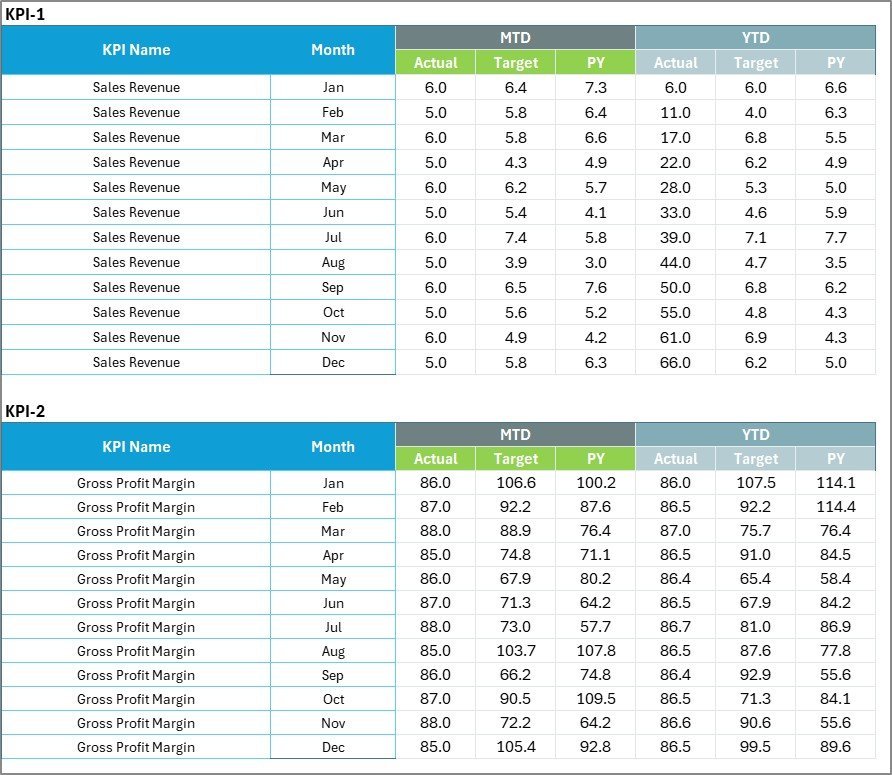
📌 Ready-to-Use Input Data Sheet — Enter monthly actual values, target values, and prior year numbers in a structured format. The data feeds directly into the scorecard and trend charts, keeping everything synchronized and up to date as you add new monthly results.
📦 What’s Inside the Bakery KPI Scorecard in Excel
This template includes 4 dedicated worksheet tabs, each designed for a specific function in bakery performance tracking:
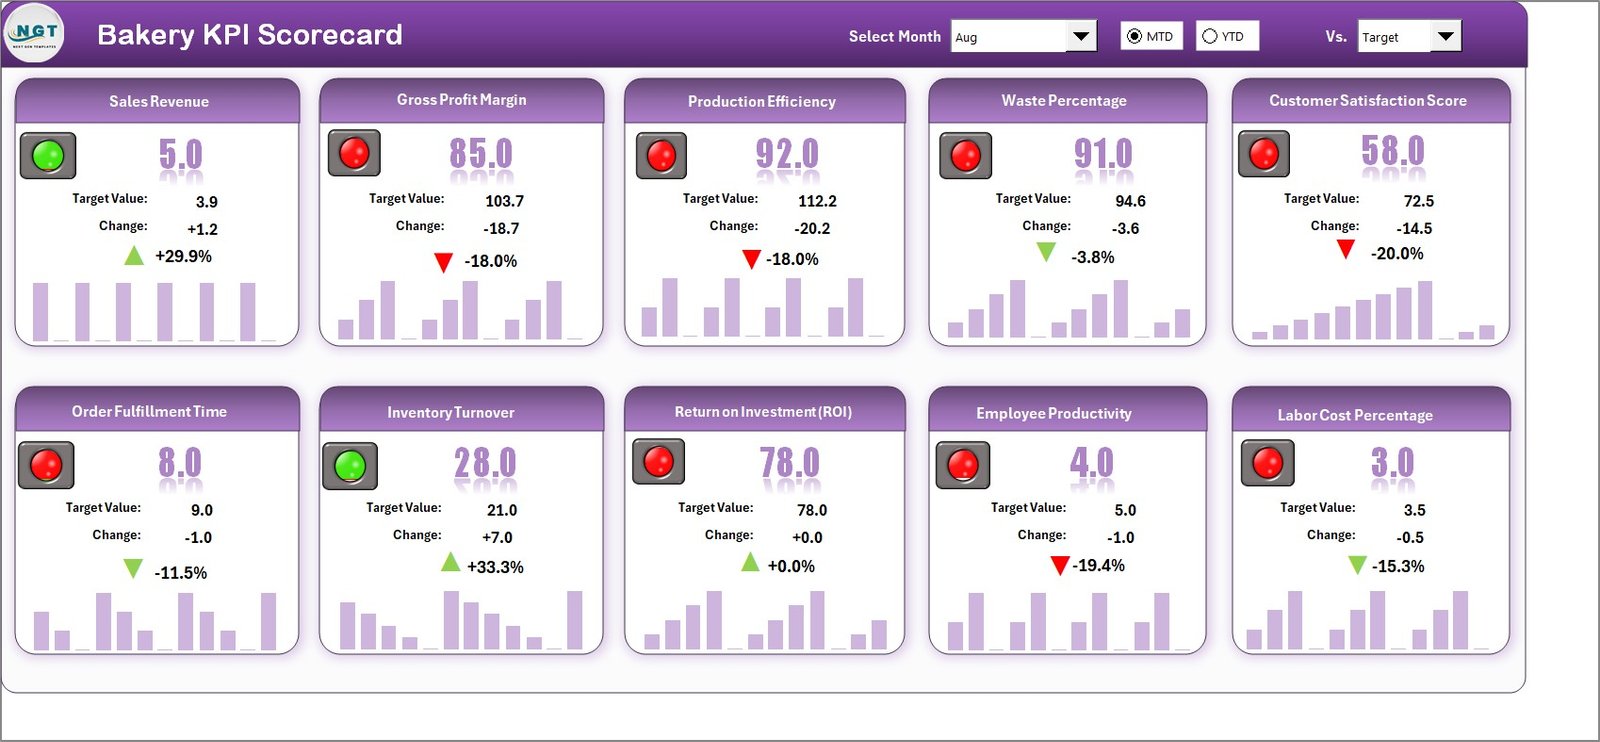
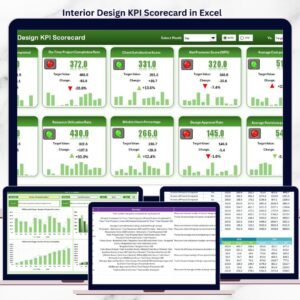
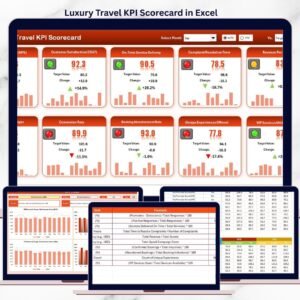
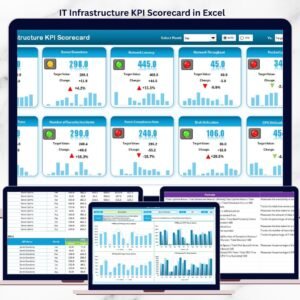
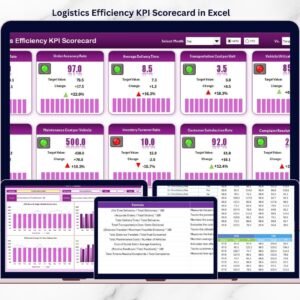
📊 Scorecard Sheet — The main interface displaying all KPIs with Actual vs Target values, MTD and YTD comparisons, and color-coded performance status. Use the dropdown menus to filter by month or time period.

KPI Trend Sheet
📈 KPI Trend Sheet — Select any KPI from the dropdown on cell C3 to view its group, unit, type, formula, and definition. The MTD and YTD trend charts plot Actual, Target, and Prior Year lines for visual comparison over time.

Input Data Sheet
📋 Input Data Sheet — Record actual values, targets, and prior year metrics for each KPI. Update data monthly as new results come in to keep the scorecard current and accurate.

KPI Definition Sheet
📝 KPI Definition Sheet — Enter each KPI’s name, group, unit of measurement, formula, and definition. This sheet controls how every metric appears across the scorecard and trend views.
📊 Bakery KPI Scorecard in Excel vs. Google Sheets Scorecard vs. Toast POS Analytics — Where This Fits
| Feature | Bakery KPI Scorecard in Excel | Google Sheets Scorecard | Toast POS Analytics |
|---|---|---|---|
| Cost | $12.99 one-time | $8.99–$9.99 one-time | $69–$165/month |
| Platform | Microsoft Excel (desktop) | Google Sheets (browser) | Cloud SaaS |
| Setup Time | Under 10 minutes | Under 10 minutes | 2–4 weeks onboarding |
| Real-Time Team Collaboration | Via OneDrive/SharePoint | Native real-time | Yes |
| Mobile Access | Excel Mobile app | Any browser | Yes (dedicated app) |
| Customizable KPIs | Unlimited — you define all KPIs | Unlimited | Limited to POS data fields |
| MTD/YTD Trend Charts | Yes — built in | Yes | Basic reporting |
| Year-1 Cost at 5 Users | $12.99 total | $8.99 total | $4,140–$9,900 |
| Offline Access | Full offline | Limited offline | No |
For bakery owners who want KPI tracking without monthly SaaS fees or complex POS integrations, the Bakery KPI Scorecard in Excel sits in the sweet spot.
👥 Who This Template Is For — and Who It’s Not For
✅ This template is built for:
- Bakery owners and managers tracking production, revenue, waste, and quality KPIs
- Food production supervisors monitoring daily and monthly performance targets
- F&B consultants delivering KPI performance reports to bakery clients
- Small-to-mid-size bakeries (1–50 employees) that need structured KPI tracking without SaaS costs
❌ This template is NOT for:
- Large bakery chains (100+ locations) needing real-time POS-integrated analytics across all outlets
- Teams that need automated data feeds from IoT oven sensors or production line equipment
- Users without Microsoft Excel — consider the Hospitality KPI Scorecard in Google Sheets instead
⚙️ How to Use the Bakery KPI Scorecard in Excel
1️⃣ Open the downloaded .xlsx file in Microsoft Excel (2016 or later recommended).
2️⃣ Go to the KPI Definition sheet and enter your bakery-specific KPI names, groups, units, formulas, and definitions.
3️⃣ Navigate to the Input Data sheet and enter monthly actual values, target values, and prior year numbers for each KPI.
4️⃣ Switch to the Scorecard sheet and use the dropdown menus to view performance by month, MTD, or YTD — all values update automatically.
5️⃣ Open the KPI Trend sheet, select any KPI from the dropdown, and review the MTD and YTD trend charts comparing Actual vs Target vs Prior Year.
💼 Real-World Use Cases
Marco owns a neighborhood bakery in Chicago with 8 employees. He uses the Bakery KPI Scorecard in Excel to track daily bread production yield, ingredient waste percentage, and average revenue per customer. Each month he enters actuals into the Input Data sheet and reviews the traffic-light scorecard to see which metrics are falling below target — saving him from paying $165/month for Toast POS analytics he barely used.
Priya manages operations for a 3-location artisan bakery chain in London. She customized the KPI Definition sheet with 18 bakery-specific metrics including dough fermentation consistency, order fulfillment rate, and customer return rate. The YTD trend charts help her present quarterly performance reviews to the company owner with clear visuals instead of raw spreadsheets.
Carlos is an F&B consultant in São Paulo. He uses the template as a client delivery tool — replacing sample KPIs with each bakery client’s specific metrics. The professional scorecard layout impresses clients and saves him 6+ hours per engagement compared to building custom reports from scratch.
❓ Frequently Asked Questions
What KPIs can I track with the Bakery KPI Scorecard in Excel?
The Bakery KPI Scorecard in Excel lets you define and track unlimited bakery KPIs including production yield, ingredient waste, revenue per square foot, customer satisfaction, order accuracy, and labor cost percentage. You control all KPI definitions in the dedicated Definition sheet.
How long does it take to set up the Bakery KPI Scorecard?
Setup takes under 10 minutes. Enter your KPI definitions, input your first month of data, and the scorecard auto-calculates Actual vs Target with color-coded indicators. No formulas to write and no macros to enable.
Can I compare monthly, MTD, and YTD performance?
Yes. The Scorecard sheet includes dropdown menus for Month, MTD, and YTD views. Select any option and all KPI values refresh automatically to show performance for that specific time frame.
Does this template work on Mac?
Yes. The Bakery KPI Scorecard in Excel uses standard formulas and conditional formatting — no VBA macros required. It works on Excel for Mac, Excel for Windows, and Excel Online via OneDrive or SharePoint.
How does this compare to Toast POS or MarketMan analytics?
Toast POS costs $69–$165 per month and MarketMan starts at $239 per month. The Bakery KPI Scorecard in Excel costs $12.99 one-time with lifetime access. While SaaS tools offer POS integration, this scorecard gives you full KPI customization with zero recurring costs.
Can I add more KPIs later?
Yes. Simply add new rows to the KPI Definition sheet and the corresponding Input Data sheet. The scorecard and trend charts expand to include any new metrics you define — no structural changes needed.
Is there a Google Sheets version available?
Yes. Check out the Hospitality KPI Scorecard in Google Sheets for a cloud-based alternative. Also explore our Food Manufacturing KPI Scorecard in Excel for food production-specific tracking.
👤 About the Author
Built by PK — Microsoft Certified Professional with 15+ years of Excel, Google Sheets, and Power BI experience. Founder of NextGenTemplates, reaching 300K+ subscribers across YouTube channels (@PK-AnExcelExpert, @NextGenTemplates, @NeoTechNavigators). Every template is hand-built and tested before release.
🔗 Explore Related Templates
📌 Food Manufacturing KPI Scorecard in Excel — Track food production KPIs including yield, defect rate, and compliance metrics.
📌 Restaurant P and L Dashboard in Excel — Monitor restaurant revenue, food cost, labor cost, and net profit across multiple locations.
📌 Coffee Chains Dashboard in Excel — Analyze coffee chain operations with detailed sales, cost, and store-level performance tracking.
📌 Winery KPI Scorecard in Excel — Track winery production, quality, and revenue KPIs with the same scorecard format.
📌 Also available: Hospitality KPI Scorecard in Google Sheets for a browser-based alternative.
📌 Browse all KPI Dashboard Templates on NextGenTemplates.
📖 Click here to read the Detailed Blog Post
🎥 Visit our YouTube channel for step-by-step video tutorials


Reviews
There are no reviews yet.