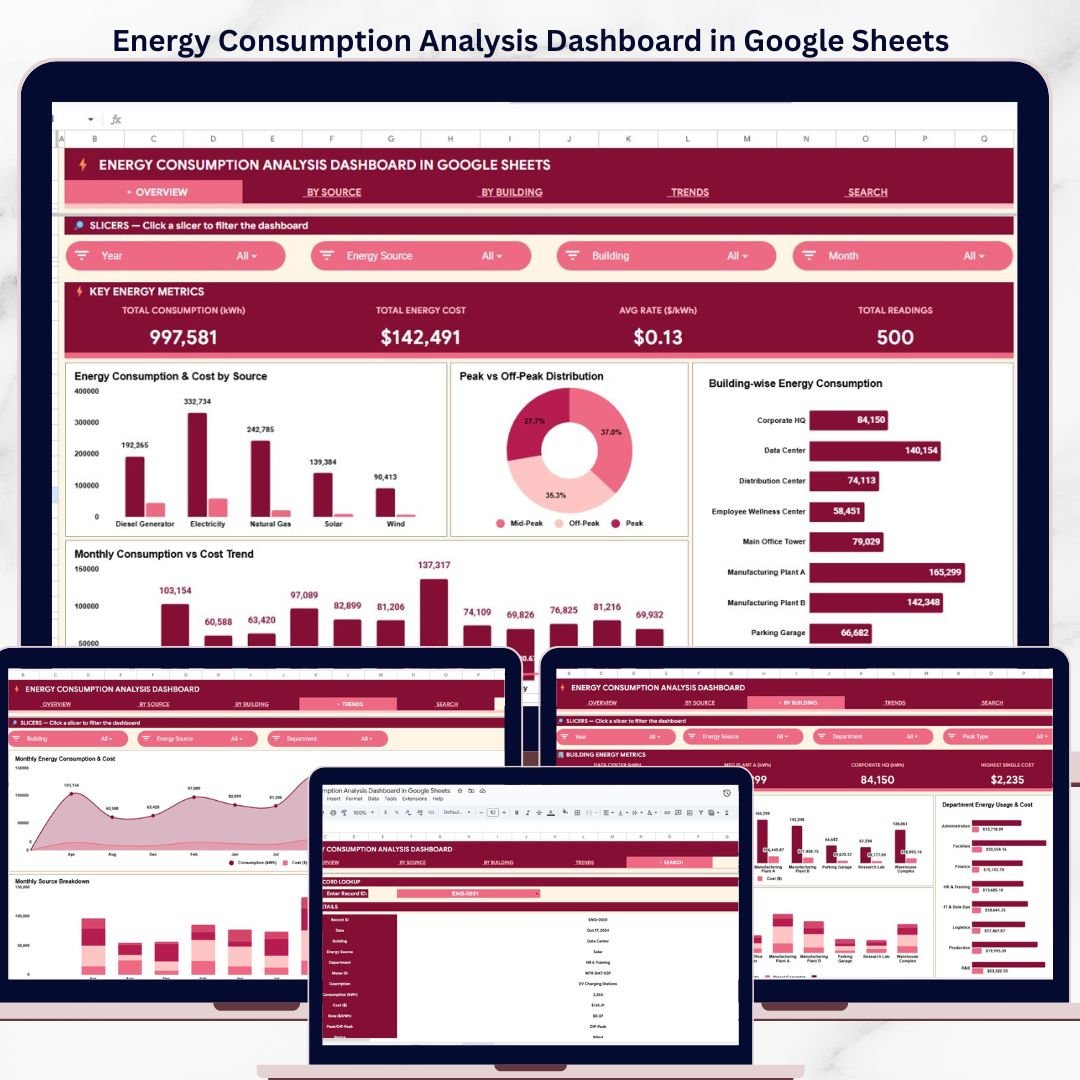


The Energy Consumption Analysis Dashboard in Google Sheets tracks 4 headline KPIs across 6 interactive pages, with multiple pre-built charts covering source-level, building-level, and monthly trend analysis, plus a record lookup Search Sheet. Setup takes under 10 minutes — open the PDF guide, click the Google Sheets copy link, paste your meter readings into the Data Sheet, and every card, chart, and filter updates automatically.
🌍 Join 8,400+ teams in 40+ countries using NextGenTemplates to replace paid SaaS tools with one-time-purchase Excel, Google Sheets, Power BI, and HTML templates.
✅ Instant download · One-time payment · No subscription · No per-user fees · Lifetime access
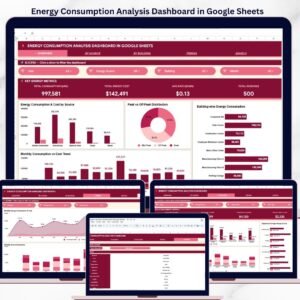
Energy Consumption Analysis Dashboard in Google Sheets
🔑 Key Features of Energy Consumption Analysis Dashboard in Google Sheets
⚡ 4 KPI cards on the Overview page — Total Consumption (kWh), Total Energy Cost, Avg Rate ($/kWh), and Total Readings — give facility managers and energy analysts instant visibility into their organization’s energy footprint. These four metrics are the same headline indicators used in commercial building energy audits and corporate sustainability reports.
📊 Multiple charts across 6 analysis pages covering Overview, By Source Analysis, By Building Analysis, Trends Analysis, Search Sheet, and Data Sheet. Each chart is formula-driven and updates the moment you add or modify records in the Data Sheet — no manual chart editing required.
🔍 Multiple slicers for fast, filtered views let you drill from a company-wide view down to a single energy source, building, department, or peak/off-peak status in two clicks. Built for facility managers, sustainability officers, and operations teams who need different slices of the same energy dataset without rebuilding a report.
📋 Record Lookup (Search Sheet) — select any Record ID from the dropdown and instantly pull every detail for that meter reading, including Building, Energy Source, Department, Meter ID, Consumption (kWh), Cost ($), Rate ($/kWh), Peak/Off-Peak status, and more. Eliminates the need to scroll through hundreds of rows manually.
🖼️ Built entirely in Google Sheets — no add-ons, no macros, no monthly fees. Opens in any browser with a Google account, shareable via link, and editable by multiple team members simultaneously.
📦 What’s Inside the Energy Consumption Analysis Dashboard in Google Sheets
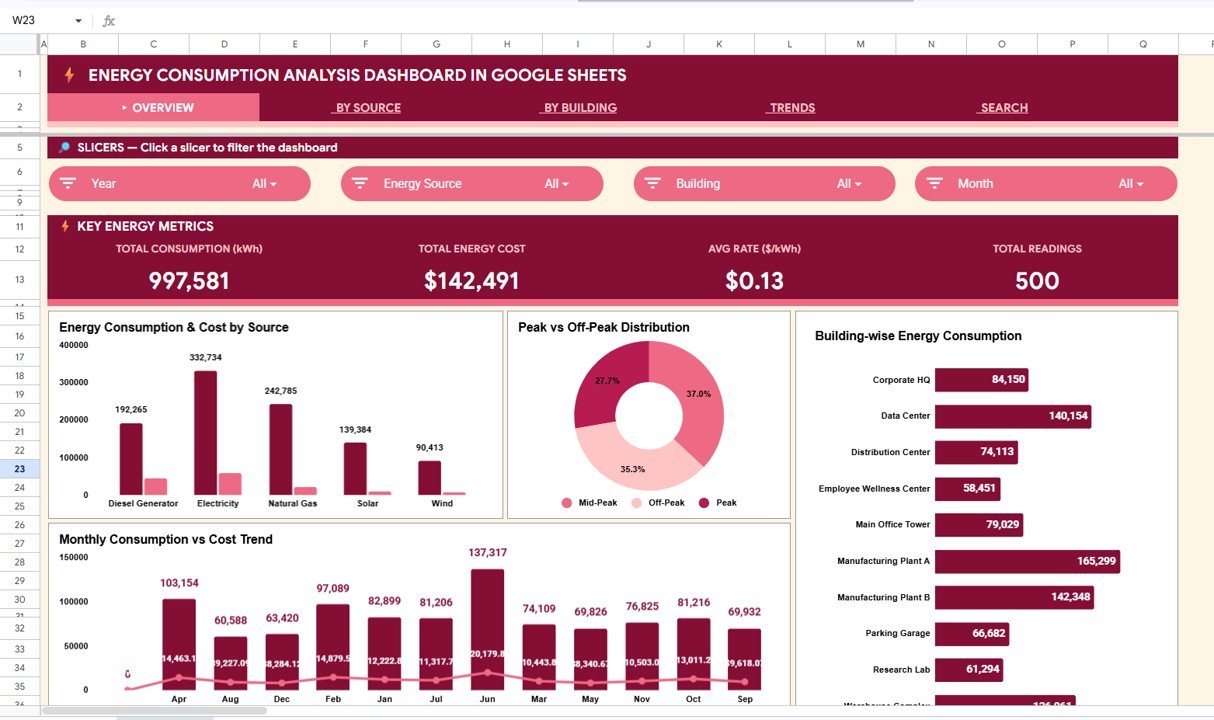
📈 1 — Overview Page. 4 KPI cards (Total Consumption kWh, Total Energy Cost, Avg Rate $/kWh, Total Readings) paired with charts showing Energy Consumption & Cost by Source, Peak vs Off-Peak Distribution, Building-wise Energy Consumption, and Monthly Consumption vs Cost Trend. Multiple slicers let you filter the entire dashboard instantly.
Overview Page
🔋 2 — By Source Analysis. Breaks down energy data by source type with metrics for Electricity (kWh), Natural Gas (kWh), Solar (kWh), and Wind (kWh). Charts show Cost Distribution by Energy Source, Consumption & Cost by Source, and Monthly Consumption by Source — helping you identify which energy sources are the most cost-effective and which are driving your bill.
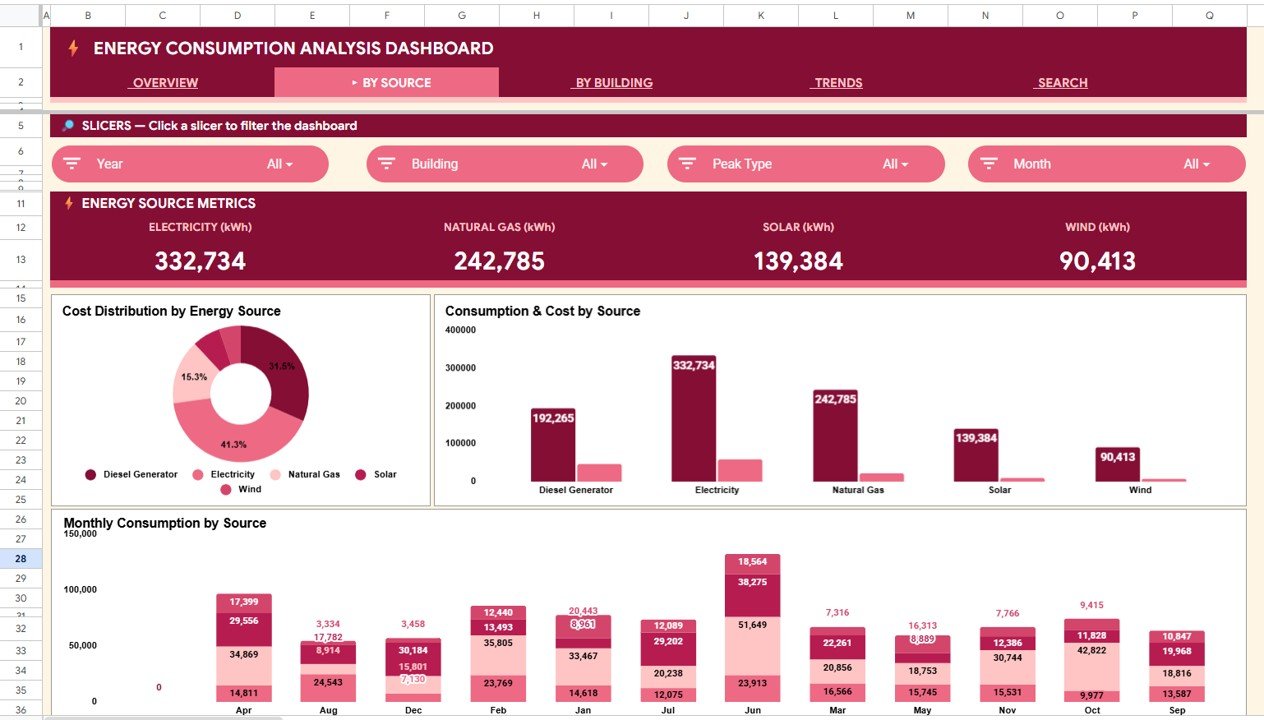
By Source Analysis
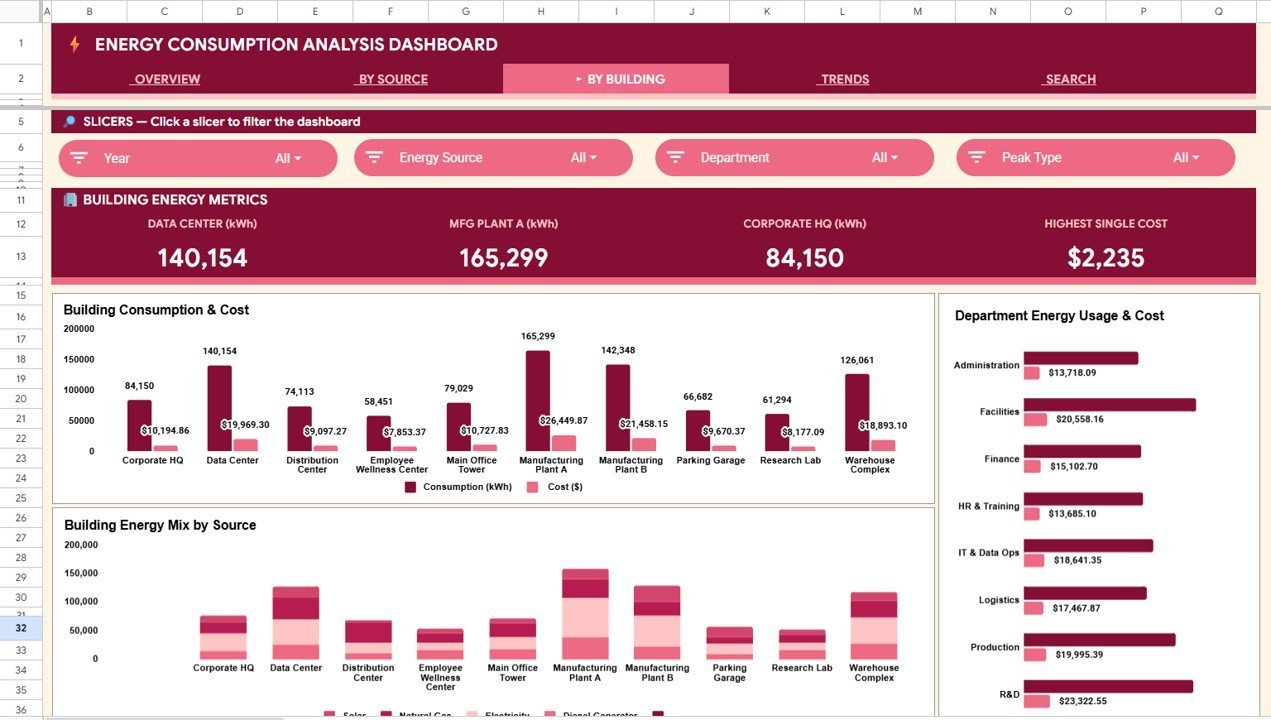
🏢 3 — By Building Analysis. Compares energy consumption across buildings with KPI cards for Data Center (kWh), MFG Plant A (kWh), Corporate HQ (kWh), and Highest Single Cost. Charts display Building Consumption & Cost, Department Energy Usage & Cost, and Building Energy Mix by Source — so you can pinpoint which buildings and departments are the largest energy consumers.

By Building Analysis
📅 4 — Trends Analysis. Tracks Monthly Energy Consumption & Cost and Monthly Source Breakdown over time. Use this page to spot seasonal patterns, identify cost spikes, and forecast future energy budgets based on historical consumption data.
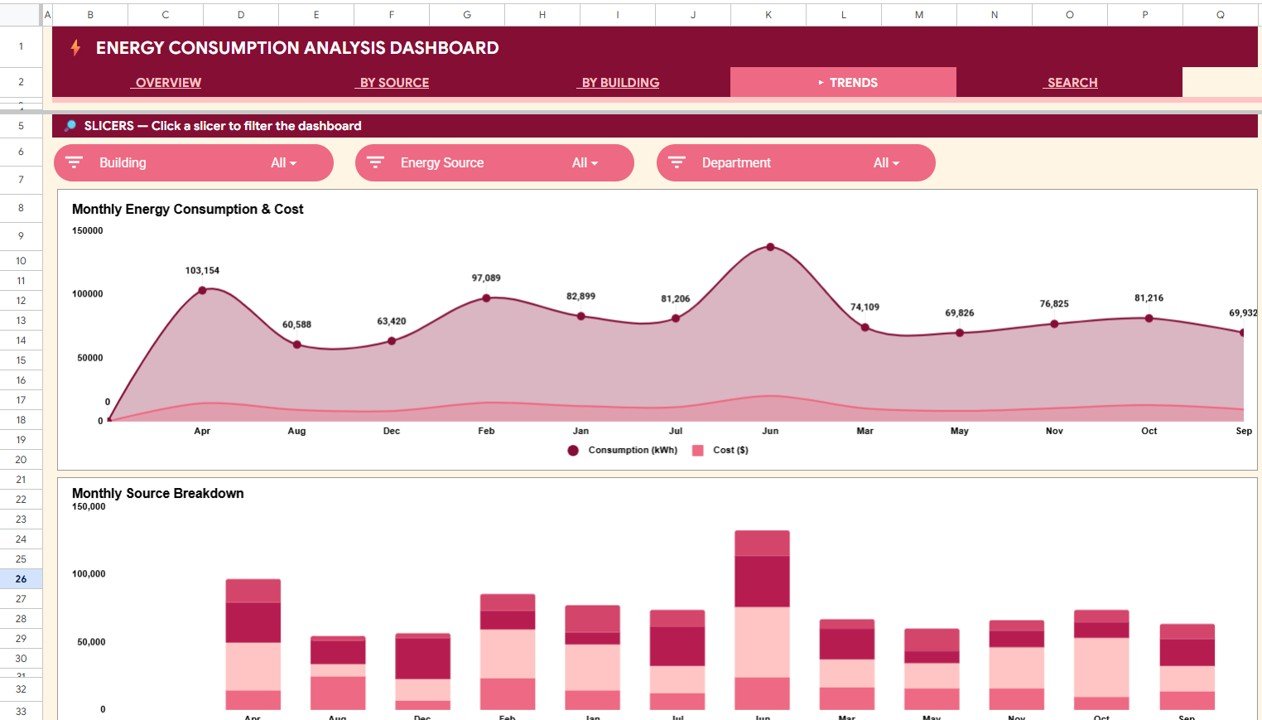
Trends Analysis
🔍 5 — Search Sheet. An Energy Record Lookup feature where you select a Record ID (e.g., ENG-0001) from the dropdown and the dashboard instantly pulls every detail: Record ID, Date, Building, Energy Source, Department, Meter ID, Description, Consumption (kWh), Cost ($), Rate ($/kWh), Peak/Off-Peak, and Status.
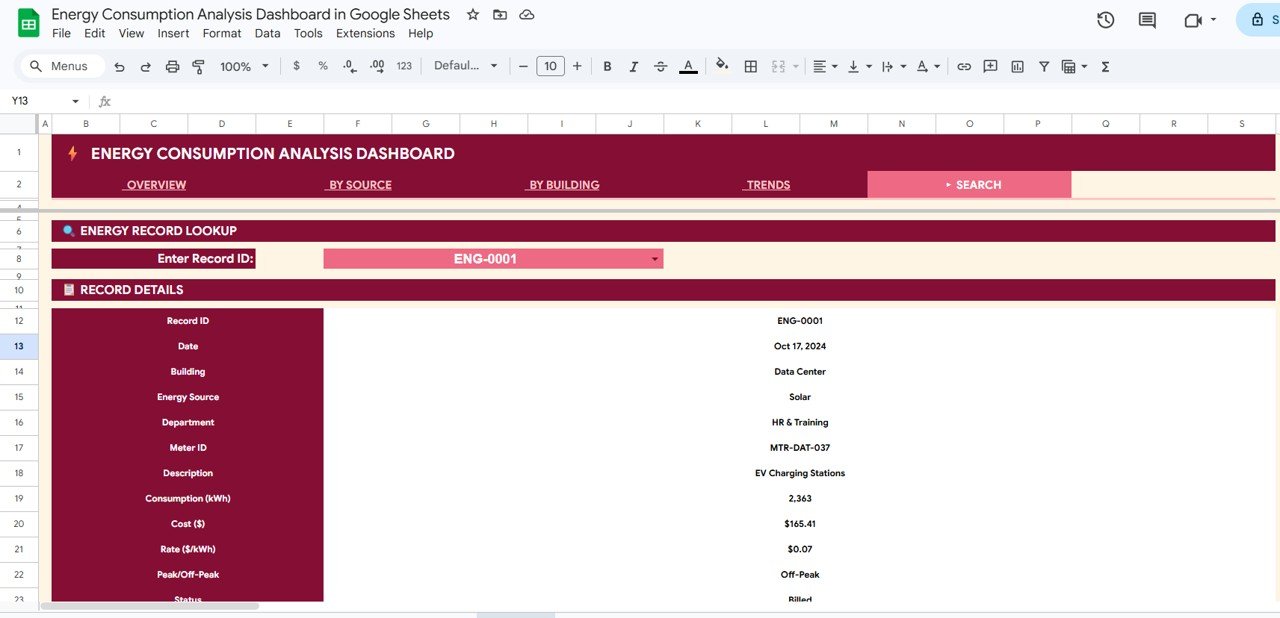
Search Sheet
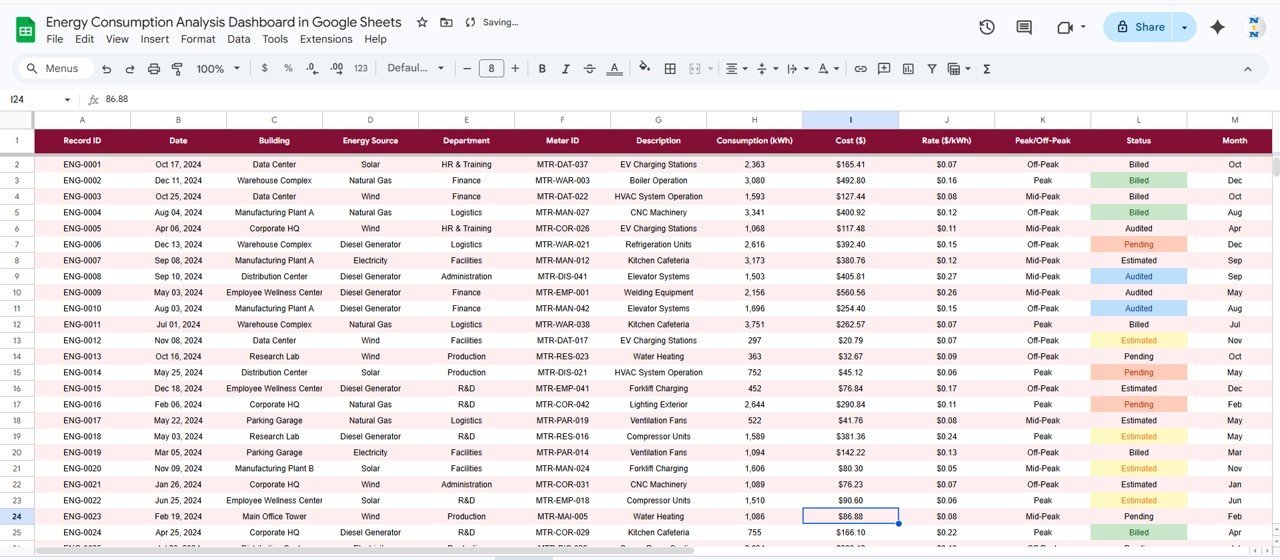
📋 6 — Data Sheet. The single input sheet for the entire dashboard. Add your meter readings in the same column format and every chart, card, and analysis page updates automatically.
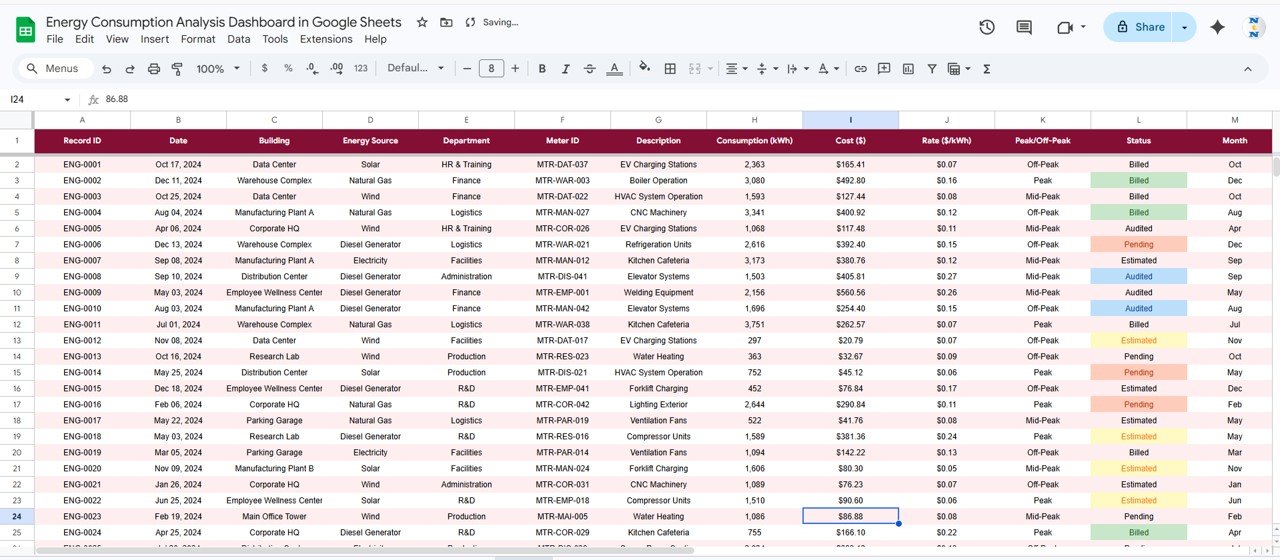
Data Sheet
📊 Energy Consumption Analysis Dashboard in Google Sheets vs. Microsoft Excel vs. Paid Energy SaaS — Where This Fits
| Feature | Energy Consumption Analysis Dashboard in Google Sheets | Microsoft Excel Dashboard | Paid Energy SaaS (EnergyCAP / Wattics / UtilityAPI) |
|---|---|---|---|
| Cost | $9.99 one-time | $17.99 one-time | $50–$500 / user / month |
| Platform | Google Sheets (any browser) | Microsoft Excel (desktop + web) | Cloud SaaS only |
| Setup time | Under 10 minutes | Under 10 minutes | 4–12 weeks onboarding |
| Real-time team collaboration | ✅ Built-in (Google Drive) | ⚠️ OneDrive only | ✅ Paid seat per viewer |
| Mobile access | ✅ Google Sheets app | ⚠️ Limited on mobile | ✅ |
| Customizable fields | ✅ Fully editable | ✅ Fully editable | ⚠️ Vendor-controlled |
| Share with link | ✅ One-click share | ⚠️ File attachment | ✅ Paid seat per viewer |
| Source-level + building-level analysis | ✅ Out of the box | ✅ | ⚠️ Higher tier only |
| Year-1 cost at 5 users | $9.99 | $17.99 | $3,000–$30,000 |
For facility teams that want building-level and source-level energy visibility without paying $3K–$30K a year for an enterprise SaaS tool, the Energy Consumption Analysis Dashboard in Google Sheets sits in the sweet spot.
👥 Who This Template Is For — and Who It’s Not For
✅ This template is built for:
- Facility managers at commercial buildings, campuses, and manufacturing plants tracking energy usage across 2–20 buildings
- Sustainability officers preparing monthly or quarterly energy consumption reports for leadership
- Operations teams comparing electricity, natural gas, solar, and wind consumption to optimize the energy mix
- Small-to-mid energy consulting firms building client-ready energy analysis reports
- Building owners tracking peak vs off-peak consumption patterns to negotiate better utility rates
❌ This template is NOT for:
- Utility companies needing real-time SCADA integration with live meter feeds
- Enterprise teams requiring SOC 2-audited, SSO-gated cloud energy management platforms
- Organizations needing automated utility bill parsing and OCR from scanned invoices
⚙️ How to Use the Energy Consumption Analysis Dashboard in Google Sheets
- Open the PDF guide included in your download and click the Google Sheets copy link to create your own editable copy in Google Drive.
- Navigate to the Data Sheet tab and replace the sample meter readings with your own energy consumption records — keep the same column order.
- Head to the Overview Page to see all 4 KPI cards and charts update automatically. Use the slicers to filter by source, building, department, or status.
- Explore the By Source Analysis, By Building Analysis, and Trends Analysis pages for detailed breakdowns.
- Use the Search Sheet to look up individual energy records by selecting a Record ID from the dropdown.
- Share the Google Sheets file with your team via link for real-time collaborative access.
💼 Real-World Use Cases
Ravi manages facilities for a 5-building corporate campus in Bangalore. He uses the Energy Consumption Analysis Dashboard in Google Sheets to track monthly kWh across the Data Center, two office buildings, a cafeteria, and the parking structure. The By Building Analysis page helps him identify which building exceeds its quarterly energy budget, and the Trends page shows seasonal AC load patterns — all shared with the CFO via a single Google Sheets link.
Emily is a sustainability analyst at a mid-sized manufacturing firm in Ohio. She tracks electricity, natural gas, and solar output using the By Source Analysis page. Each month she updates 300+ meter readings in the Data Sheet, and the Overview cards show total consumption, cost, and the average rate per kWh without her touching a single formula.
Carlos runs an energy consulting practice serving 8 commercial property clients. He duplicates the Google Sheet for each client, drops in their utility data, and walks building owners through peak vs off-peak distribution patterns during quarterly reviews — replacing an $89/user/month energy management SaaS with a one-time $9.99 purchase.
❓ Frequently Asked Questions
What KPIs does the Energy Consumption Analysis Dashboard in Google Sheets track?
The Energy Consumption Analysis Dashboard in Google Sheets tracks 4 headline KPIs — Total Consumption (kWh), Total Energy Cost, Avg Rate ($/kWh), and Total Readings — plus source-level, building-level, department-level, and monthly trend breakdowns across 6 interactive pages.
How long does setup take?
Setup takes under 10 minutes. Open the PDF guide, click the Google Sheets copy link, paste your meter readings into the Data Sheet, and every KPI card, chart, and slicer updates automatically. No formulas to write.
Which energy sources does this dashboard track?
The By Source Analysis page tracks Electricity, Natural Gas, Solar, and Wind consumption in kWh, along with cost distribution and monthly consumption trends for each source. You can add or rename sources in the Data Sheet to match your facilities.
How does this compare to paid energy management SaaS like EnergyCAP or Wattics?
EnergyCAP and Wattics typically cost $50–$500 per user per month with 4–12 week implementations. The Energy Consumption Analysis Dashboard in Google Sheets is $9.99 one-time, sets up in under 10 minutes, and covers the reporting layer most facility teams actually need — without per-user fees or long-term contracts.
Can I customize the buildings, departments, and energy sources?
Yes. Every field in the Data Sheet is fully editable. Add new buildings, rename departments, or introduce additional energy sources — the dashboard charts and KPI cards pick up the changes automatically when you update the data.
Does this dashboard work on mobile devices?
Yes. Google Sheets works on the Google Sheets mobile app for iOS and Android. The dashboard is accessible and functional on tablets and smartphones, though the full desktop browser experience provides the most complete view.
Do I get future updates?
Yes. Every NextGenTemplates purchase includes free updates to the same template file when improvements are released.
👤 About the Author
Built by PK — Microsoft Certified Professional with 15+ years of Excel, Google Sheets, and Power BI experience. Founder of NextGenTemplates, reaching 300K+ subscribers across YouTube channels (@PK-AnExcelExpert, @NextGenTemplates, @NeoTechNavigators). Every template is hand-built and tested before release.
🔗 Explore Related Templates
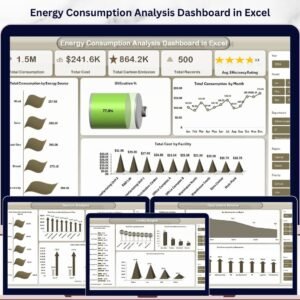
⚡ Energy Consumption Analysis Dashboard in Excel — the Excel version with pivot tables and slicers for teams on the Microsoft stack.
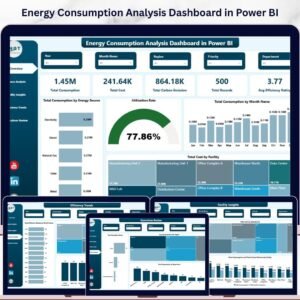
📊 Energy Consumption Analysis Dashboard in Power BI — the Power BI version for organizations using Power BI Service.
🌐 Energy Consumption Analysis Dashboard in HTML — browser-based version with no spreadsheet software needed.
☀️ Solar Energy Dashboard in Excel — companion template for solar-generation-side tracking.
🌱 ESG Environmental Dashboard in Excel — pair your energy numbers with full ESG reporting.
Browse the full Google Sheets Dashboard Templates library for 200+ industry-specific dashboards.
📖 Click here to read the Detailed Blog Post
Watch the step-by-step video tutorial:
🎥 Visit our YouTube channel for step-by-step video tutorials
👉 YouTube.com/@NextGenTemplates


Reviews
There are no reviews yet.