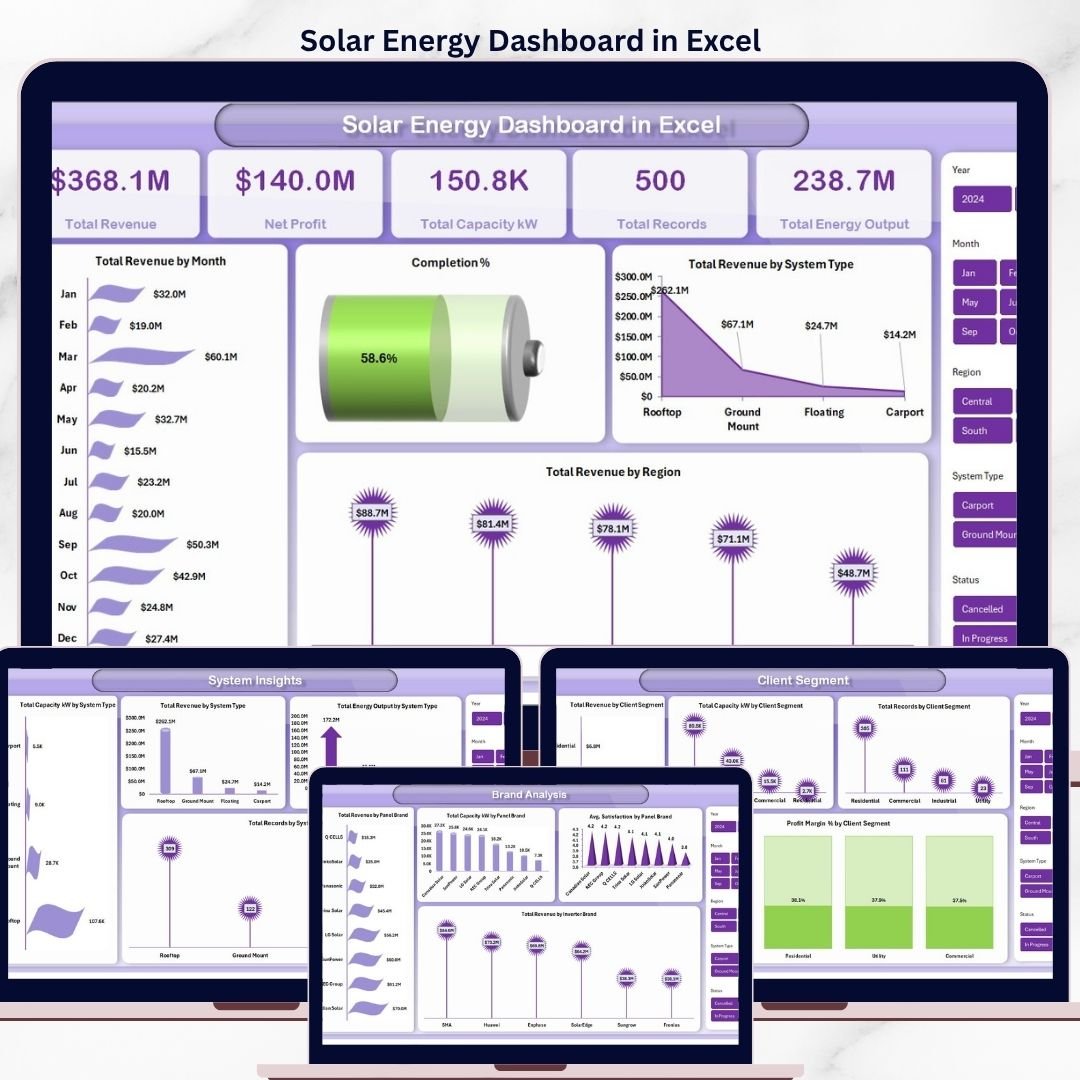
The Solar Energy Dashboard in Excel tracks 6 headline KPIs across 5 interactive pages, with 14 pre-built charts, multiple slicers for instant filtering, and a pivot-driven Support Sheet. Setup takes under 10 minutes — paste your solar project data into the Data Sheet, click Refresh All, and every card, chart, and regional view rebuilds automatically.
🌍 Join 8,400+ teams in 40+ countries using NextGenTemplates to replace paid SaaS tools with one-time-purchase Excel, Google Sheets, Power BI, and HTML templates.
✅ Instant download · One-time payment · No subscription · No per-user fees · Lifetime access
Solar Energy Dashboard in Excel
🔑 Key Features of the Solar Energy Dashboard in Excel
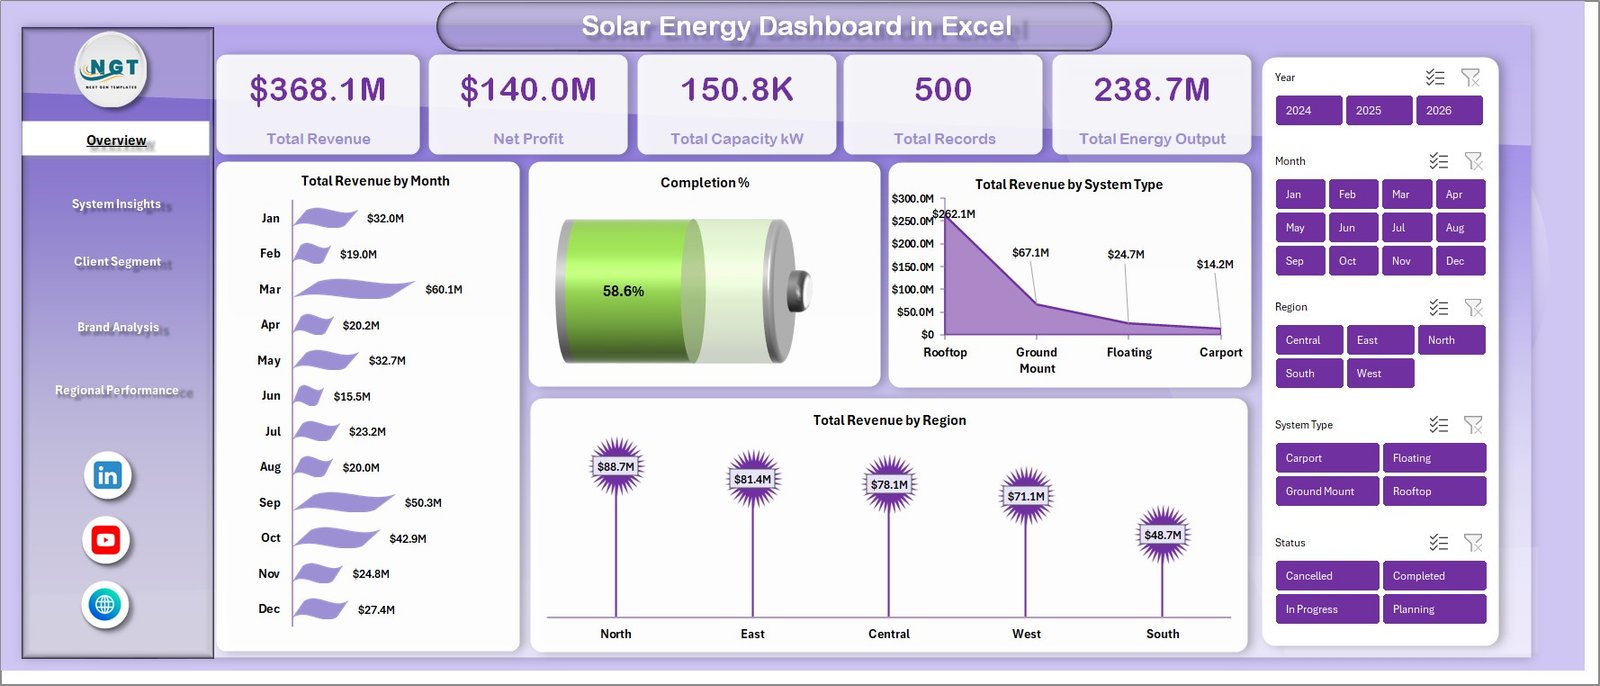
☀️ 6 KPI cards on the Overview page — Total Revenue, Net Profit, Total Capacity kW, Total Records, Total Energy Output, and Completion % — all wired to pivot measures, so every card recalculates the moment you refresh the workbook. These are the same headline metrics solar EPC teams and rooftop installers use to brief ownership on revenue, margin, and installed capacity each month.
📊 14 pivot-driven charts across 5 analysis pages covering Overview, System Insights, Client Segment, Brand Analysis, and Regional Performance. Each chart is anchored to a pivot table in the hidden Support Sheet, so you never touch chart settings manually — refresh the workbook and the visuals rebuild in one click.
🧭 Multiple slicers for fast, filtered views let you drill from a company-wide view down to a single system type, client segment, panel brand, or region in two clicks. Built for project managers, finance controllers, and brand managers who need different slices of the same dataset without rebuilding a report.
🗂️ Structured Data Sheet and hidden Support Sheet — the Data Sheet holds every installation record (capacity, revenue, cost, profit, panel brand, inverter brand, region, client segment, satisfaction); the Support Sheet holds every pivot used to feed the charts. Keep the Support Sheet hidden and your end users only ever see the polished dashboard.
🖼️ Built entirely in native Excel — no macros, no add-ins, no monthly fees. Opens in Microsoft Excel 2016 and later, Excel for Mac, and Excel on the web.
📦 What’s Inside the Solar Energy Dashboard in Excel
📈 Overview Page — 6 KPI cards paired with three trend charts: Total Revenue by Month, Total Revenue by System Type, and Total Revenue by Region.
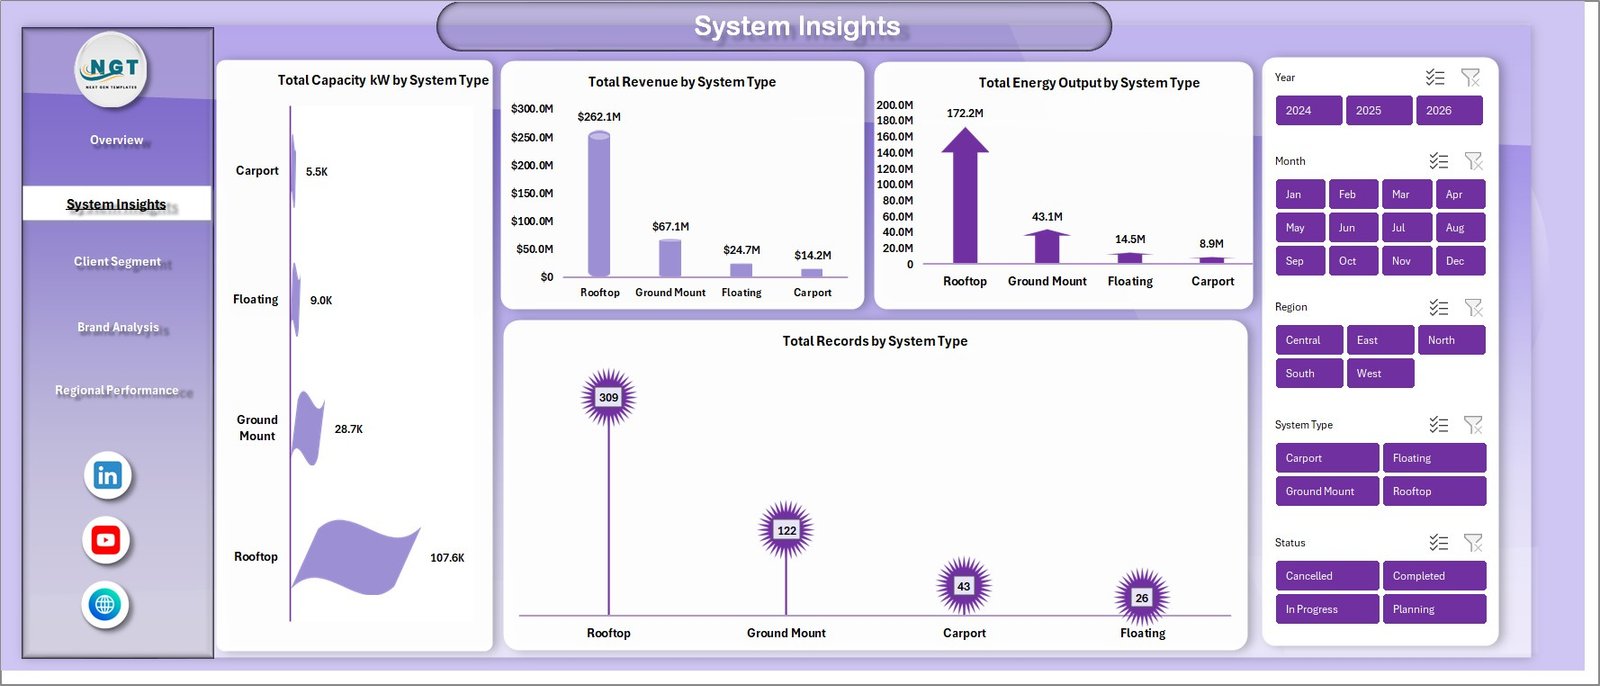
☀️ System Insights Page — compare solar system types (rooftop, ground mount, carport, utility-scale): Total Capacity kW, Total Revenue, Total Energy Output, and Total Records by System Type.
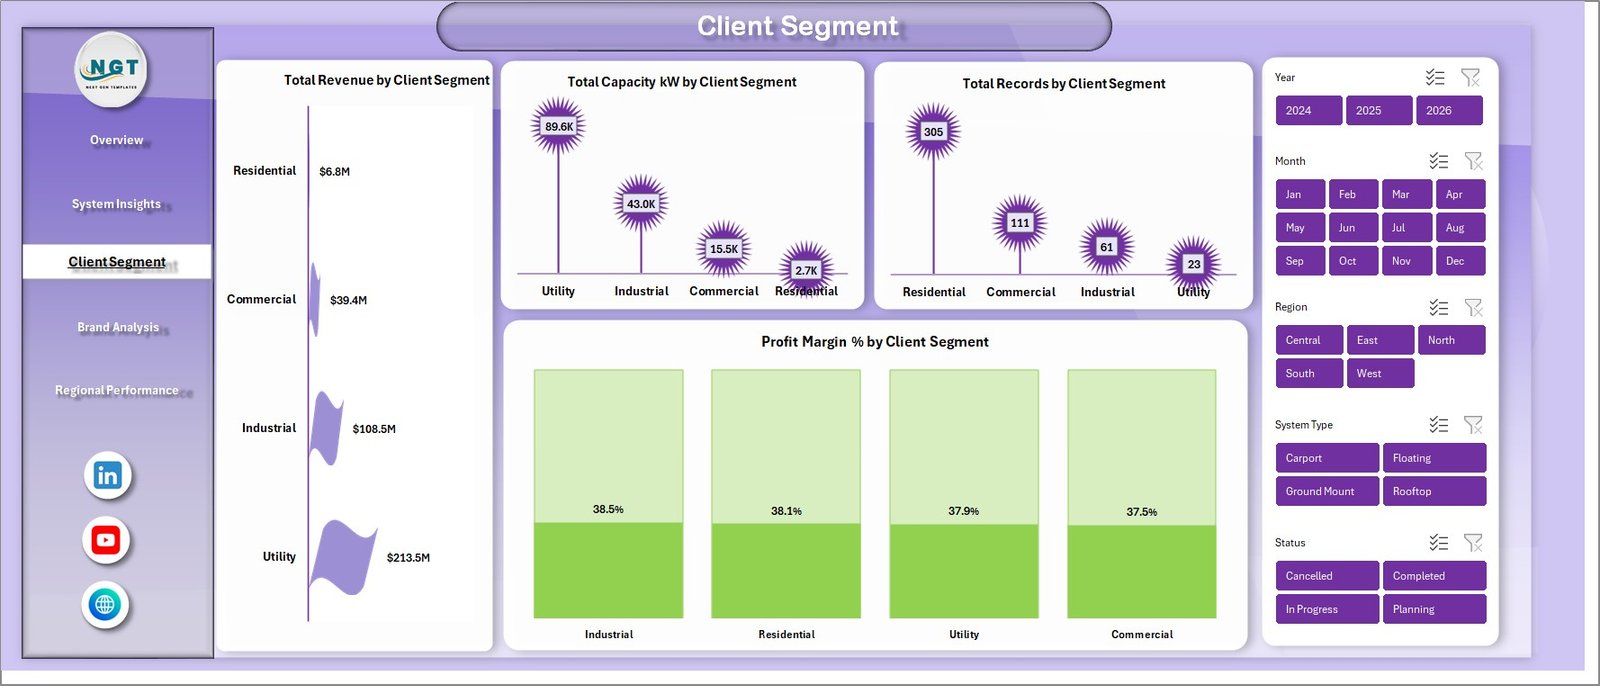
👥 Client Segment Page — split your book across residential, commercial, industrial, and utility clients: Total Revenue, Total Capacity kW, Total Records, and Profit Margin % by Client Segment.
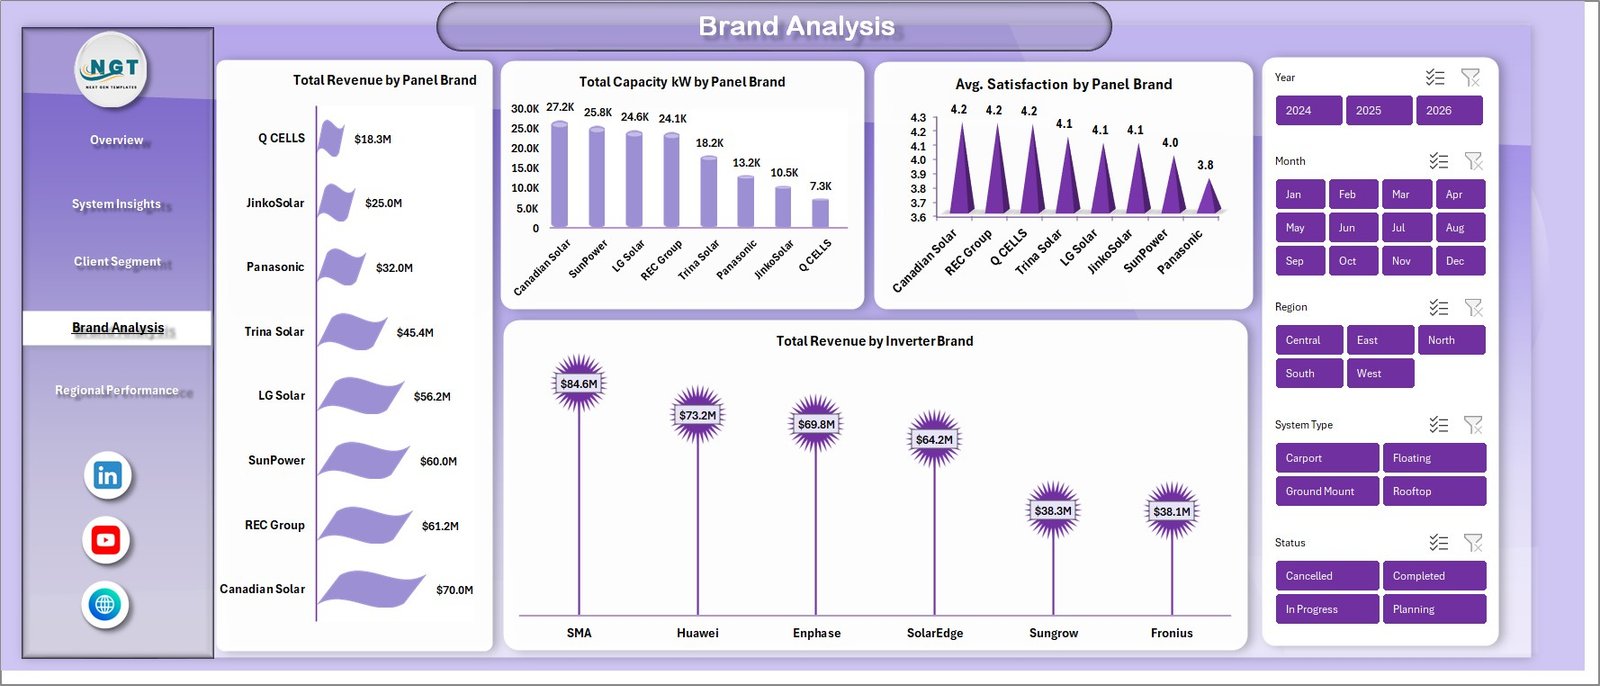
🏷️ Brand Analysis Page — benchmark panel and inverter brands: Total Revenue by Panel Brand, Total Capacity kW by Panel Brand, Avg Satisfaction by Panel Brand, and Total Revenue by Inverter Brand.
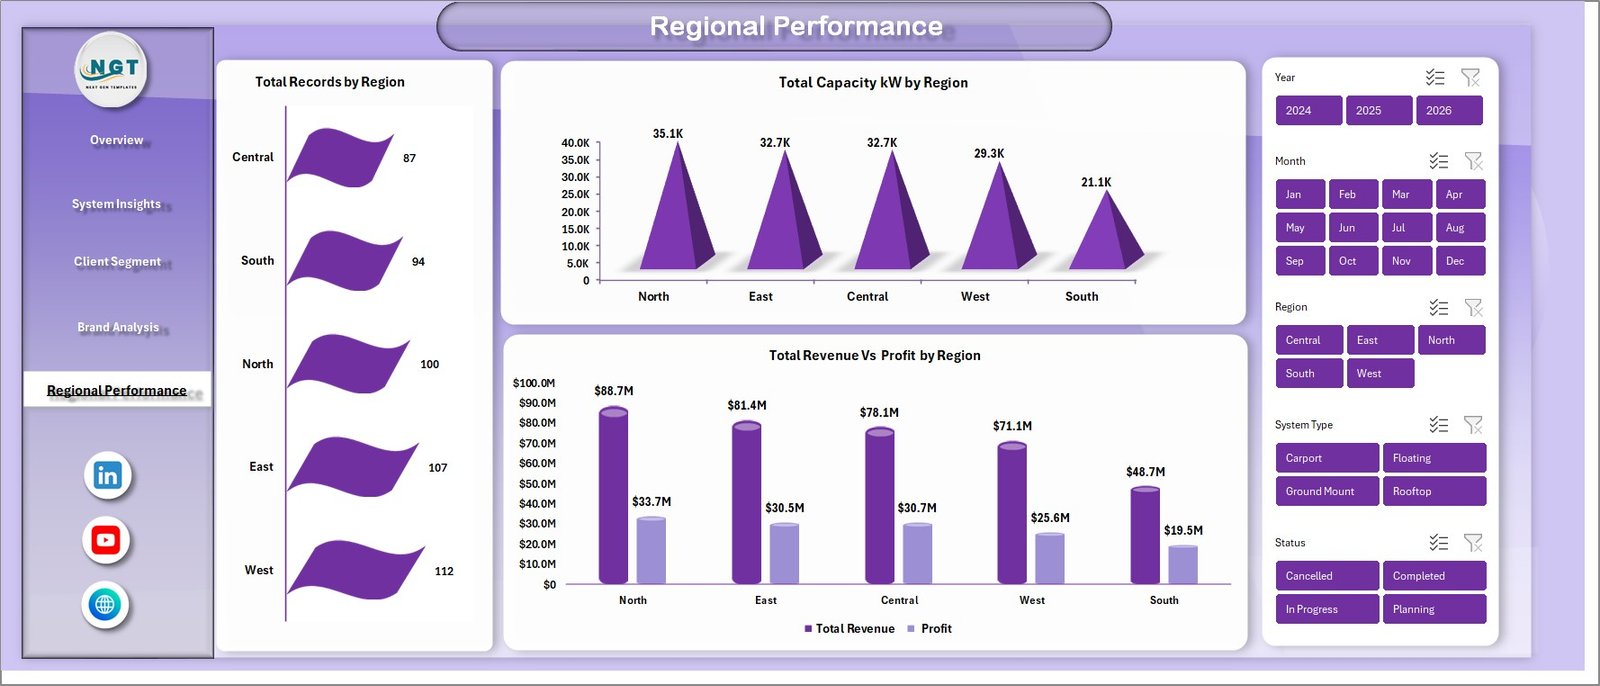
📍 Regional Performance Page — Total Records by Region, Total Capacity kW by Region, and Total Revenue Vs Profit by Region.
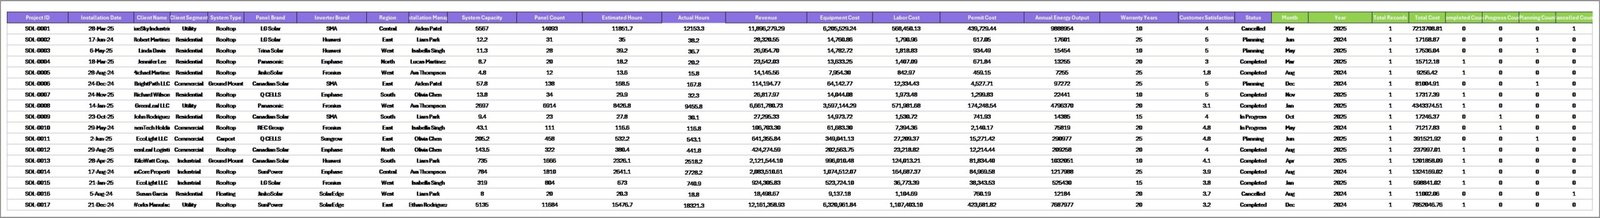
📋 Data Sheet — one flat table where you replace the sample records with your own installation data. Keep the column order intact and every pivot, card, and chart updates when you click Refresh All.
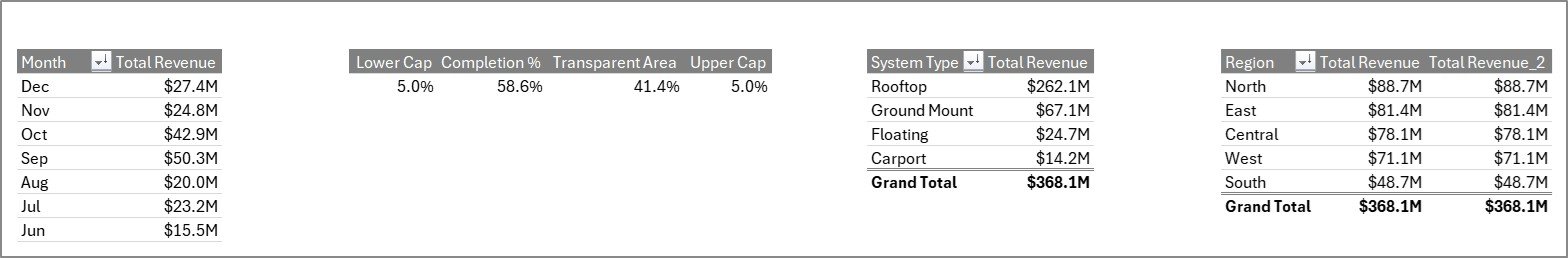
🧮 Support Sheet — holds every pivot table that drives the dashboard. Hide this tab in production so stakeholders only see the polished pages.
📊 Solar Energy Dashboard in Excel vs. Google Sheets Equivalent vs. Paid Solar SaaS
| Feature | Solar Energy Dashboard in Excel | Google Sheets equivalent | Paid Solar SaaS (Aurora / Scoop / OpenSolar Pro) |
|---|---|---|---|
| Cost | $17.99 one-time | $9.99–$14.99 one-time | $49–$199 / user / month |
| Platform | Microsoft Excel (desktop + web + Mac) | Google Sheets (browser only) | Cloud SaaS only |
| Setup time | Under 10 minutes | Under 15 minutes | 2–6 weeks onboarding |
| Works offline | ✅ | ❌ | ❌ |
| Share with stakeholders | ✅ Email / OneDrive / SharePoint | ✅ Share link | ✅ Paid seat per viewer |
| Customizable fields | ✅ Fully editable | ✅ Fully editable | ⚠️ Vendor-controlled |
| Per-brand / per-region analysis | ✅ Out of the box | ✅ | ⚠️ Higher tier only |
| Year-1 cost at 5 users | $17.99 | ~$14.99 | $2,940–$11,940 |
| Vendor lock-in | ❌ None | ❌ None | ✅ Export fees common |
For solar installers and EPC teams that want installation-level visibility without paying $3K–$12K a year for a SaaS tool, the Solar Energy Dashboard in Excel sits in the sweet spot.
👥 Who This Template Is For — and Who It’s Not For
✅ This template is built for:
- Solar EPC and installation companies with 50–2,000 installations per year
- Residential rooftop solar firm owners benchmarking panel and inverter brands on margin
- Solar finance and operations managers presenting monthly performance decks
- Solar consultants building a portable reporting pack across multiple clients
- Channel managers benchmarking multiple panel and inverter brand relationships in one file
❌ This template is NOT for:
- Utility-scale generation companies that need SCADA-level telemetry
- Solar design teams that need PV system sizing, string layout, or shading simulations
- Teams requiring SOC 2-audited, SSO-gated data access in a cloud platform
⚙️ How to Use the Solar Energy Dashboard in Excel
- Download the zip file and unzip it to your preferred folder.
- Open the Solar Energy Dashboard in Excel file in Microsoft Excel 2016 or later.
- Go to the Data Sheet and replace the sample installation records with your own data — keep the same column order.
- Click Data → Refresh All in the Excel ribbon. Every pivot table, card, and chart updates in one pass.
- Use the slicers on each page to filter by region, system type, client segment, panel brand, or inverter brand.
- Right-click the Support Sheet tab and hide it before sharing the workbook with leadership.
💼 Real-World Use Cases
Priya runs operations at a 40-person residential solar EPC in Arizona. She uses the Solar Energy Dashboard in Excel to track monthly revenue against installed capacity, compare margin across residential, commercial, and small industrial client segments, and flag the regions where completion % slips below 85%.
Mike is a finance controller at a commercial rooftop solar company with projects in 11 states. He drops the month’s job data into the Data Sheet, refreshes the workbook, and walks the CFO through Total Revenue vs Profit by Region in under 10 minutes.
Ananya is an independent solar consultant. She uses the same file across four installer clients — each one gets a copy with their own data. She’s replaced an $89/user/month reporting tool with a one-time $17.99 purchase.
❓ Frequently Asked Questions
What KPIs does the Solar Energy Dashboard in Excel track?
The Solar Energy Dashboard in Excel tracks 6 headline KPIs — Total Revenue, Net Profit, Total Capacity kW, Total Records, Total Energy Output, and Completion % — plus 14 chart-level metrics spanning system type, client segment, panel brand, inverter brand, and region.
How long does setup take?
Setup takes under 10 minutes. Paste your installation records into the Data Sheet, click Data → Refresh All, and every KPI card, chart, and slicer updates in one pass.
Which version of Excel do I need?
The Solar Energy Dashboard in Excel runs on Microsoft Excel 2016 or later on Windows and Mac, and on Excel for the web with a Microsoft 365 subscription. It uses native pivot tables and slicers — no add-ins, macros, or plugins.
How does this compare to paid solar SaaS like Aurora or OpenSolar?
Aurora, Scoop, and OpenSolar Pro cost $49–$199 per user per month. For 5 users that’s $2,940–$11,940 a year. The Solar Energy Dashboard in Excel is $17.99 one-time and covers the performance-reporting layer most solar firms actually need.
Can I customize the KPIs, charts, and slicers?
Yes. Every pivot table, chart, and slicer in the Solar Energy Dashboard in Excel is fully editable. Add new metrics, change date ranges, rename categories, or extend the Data Sheet with extra columns.
Does the template work for commercial and utility-scale solar companies?
Yes. The Solar Energy Dashboard in Excel scales from residential installers to commercial and small utility-scale solar firms.
Do I get future updates?
Yes. Every NextGenTemplates purchase includes free updates to the same template file.
👤 About the Author
Built by PK — Microsoft Certified Professional with 15+ years of Excel, Google Sheets, and Power BI experience. Founder of NextGenTemplates, reaching 300K+ subscribers across YouTube channels (@PK-AnExcelExpert, @NextGenTemplates, @NeoTechNavigators). Every template is hand-built and tested before release.
🔗 Explore Related Templates
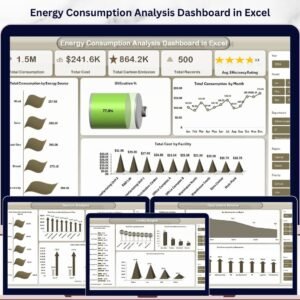
🔋 Energy Consumption Analysis Dashboard in Excel — utility-facing companion template that tracks kWh consumed rather than generated.
🌱 ESG Environmental Dashboard in Excel — pair your solar numbers with full ESG reporting.
⚡ Electricity Project Dashboard in Excel — project-oriented view for grid-connected electricity work.
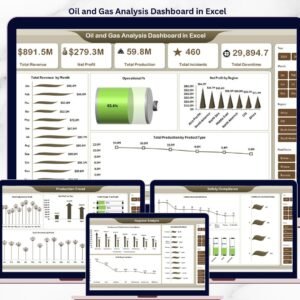
🛢️ Oil and Gas Analysis Dashboard in Excel — same layout pattern for fossil-fuel operators diversifying into renewables.
Also available as: Renewable Energy Dashboard in Power BI for teams on the Power BI stack.
Browse the full Excel Dashboard Templates library for 200+ industry-specific dashboards.
📖 Click here to read the Detailed Blog Post
Watch the step-by-step video tutorial:
🎥 Visit our YouTube channel for step-by-step video tutorials
👉 YouTube.com/@NextGenTemplates
📅 Last updated: April 2026


Reviews
There are no reviews yet.