

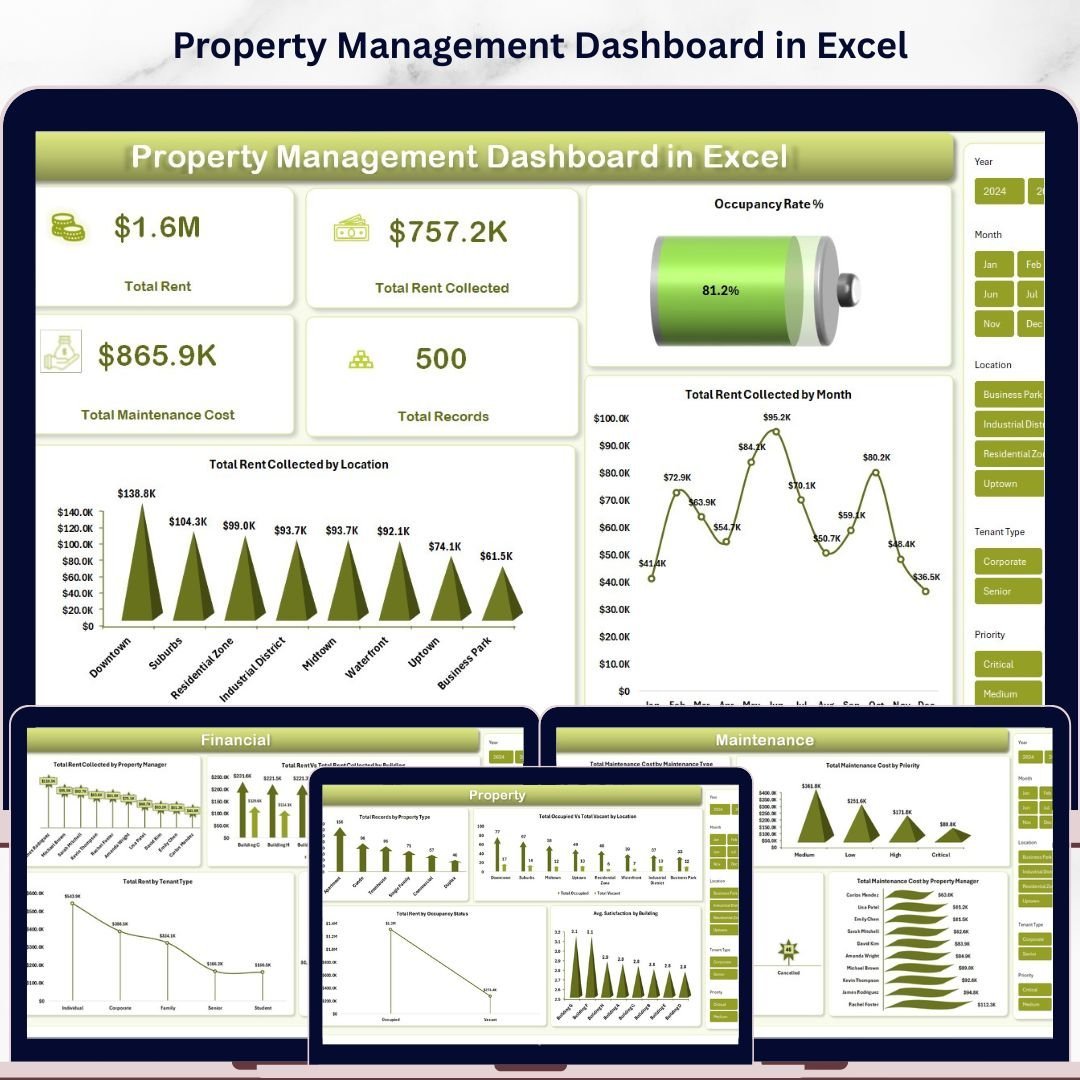



Property Management Dashboard in Excel is a professional, pivot-powered analytics template designed for property managers, landlords, real estate investors, and facilities teams who need to track rent revenue, occupancy rates, maintenance costs, tenant satisfaction, and lease performance from one centralized Excel dashboard. This template includes 5 interactive dashboard pages plus a data sheet and support sheet — making it one of the most comprehensive Excel-based property management solutions available today. Whether you manage a handful of residential units or a large commercial portfolio, this Excel dashboard template gives you the analytical edge you need to maximize rental income and minimize operational costs 🚀.
If you have been searching for a ready-to-use Excel solution to monitor your property portfolio without expensive software, the Property Management Dashboard in Excel is exactly what you need. Simply open the file in Microsoft Excel, replace the sample data with your own records, go to the Data tab, and click Refresh All — every chart, KPI card, and slicer updates automatically. This dashboard transforms raw property management data into beautiful, actionable visual insights that help you optimize occupancy, control maintenance budgets, and improve tenant satisfaction. Browse our complete collection of Excel Dashboard Templates for more options.
🔑 Key Features of Property Management Dashboard in Excel
📊 5 Interactive Dashboard Pages – Overview, Financial, Property, Maintenance, and Lease pages deliver complete visibility into every dimension of your property management operations across rent, occupancy, maintenance, and tenant metrics.
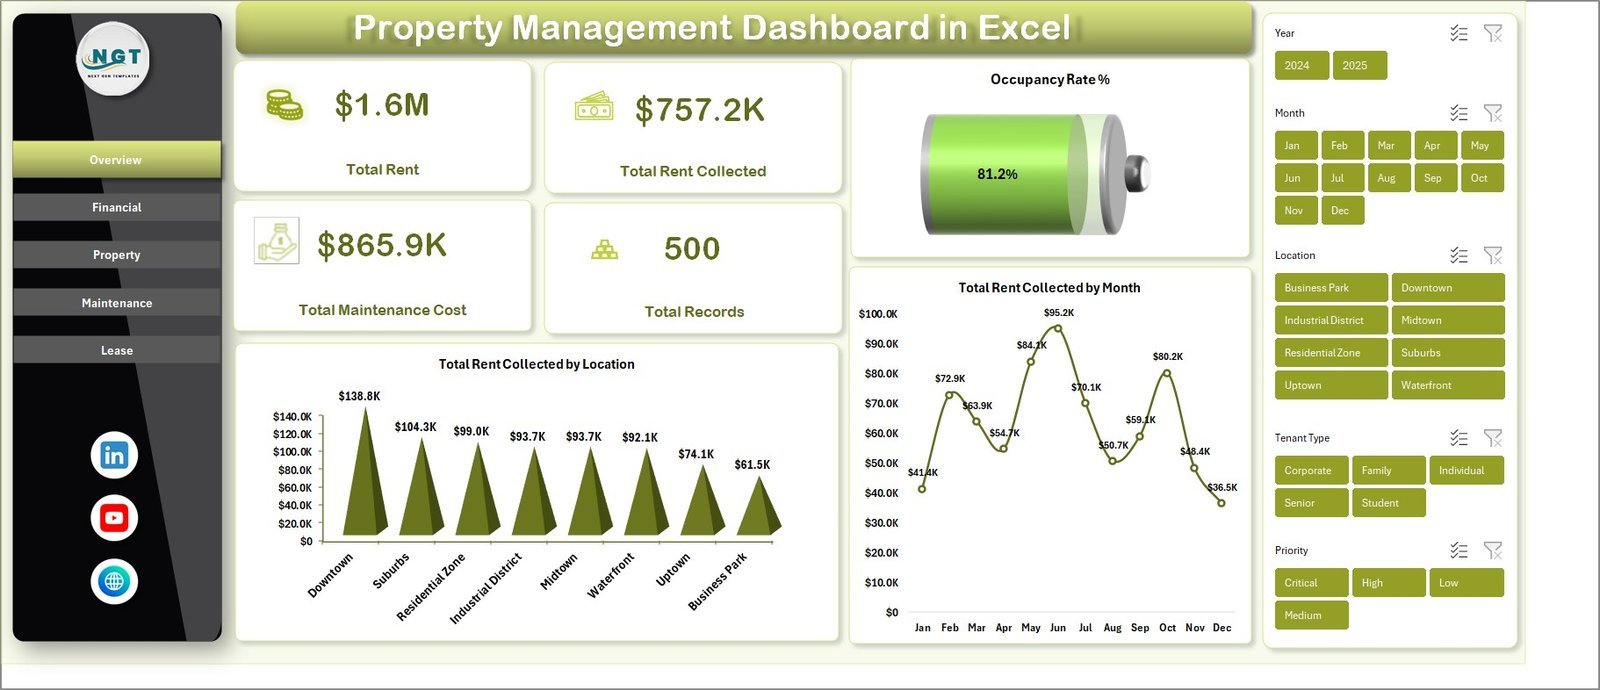
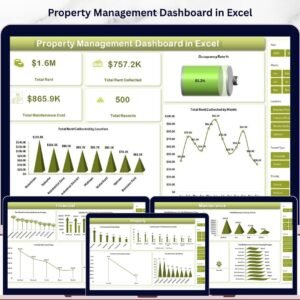
📈 4 Dynamic KPI Cards – The Overview page displays Total Rent, Total Rent Collected, Total Maintenance Cost, and Total Records at a glance for instant executive-level decision-making.
🎯 Occupancy Rate % Tracking – Monitor your portfolio’s occupancy rate percentage directly on the Overview page to stay on top of vacancy trends and maximize unit utilization.
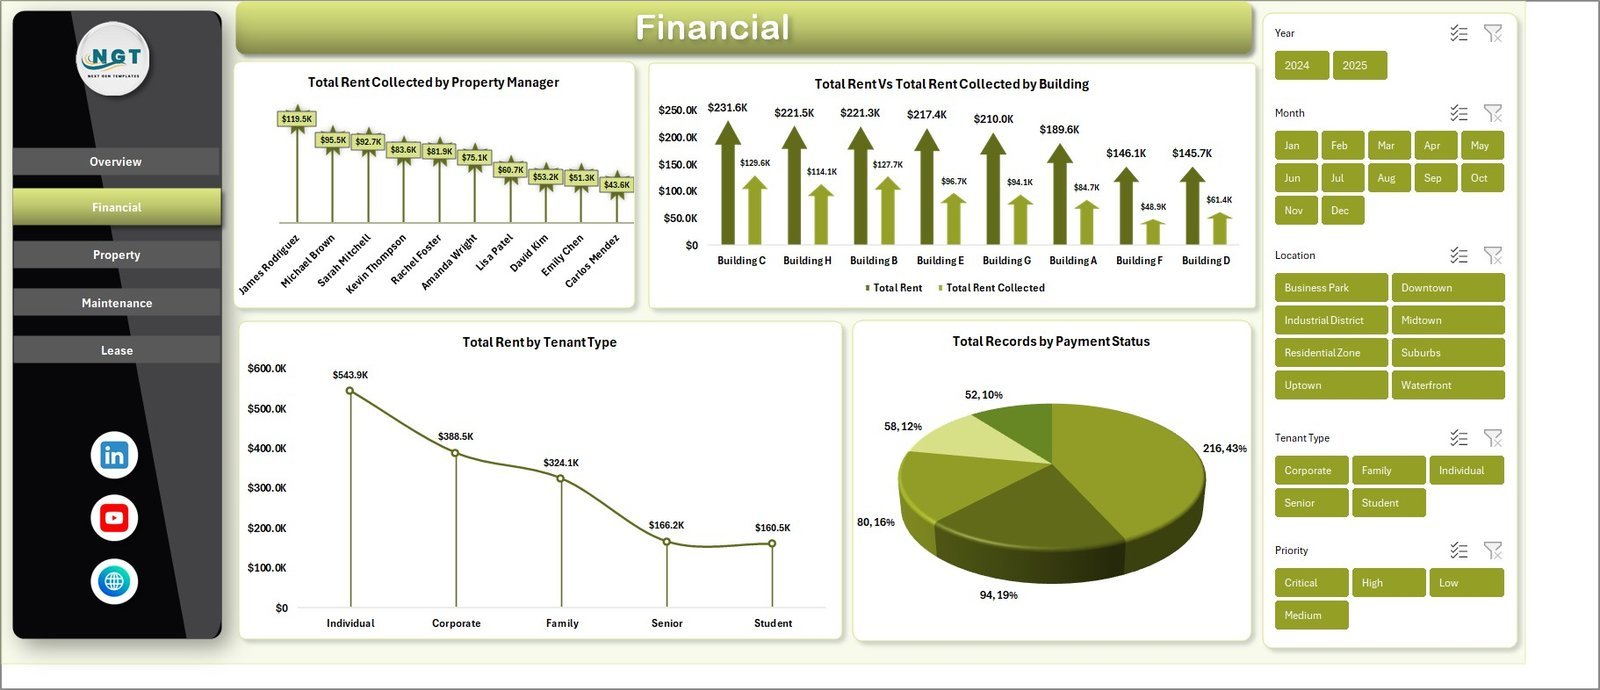
🏢 Multi-Dimensional Analysis – Analyze rent collected by property manager, compare rent vs rent collected by building, track maintenance cost by priority and type, and evaluate tenant satisfaction by building — all from dedicated analysis pages.
🔍 Interactive Slicers and Filters – Every dashboard page includes slicers that let you filter data instantly by location, building, property type, tenant type, payment status, and more for focused analysis.
⚡ Pivot-Powered Auto-Refresh – All charts and KPIs are driven by pivot tables in the Support sheet. Click Refresh All in the Data tab and the entire dashboard updates automatically — no manual formula work required.
📋 Structured Data Sheet – A dedicated Data Sheet tab where you enter your property records in a clean, structured format that feeds the entire dashboard.
🔒 Support Sheet with Pivot Tables – The Support sheet contains all the pivot tables powering the dashboard. Keep it hidden for a clean user experience while the pivots do the heavy lifting behind the scenes.
This dashboard tracks key property management metrics including Total Rent, Total Rent Collected, Total Maintenance Cost, Occupancy Rate %, records by property type, rent collected by location, rent by tenant type, maintenance cost by priority, lease status distribution, and tenant satisfaction scores. It is ideal for residential property managers, commercial property firms, landlords managing multiple buildings, and real estate investors who want data-driven property analytics. If you are also looking for property analytics in other platforms, check out the Property Management Dashboard in HTML and Rental Property Investment Dashboard in Excel.
📦 What’s Inside the Property Management Dashboard in Excel
The Property Management Dashboard in Excel contains 7 sheet tabs organized for complete property analytics coverage:
📊 Overview Page – Displays 4 KPI cards (Total Rent, Total Rent Collected, Total Maintenance Cost, Total Records) and charts for Occupancy Rate %, Total Rent Collected by Month, and Total Rent Collected by Location. Multiple slicers enable instant filtering across the entire dashboard.
💰 Financial Page – Analyzes Total Rent Collected by Property Manager, Total Rent vs Total Rent Collected by Building, Total Rent by Tenant Type, and Total Records by Payment Status for complete financial visibility.
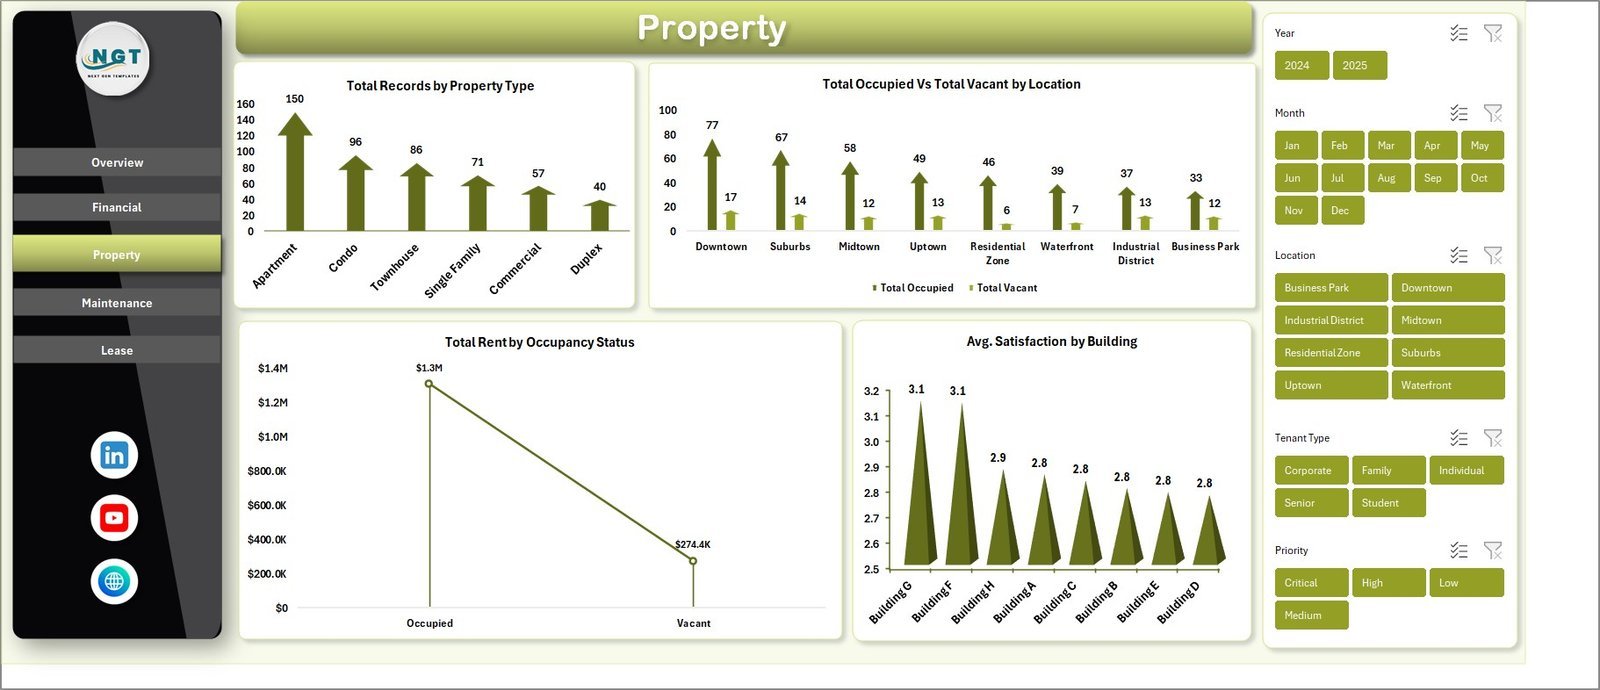
🏠 Property Page – Shows Total Records by Property Type, Total Occupied vs Total Vacant by Location, Total Monthly Occupancy Status, and Avg. Satisfaction by Building for property-level insights.
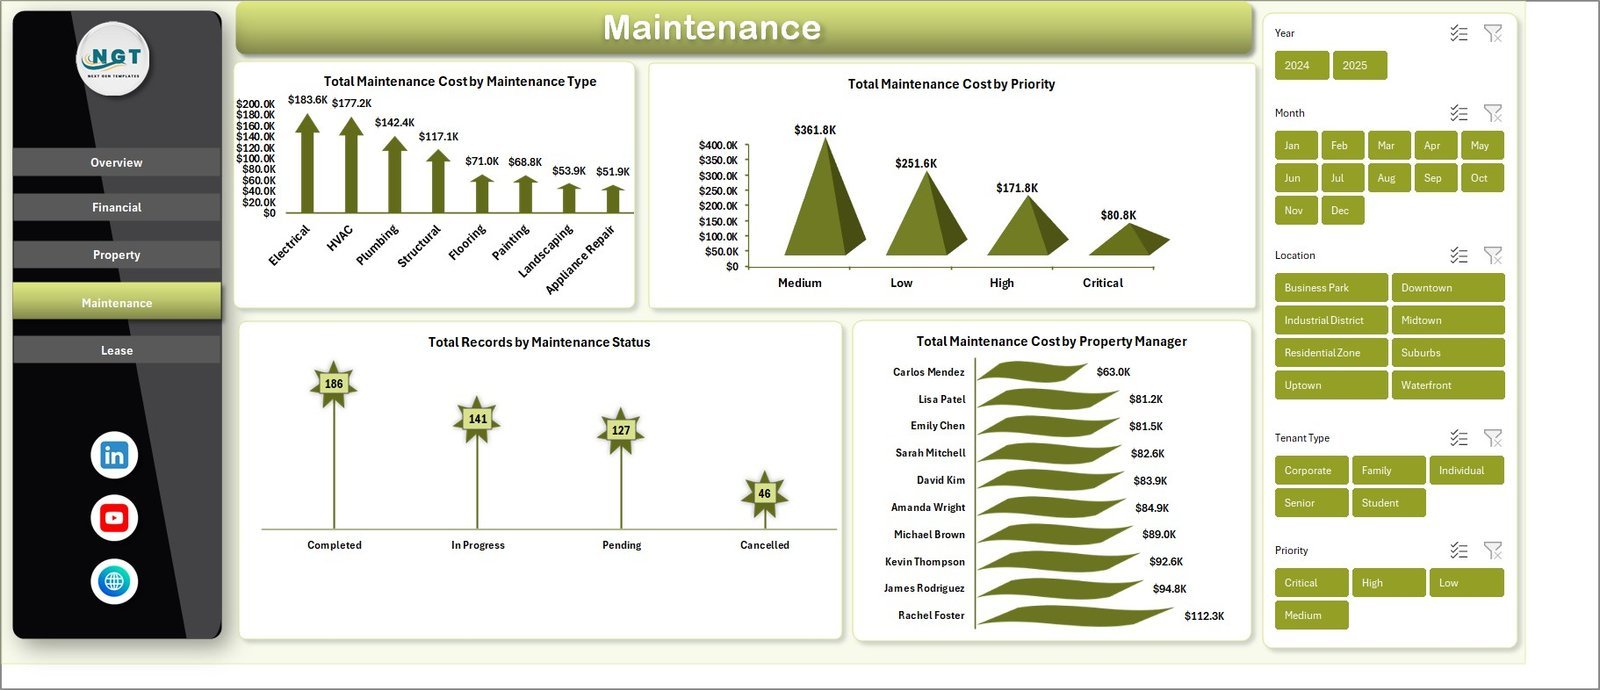
🔧 Maintenance Page – Tracks Total Maintenance Cost by Maintenance Type, Total Maintenance Cost by Priority, Total Records by Maintenance Status, and Total Maintenance Cost by Property Manager for maintenance budget control.
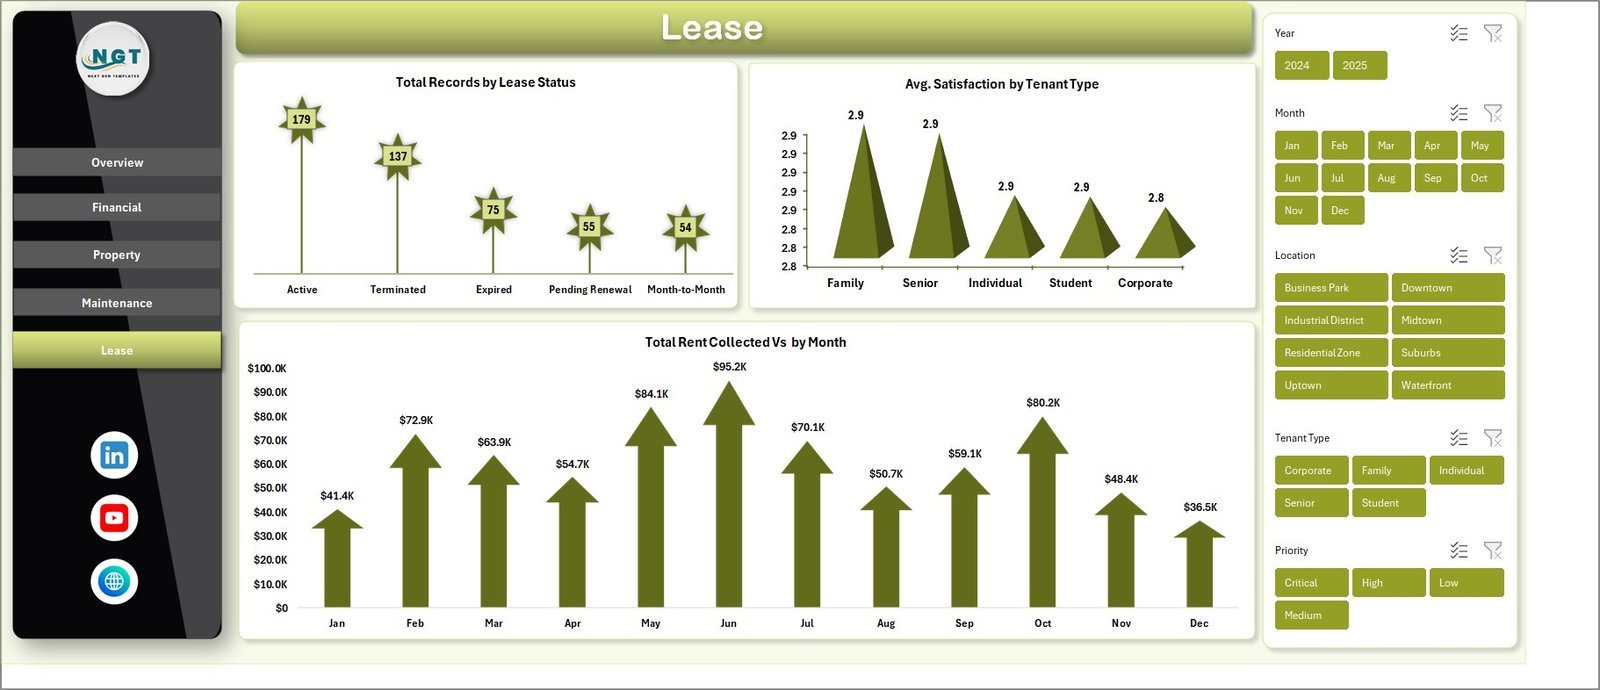
📝 Lease Page – Monitors Total Records by Lease Status, Avg. Satisfaction by Tenant Type, and Total Rent Collected by Month for lease performance analysis.
📋 Data Sheet – Enter your property management records here in the provided format. This sheet feeds all the pivot tables and charts across the dashboard.
⚙️ Support Sheet – Contains multiple pivot tables that power the entire dashboard dynamically. Refresh All updates everything. Keep this sheet hidden for a clean presentation.
⚙️ How to Use the Property Management Dashboard in Excel
1️⃣ Download and open the file in Microsoft Excel (2016 or later recommended).
2️⃣ Navigate to the Data Sheet tab and replace the sample data with your own property management records in the same column format.
3️⃣ Go to the Data tab in the Excel Ribbon and click Refresh All to update all pivot tables and charts.
4️⃣ Use the interactive slicers on each dashboard page to filter and analyze your data from any angle.
5️⃣ Hide the Support Sheet for a clean presentation when sharing with stakeholders.
👥 Who Can Benefit from This Property Management Dashboard in Excel
🏢 Property Managers – Track rent collection, occupancy, and maintenance across multiple buildings from a single dashboard.
🏠 Landlords – Monitor rental income, tenant satisfaction, and lease status for your property portfolio.
📊 Real Estate Investors – Analyze property performance, occupancy trends, and maintenance costs to make smarter investment decisions.
🏗️ Facilities Management Teams – Track maintenance requests by type, priority, and status to optimize operational budgets.
💼 Real Estate Firms – Provide clients with professional property performance reports using interactive Excel analytics.
❓ Frequently Asked Questions
What KPIs does the Property Management Dashboard in Excel track?
The Property Management Dashboard in Excel tracks 4 key performance indicators on the Overview page: Total Rent, Total Rent Collected, Total Maintenance Cost, and Total Records. It also tracks Occupancy Rate %, rent by location, rent by tenant type, maintenance cost by type and priority, lease status distribution, and tenant satisfaction scores across 5 interactive dashboard pages.
Do I need advanced Excel skills to use this property management template?
No. Simply open the file in Microsoft Excel, replace the sample data in the Data Sheet with your own property records, and click Refresh All in the Data tab. All charts, KPI cards, and pivot tables update automatically without any manual formula work.
What is the best Excel dashboard for property management?
The Property Management Dashboard in Excel from NextGenTemplates is one of the best options available. It includes 5 interactive dashboard pages covering overview, financial analysis, property insights, maintenance tracking, and lease analysis with 4 KPI cards, interactive slicers, and pivot-powered auto-refresh.
Can I track maintenance costs and tenant satisfaction in this dashboard?
Yes. The Maintenance page tracks Total Maintenance Cost by Maintenance Type, Priority, Status, and Property Manager. The Property page and Lease page track Avg. Satisfaction by Building and by Tenant Type respectively, giving you complete visibility into maintenance budgets and tenant experience.
How do I update the dashboard with my own property data?
Go to the Data Sheet tab, replace the sample records with your own property management data using the same column format. Then navigate to the Data tab in Excel and click Refresh All. All 5 dashboard pages, including charts, KPIs, and slicers, will update automatically.
Is this dashboard available in other platforms?
Yes. We also offer the Property Management Dashboard in HTML for browser-based analytics. For rental property investment tracking, explore our dashboards in Excel, Power BI, Google Sheets, and HTML.
🔗 Explore Related Templates
📌 Property Management Dashboard in HTML – The browser-based version with interactive charts and no software installation required.
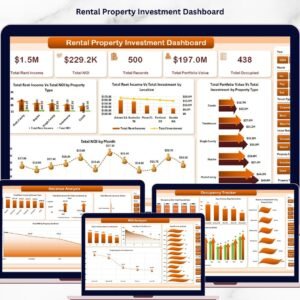
📌 Rental Property Investment Dashboard in Excel – Track rental income, NOI, occupancy, and ROI across your investment properties.
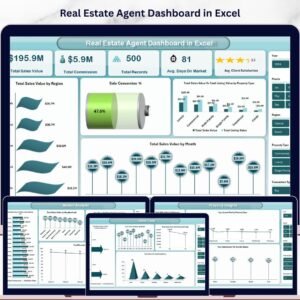
📌 Real Estate Agent Dashboard in Excel – Agent performance tracking with commissions, sales trends, and market analysis.
📖 Click here to read the Detailed Blog Post
Watch the step-by-step video tutorial:
🎥 Visit our YouTube channel to learn step-by-step video tutorials
👉 YouTube.com/@NextGenTemplates
Compatibility and Requirements
- Works in Microsoft Excel desktop (Excel 2016 or later, or Microsoft 365).
- All charts and KPI cards are driven by pivot tables in the Support sheet, and each dashboard page has slicers. Microsoft explains them in Use slicers to filter data.
More Questions About This Template
Which pages does the dashboard have?
Five dashboard pages: Overview, Financial, Property, Maintenance and Lease. There are also two working sheets, the Data Sheet and the Support sheet.
Where do the charts get their numbers?
The Support sheet holds the pivot tables that feed every chart and KPI card. Those pivots read from the Data Sheet, so you only type your records in one place.
Can I filter the dashboard by building or location?
Yes. Each page has slicers, and the Overview page uses them to filter by location, building, property type, tenant type and payment status.
Does the dashboard show occupied and vacant units?
Yes. The Property page shows Total Occupied vs Total Vacant by Location and the monthly occupancy status. The Overview page shows the Occupancy Rate %.
Is there a Power BI or Google Sheets version?
Yes. See the Property Management Dashboard in Power BI and the Property Management Dashboard in Google Sheets.
Related Property Templates
- Property Management Dashboard in Power BI: the same topic in Power BI
- Property Management Dashboard in Google Sheets: the Google Sheets edition
- Property Management KPI Dashboard in Excel: a KPI-focused view for property managers
- Tenant and Property Management Dashboard in Google Sheets: tenant and property tracking in Google Sheets
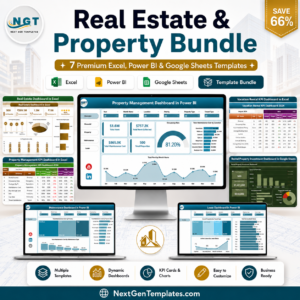
- Real Estate & Property Bundle: 7 real estate templates in one download
Browse all Excel dashboards.



























Reviews
There are no reviews yet.