


Managing a growing real estate portfolio can be overwhelming—until now! The Real Estate Dashboard in Excel is a powerful, ready-to-use solution for real estate agents, property managers, and investors looking to gain full control over their property data. With dynamic visualizations, insightful charts, and automated metrics, this dashboard helps you track everything from costs and area to regional performance and client types.
Whether you’re selling properties, renting units, or managing investment portfolios, this tool will transform how you manage your real estate business—no coding required!
✨ Key Features of the Real Estate Dashboard
📋 1. Overview Sheet Tab
The command center of your portfolio!
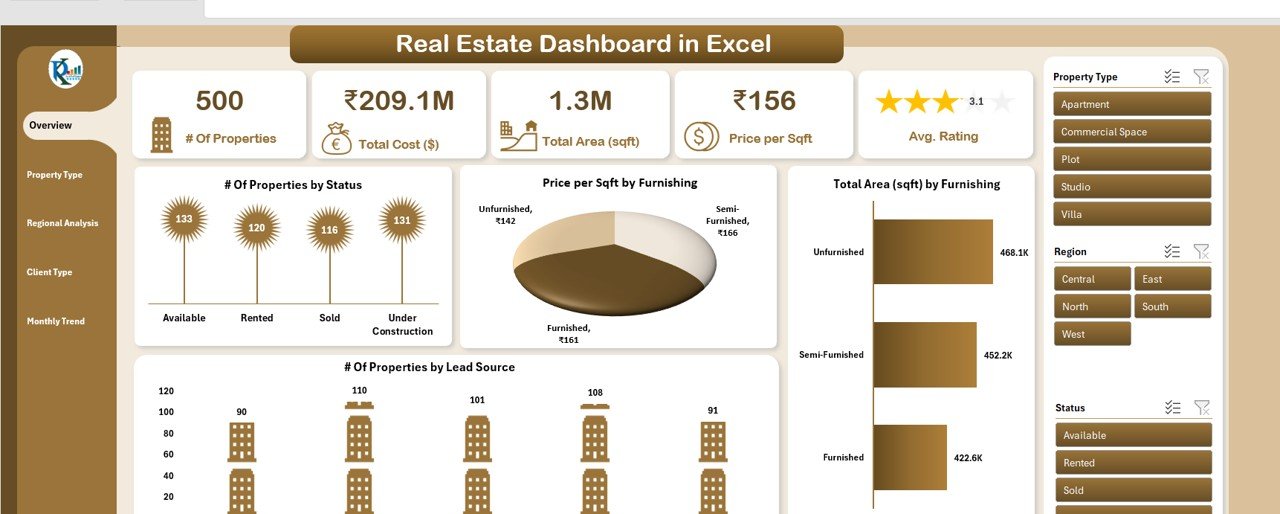
🔢 Summary Cards:
# of Properties – Keep count of every property
Total Cost ($) – View the total investment value
Total Area (sqft) – Track cumulative square footage
Price per Sqft – Instantly calculate property pricing efficiency
Avg. Rating – Assess property quality
📈 Charts:
Properties by Status (Sold, For Sale, Rented)
Price per Sqft by Furnishing Status
Area by Furnishing Status
Properties by Lead Source
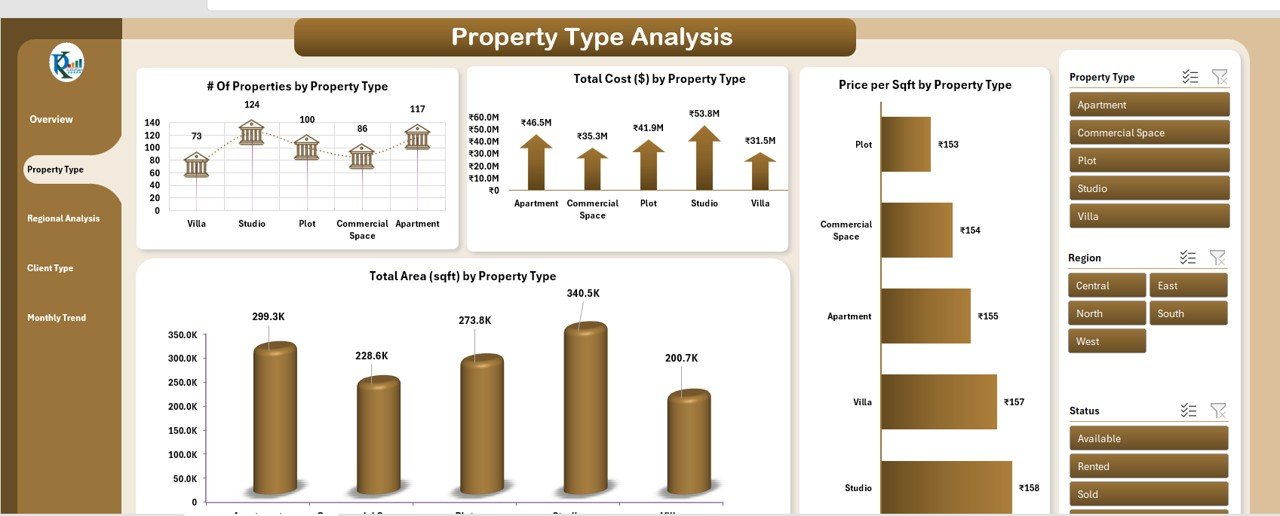
🏢 2. Property Type Analysis
Get insights by property category (apartment, villa, commercial unit, etc.)
Properties Count by Type
Cost, Area, and Price per Sqft by Type
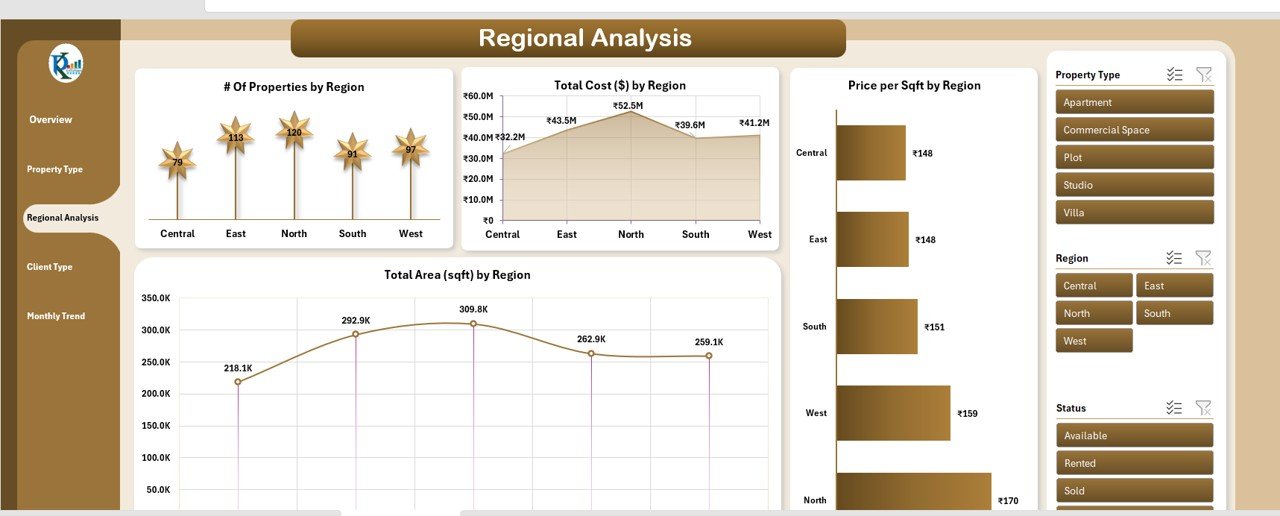
🌍 3. Regional Analysis
Make data-backed decisions based on location.
Property Distribution by Region
Regional Cost & Area Analysis
Pricing Trends by Region
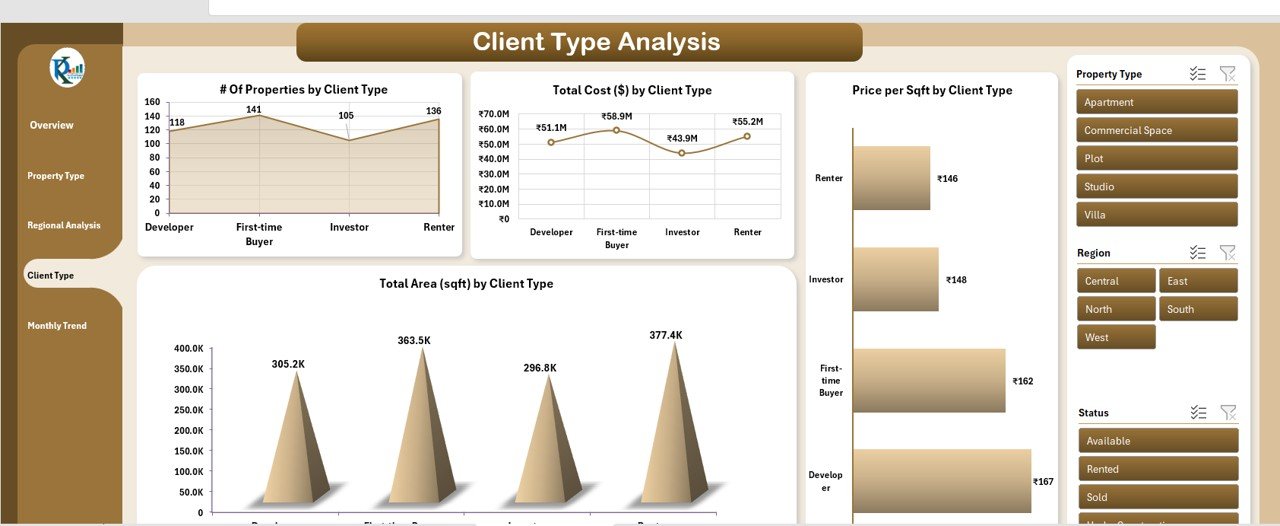
🧑💼 4. Client Type Analysis
Understand who your buyers are—individuals, investors, or corporates.
Properties by Client Type
Investment and Area Analysis per Client Segment
Price per Sqft Trends by Client
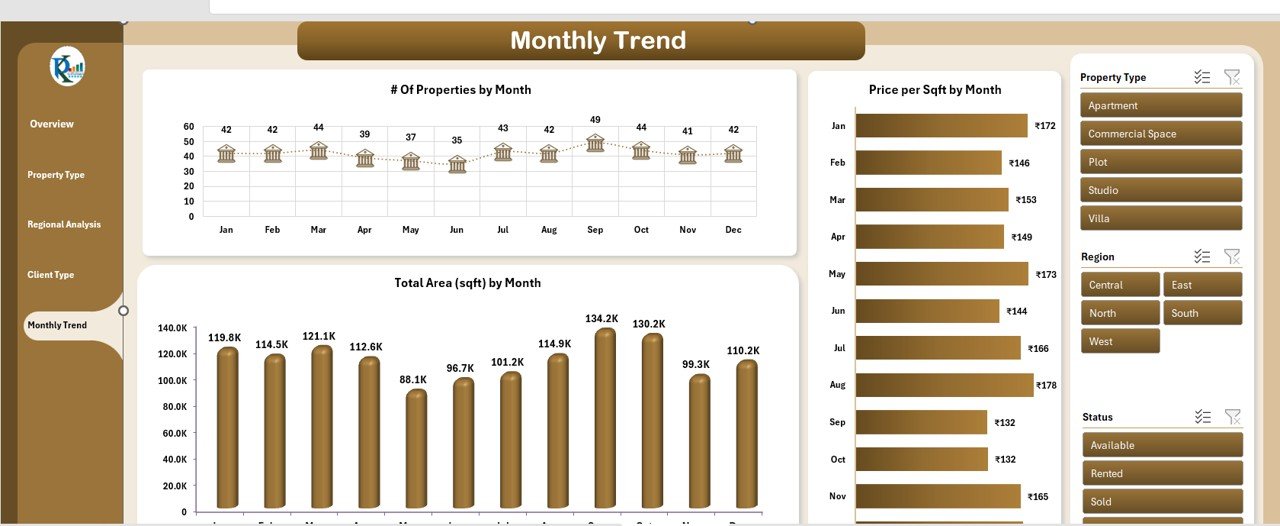
📆 5. Monthly Trend Sheet
Track how your portfolio evolves over time.
Monthly Property Sales/Rentals
Area Sold/Rented Each Month
Pricing Movement by Month
🧾 6. Data Sheet Tab
Your centralized data source—input once and watch insights flow.
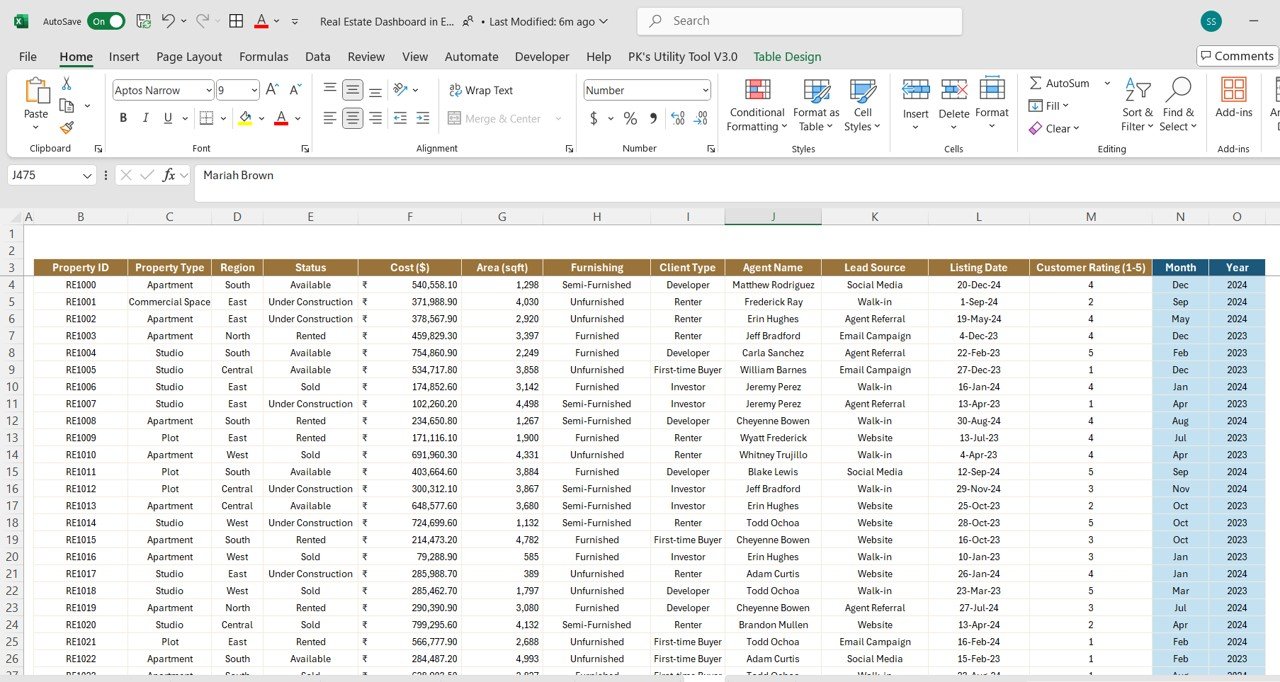
Enter property details, costs, area, furnishing, ratings, lead source, region, client type, and more
Dashboard updates automatically
📦 What’s Inside the Template?
📊 6 analytical worksheet tabs
🧮 Auto-calculating metrics
🎯 Clickable slicers for filters
✨ Color-coded charts and KPIs
🧩 Fully editable and scalable layout
☁️ Compatible with all Excel versions (desktop and online)
🛠️ How to Use the Real Estate Dashboard
Open the Excel file
Go to the Data Sheet and input property details
Explore insights via Overview, Type, Region, Client, and Monthly Trend pages
Filter by furnishing, status, lead source, etc.
Customize layout or KPIs as needed
🎯 Who Can Benefit from This Template?
🏘️ Real Estate Agents – Track listings and close deals faster
🏗️ Property Managers – Manage units across locations with ease
💼 Real Estate Investors – Monitor costs, area, and profitability
📊 Data Analysts – Extract trends and guide strategy
🧑💻 Marketing Teams – Analyze lead sources and conversion






























Reviews
There are no reviews yet.