




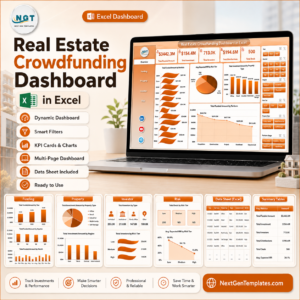
Real Estate Crowdfunding Dashboard in Excel gives sponsors, analysts, fund managers, and real estate investment teams a 7-sheet reporting workbook for tracking funded amount, investment, investors, distributions, deals, risk tiers, platforms, regions, property types, sponsors, and funding rounds. Crowdfunding performance can become messy when funding data, investor activity, distributions, and deal status live in separate exports. This Excel dashboard brings those records into one structured file with KPI cards, slicers, pivot-backed charts, a Data Sheet, and a Support Sheet that refreshes the full dashboard after new data is added.
Join 8,400+ teams in 40+ countries using NextGenTemplates to replace recurring software with one-time-purchase Excel, Google Sheets, Power BI, and HTML templates. Instant download. One-time payment. No subscription. Lifetime access.
Key Features of Real Estate Crowdfunding Dashboard in Excel
- 7 connected worksheet tabs covering Overview, Funding, Property, Investor, Risk, Data Sheet, and Support Sheet.
- 5 executive KPI cards for Total Funded Amount, Total Investment, Total Investors, Total Distributions, and Total Deals.
- 19 analytical chart views covering funding, IRR, platforms, property types, regions, sponsors, investor segments, distributions, fees, risk tiers, and deal status.
- Interactive slicers that let users filter the dashboard quickly without rebuilding formulas or charts.
- Editable Data Sheet where users add crowdfunding records in the same format as the sample data.
- Support Sheet with pivot tables powering the dashboard dynamically after clicking Refresh All from the Excel Data ribbon.
What’s Inside the Real Estate Crowdfunding Dashboard in Excel
1. Overview Page
The Overview page is the high-level investment summary. It shows Total Funded Amount, Total Investment, Total Investors, Total Distributions, and Total Deals at the top, with slicers for quick filtering.
Total Funded Amount by Month: This chart shows how funded capital moves across months. It helps identify strong fundraising periods and slower months that may need attention.
Avg. Expected IRR by Risk Tier: This view compares return expectations across risk levels. It helps investors understand whether higher-risk tiers are offering enough expected return.
Total Investment Amount by Property Type: This chart shows where investor capital is concentrated by property type. It is useful for comparing multifamily, office, retail, industrial, or mixed-use exposure.
Total Funded Amount by Platform: This chart compares fundraising by platform. It helps teams evaluate which crowdfunding channels are driving the most capital.
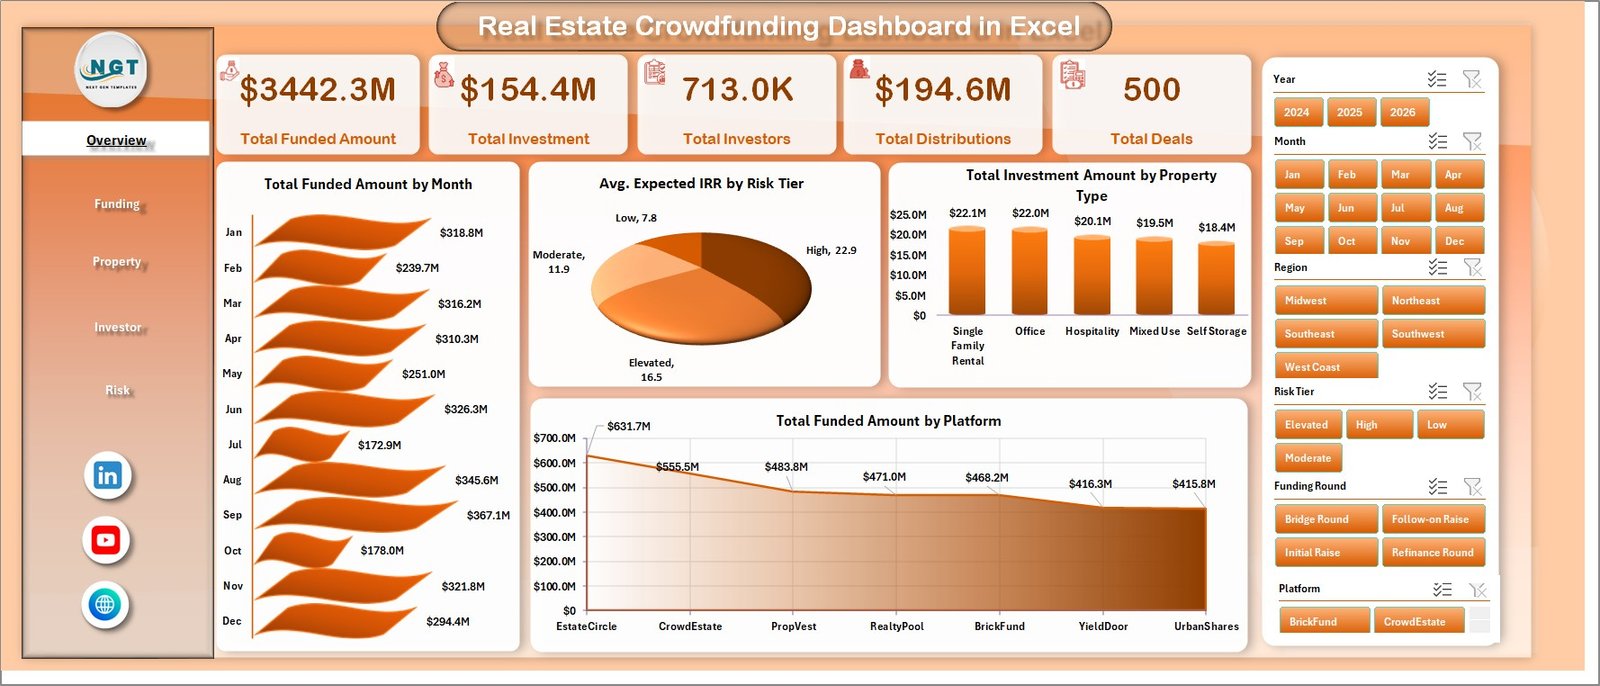
Real Estate Crowdfunding Dashboard in Excel
2. Funding Page
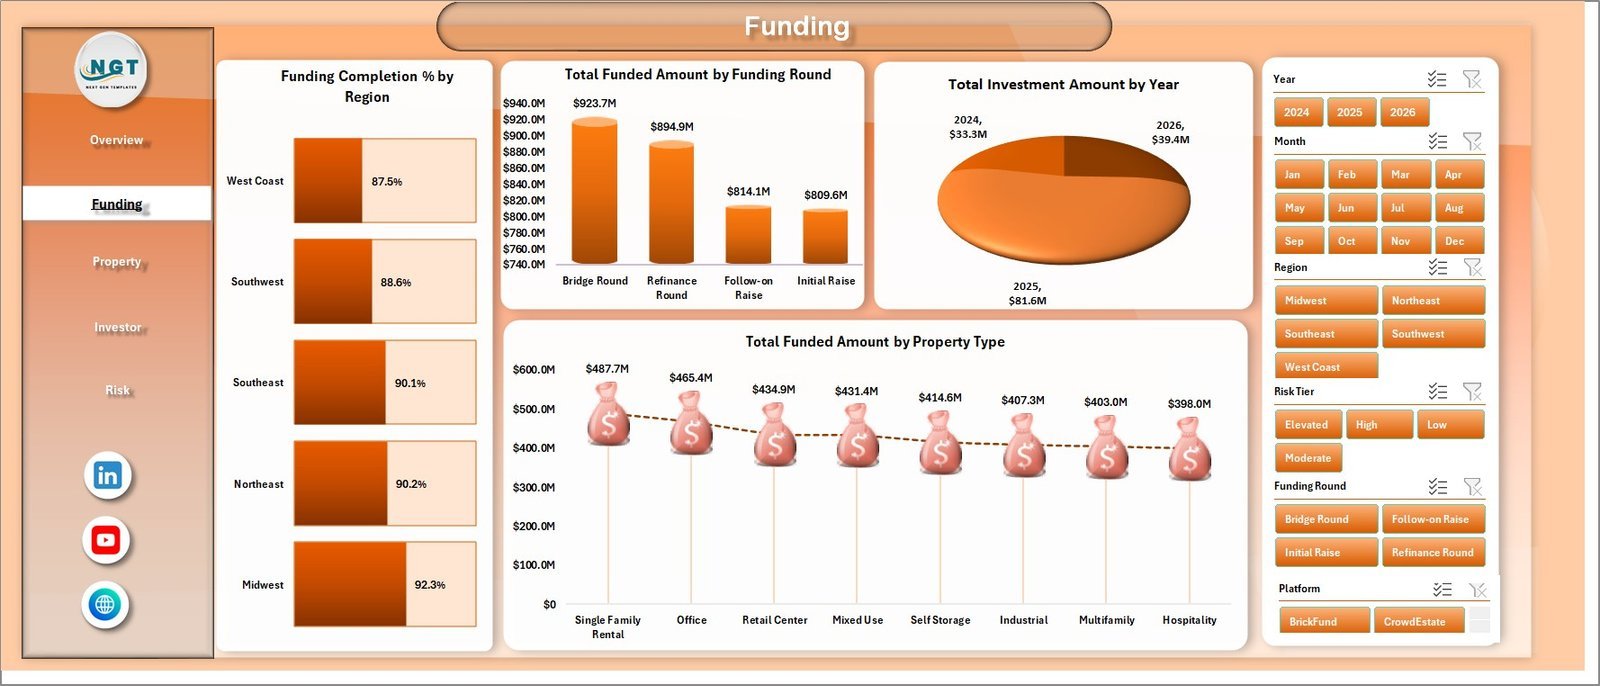
The Funding page focuses on funding progress and investment flow by region, round, year, and property type. It helps sponsors and analysts understand where capital is coming from and how close deals are to funding targets.
Funding Completion % by Region: This chart compares funding completion across regions. It helps identify markets where campaigns are filling quickly versus regions that may need additional investor outreach.
Total Funded Amount by Funding Round: This view shows funded capital by round. It helps separate early fundraising activity from later-stage or follow-on capital raises.
Total Investment Amount by Year: This chart tracks yearly investment movement. It supports annual reviews, fundraising trend analysis, and portfolio growth reporting.
Total Funded Amount by Property Type: This chart compares funded amount across asset classes. It helps reveal whether investor demand is concentrated in specific real estate categories.
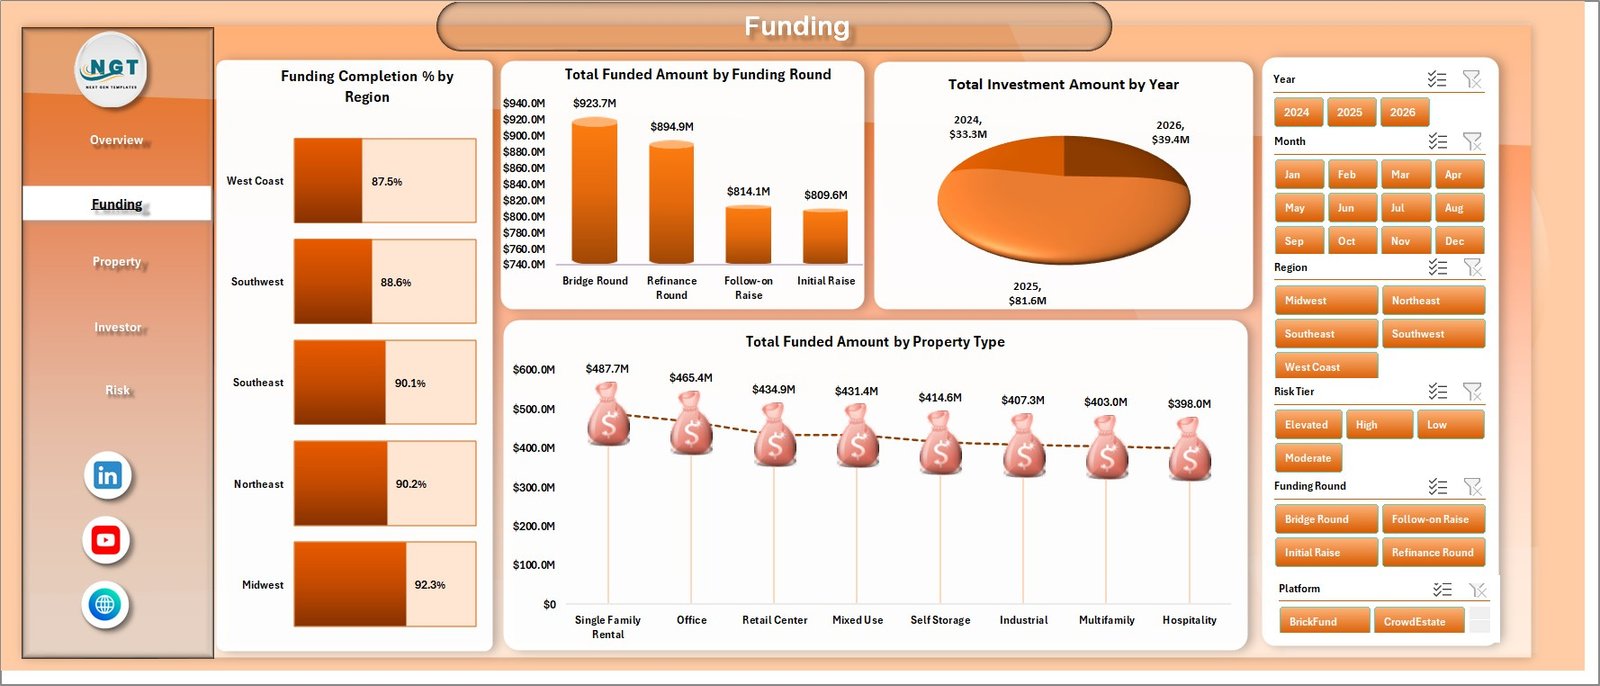
Funding
3. Property Page
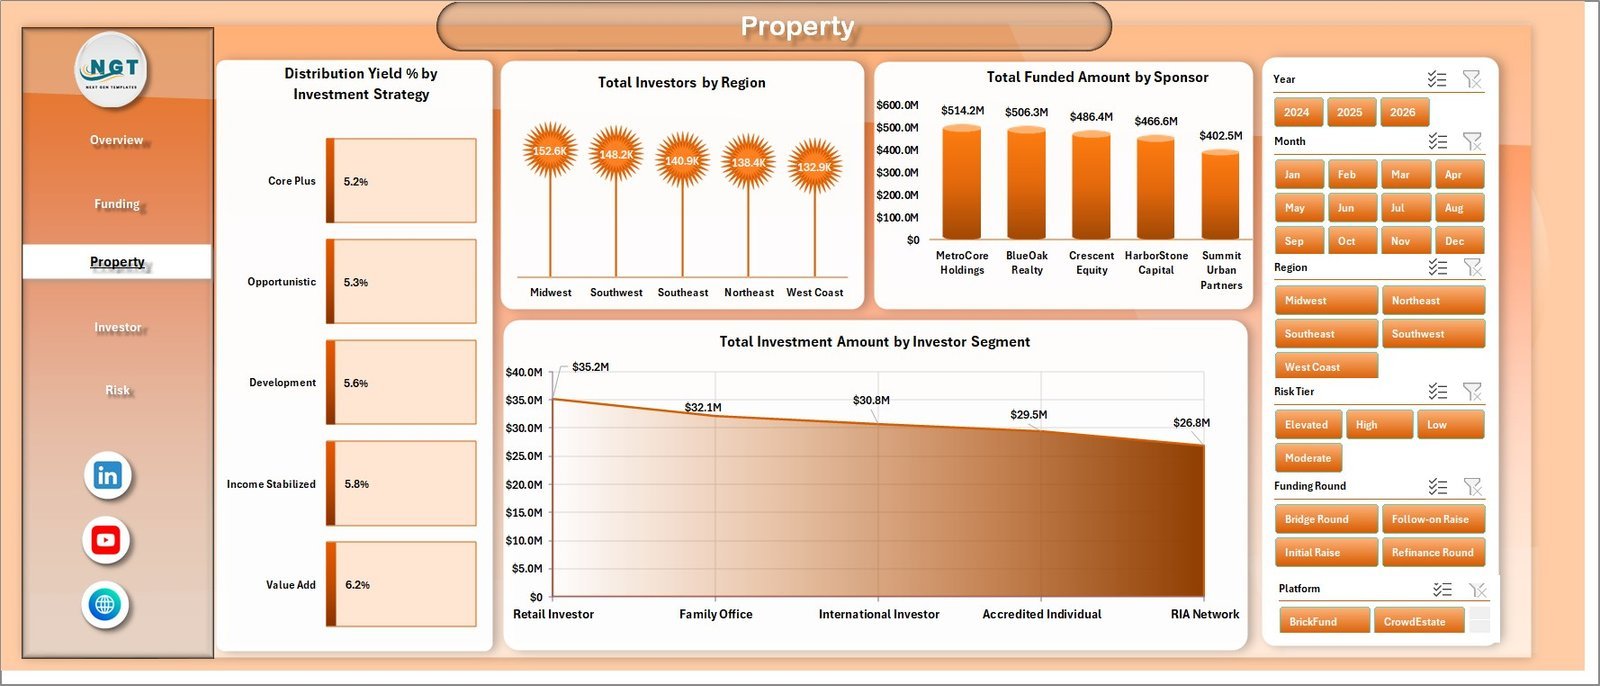
The Property page explains how distributions, investors, sponsors, and segments perform across the portfolio.
Distribution Yield % by Investment Strategy: This chart compares yield by strategy. It helps investors see whether core, value-add, opportunistic, or income-focused strategies are delivering different payout profiles.
Total Investors by Region: This chart shows investor count by region. It helps teams identify where investor participation is strongest.
Total Funded Amount by Sponsor: This view ranks funded amount by sponsor. It helps compare sponsor traction and capital-raising strength.
Total Investment Amount by Investor Segment: This chart compares investment by segment. It helps separate retail investors, accredited investors, institutions, or other investor groups.
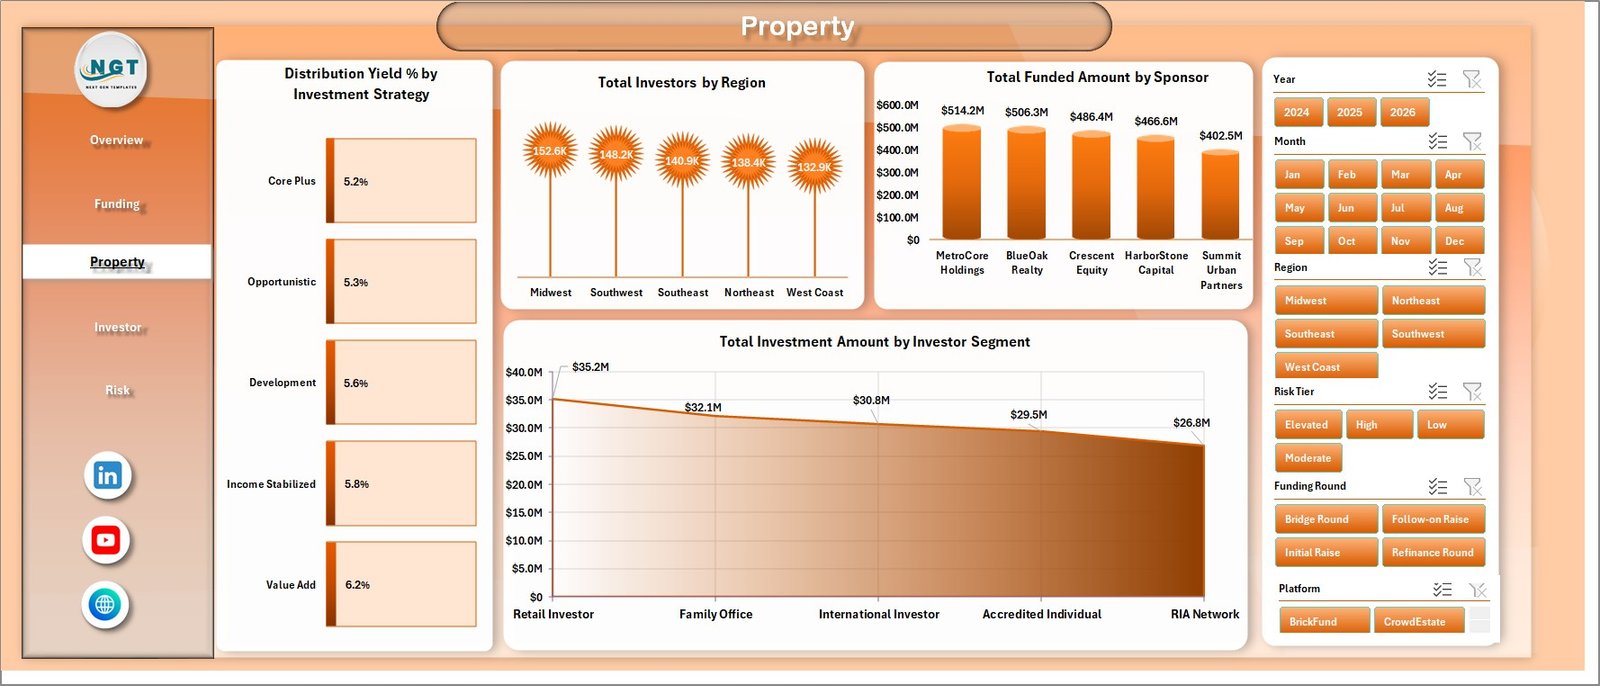
Property
4. Investor Page
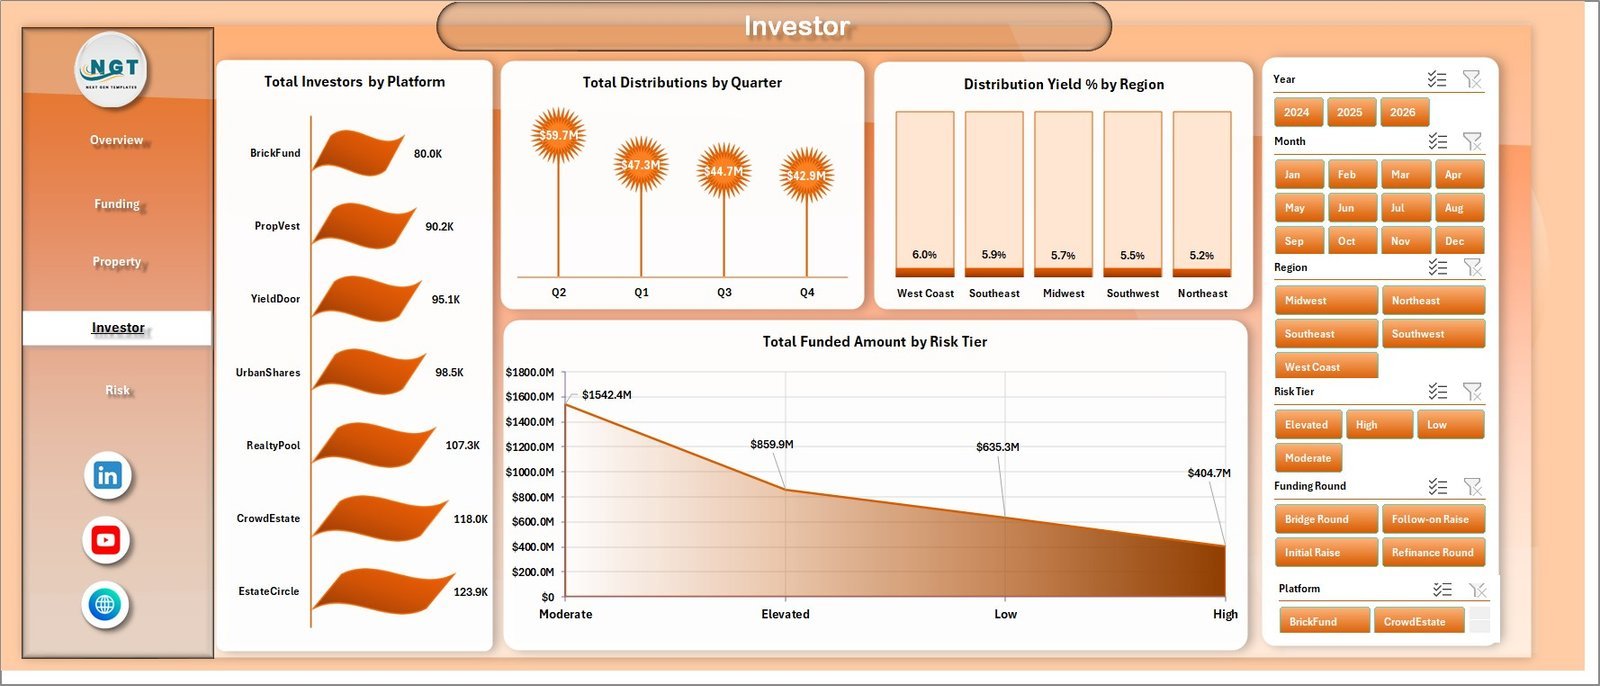
The Investor page focuses on platform participation, quarterly distributions, yield by region, and risk-tier funding exposure.
Total Investors by Platform: This chart compares investor count across crowdfunding platforms. It helps identify which platforms attract the largest investor base.
Total Distributions by Quarter: This chart tracks payout movement by quarter. It supports investor reporting and distribution trend reviews.
Distribution Yield % by Region: This view compares yield across regions. It helps investors understand which markets are producing stronger income returns.
Total Funded Amount by Risk Tier: This chart shows funding concentration by risk tier. It helps evaluate portfolio risk exposure at a glance.
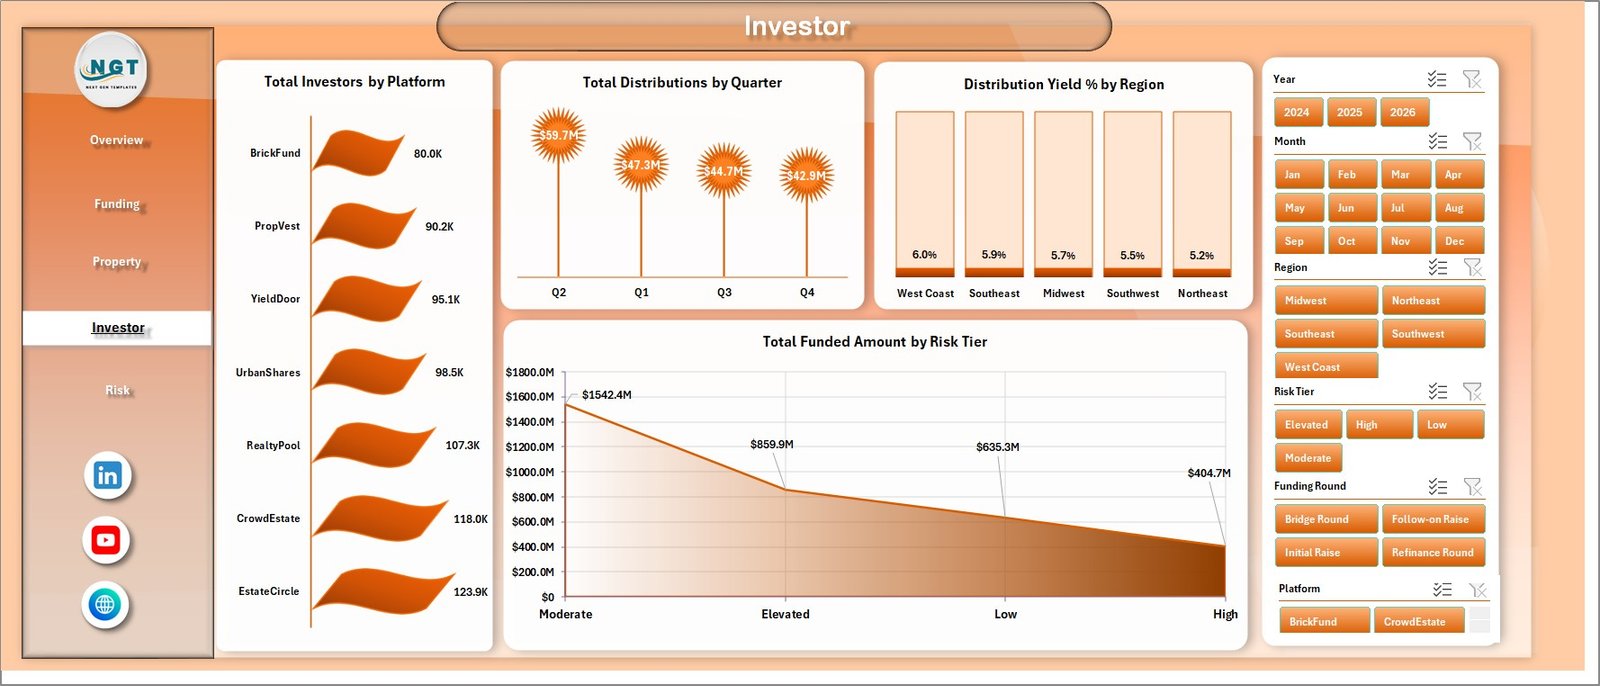
Investor
5. Risk Page
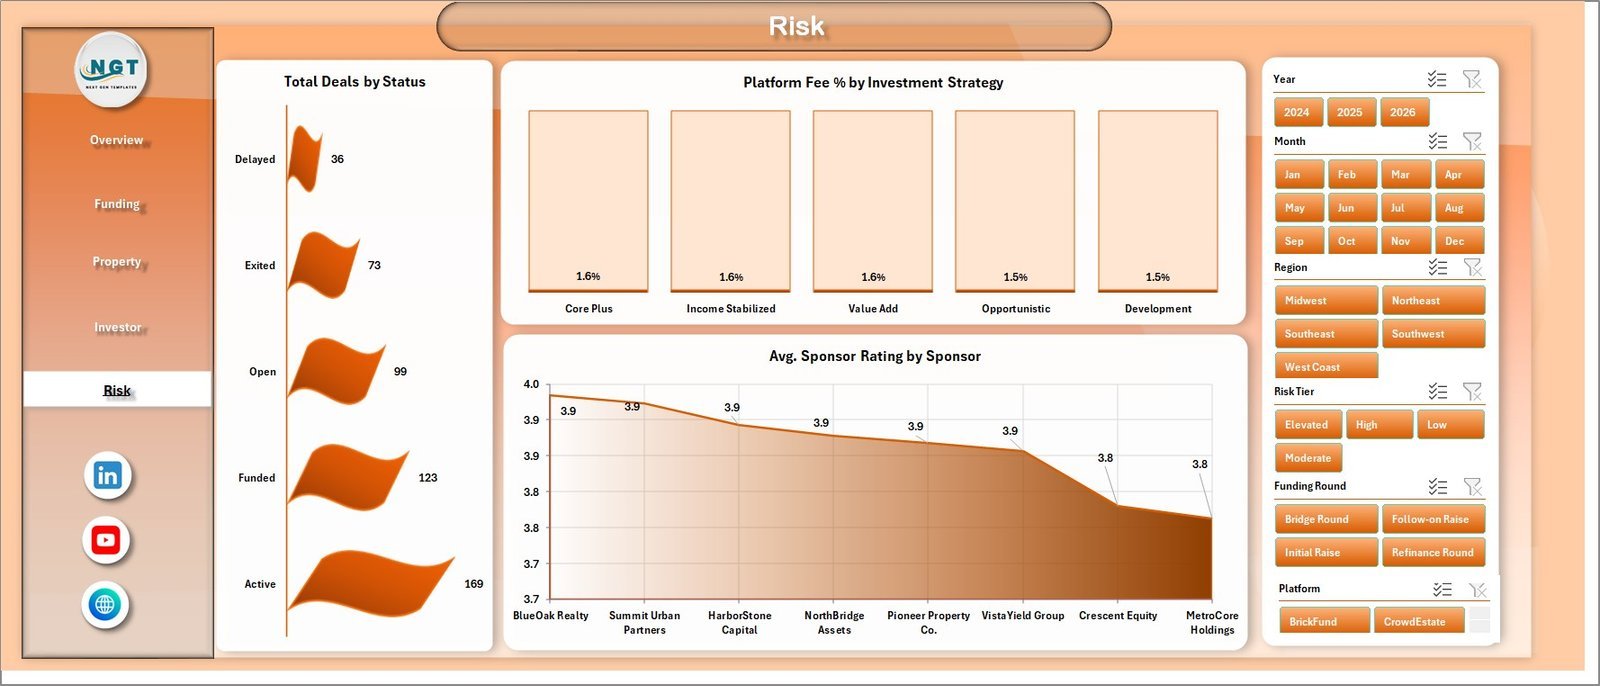
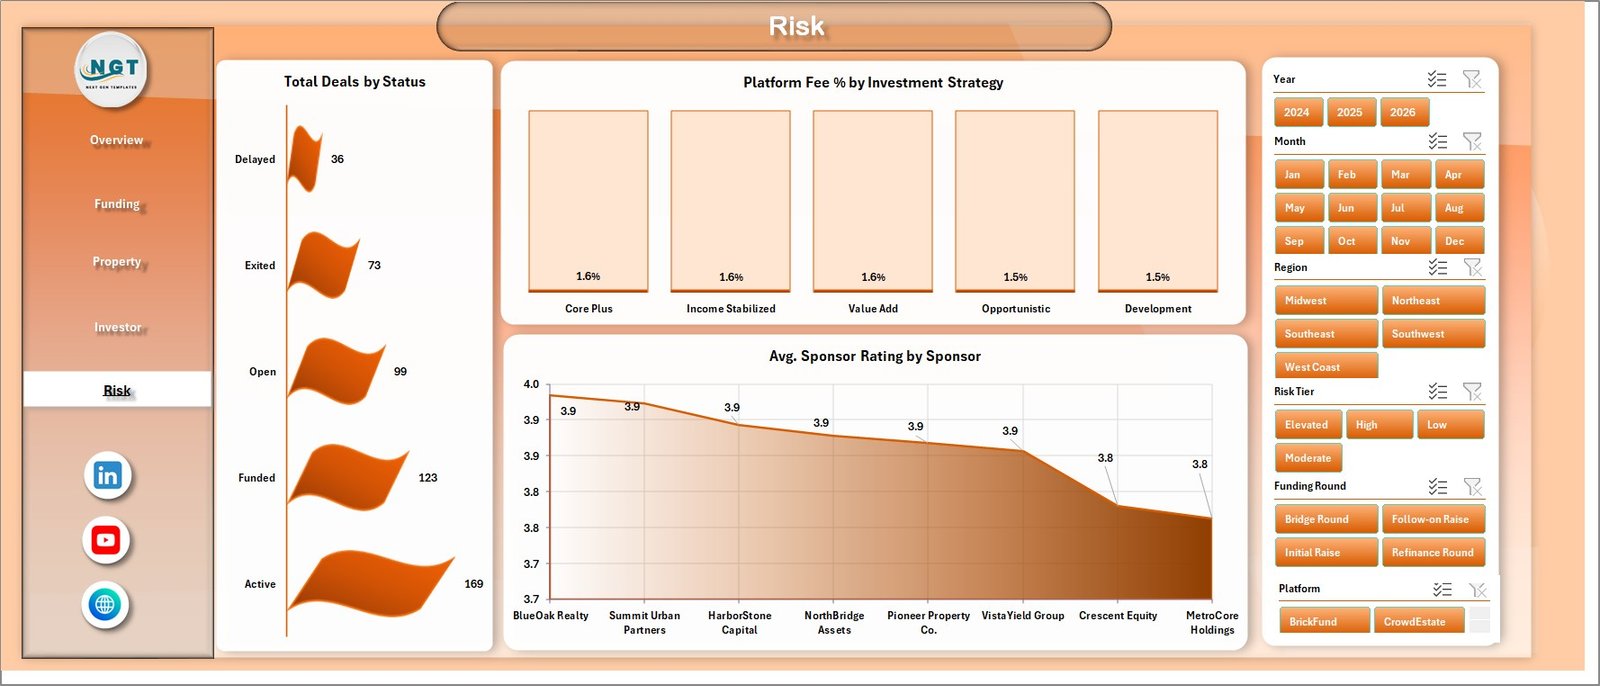
The Risk page highlights deal status, platform fees, investment strategy cost, and sponsor ratings.
Total Deals by Status: This chart shows deal count by status. It helps teams see how many deals are active, funded, closed, paused, or under review.
Platform Fee % by Investment Strategy: This chart compares fee burden by strategy. It helps evaluate whether certain strategies carry higher platform costs.
Avg. Sponsor Rating by Sponsor: This view compares sponsor ratings. It helps investors and analysts include sponsor quality in the review process.
Risk
6. Data Sheet Tab
The Data Sheet is where users add real estate crowdfunding records in the same format as the sample file. Keeping the columns consistent ensures the slicers, pivots, and charts continue working properly.

Data Sheet tab
7. Support Sheet Tab
The Support Sheet contains the pivot tables used to create the full dashboard dynamically. After updating the Data Sheet, go to the Data tab in the Excel Ribbon and click Refresh All. All pivots and dashboard charts will refresh, and this sheet can be kept hidden.

Support sheet tab
Real Estate Crowdfunding Dashboard in Excel vs. Google Sheets vs. Paid CRM/SaaS – Where This Fits
| Feature | This Excel dashboard | Google Sheets alternative | Paid real estate SaaS |
|---|---|---|---|
| Cost | $17.99 sale price | Template or internal build time | Recurring monthly or annual fee |
| Platform | Microsoft Excel | Browser spreadsheet | Vendor-hosted cloud system |
| Setup time | Replace data and refresh pivots | Build formulas and charts manually | Implementation and onboarding |
| Customizable fields | Editable workbook and data sheet | Editable sheet | Often controlled by admin settings |
| Real estate crowdfunding focus | Built around funding, investors, distributions, platforms, sponsors, and risk | Must be built or adapted | Depends on selected modules |
| Year-1 cost at 5 users | $17.99 plus Excel licensing | Template plus setup time | Can become hundreds or thousands |
Who This Template Is For – and Who It’s Not For
Best for: real estate crowdfunding sponsors, investment analysts, fund managers, investor relations teams, platform operators, and consultants who need a repeatable Excel reporting workbook.
Not for: teams needing live API sync, investor portal logins, payment processing, compliance workflow automation, or database-level permissions. Use this workbook as a reporting layer, not as a transaction system.
How to Use the Real Estate Crowdfunding Dashboard in Excel
- Open the workbook in Microsoft Excel.
- Replace the sample records in the Data Sheet with your own crowdfunding data.
- Keep the same column format so pivots and slicers stay connected.
- Go to the Excel Data ribbon and click Refresh All.
- Use slicers to filter by platform, region, property type, risk tier, sponsor, and other available fields.
Real-World Use Cases
Amanda, investor relations manager: uses the Overview and Investor pages before quarterly updates to explain funded amount, distributions, investor count, and yield trends.
Rohit, real estate sponsor: reviews the Funding page to compare funding completion by region and funding round before planning additional investor outreach.
Meera, portfolio analyst: uses the Risk page to compare deal status, sponsor ratings, and risk-tier exposure across active crowdfunding deals.
Frequently Asked Questions
What does this dashboard track?
It tracks funded amount, investment amount, investors, distributions, deals, expected IRR, risk tier, platform, region, sponsor, funding round, property type, and investor segment.
Can I add my own data?
Yes. Add records in the Data Sheet using the same structure as the sample data, then refresh the workbook.
Does it update automatically?
The charts and pivots update after you click Refresh All from the Excel Data ribbon.
Can I hide the Support Sheet?
Yes. The Support Sheet is used for pivot tables and can be hidden after setup.
Do I need advanced Excel skills?
No. Basic Excel knowledge is enough to replace data, refresh pivots, and use slicers.
Is this a subscription?
No. It is a one-time purchase with instant download access.
About the Author
Built by PK – Microsoft Certified Professional with 15+ years of Excel, Google Sheets, and Power BI experience. Founder of NextGenTemplates, reaching 300K+ subscribers across YouTube channels. Every template is hand-built and tested before release.
Explore Related Templates
Pair this dashboard with the Real Estate & Property Bundle, Real Estate Investment Trusts (REITs) KPI Dashboard in Excel, and Real Estate Agent Dashboard in HTML. Browse more Microsoft Excel templates and Excel dashboard templates.
Download the Real Estate Crowdfunding Dashboard in Excel today and start reviewing funding, investor, distribution, and risk performance in one workbook.
Last updated: August 1, 2026






















Reviews
There are no reviews yet.