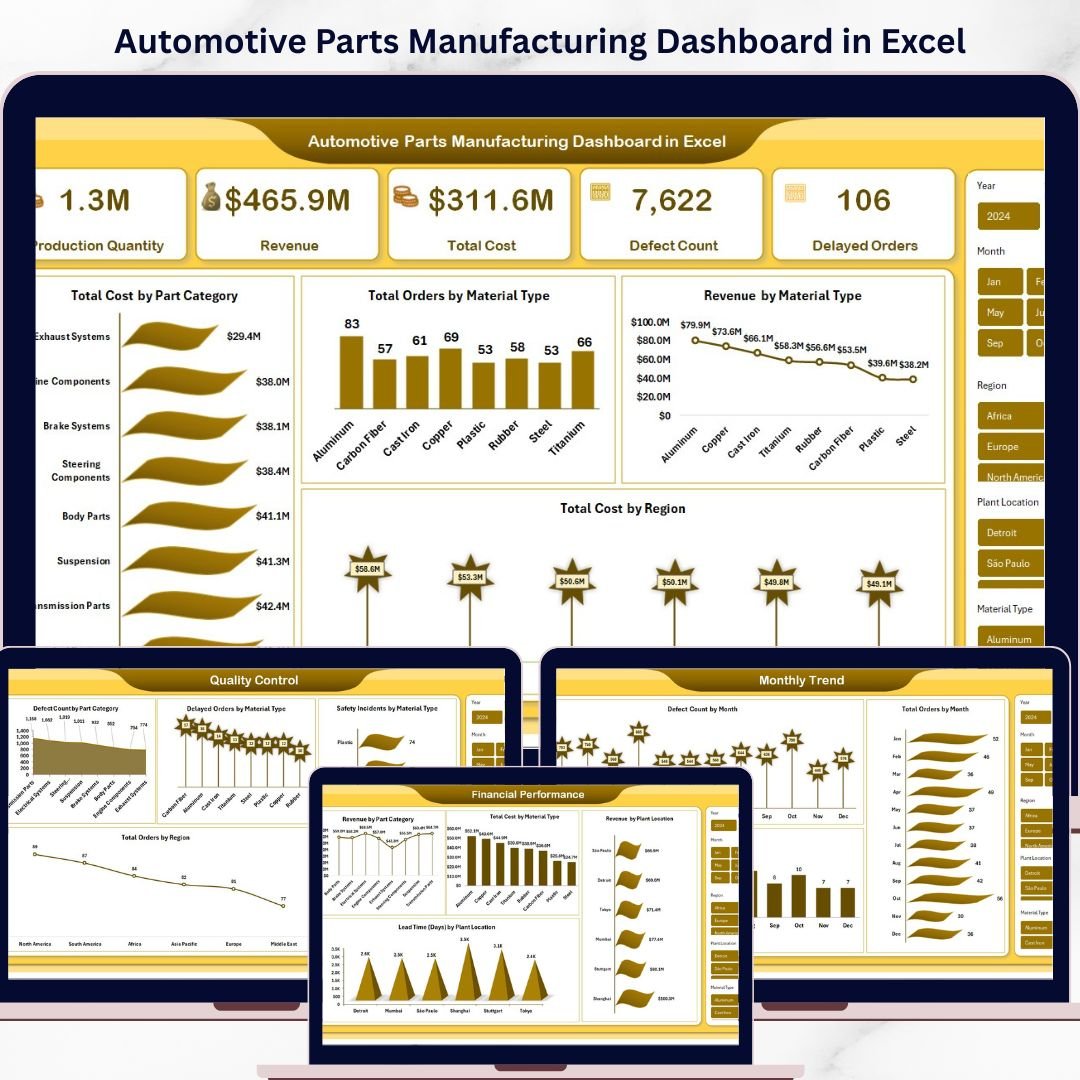
Take control of your factory performance like never before with the Automotive Parts Manufacturing Dashboard in Excel — a powerful, ready-to-use reporting tool built for modern manufacturers who want faster insights, better decisions, and stronger business control. In today’s fast-moving manufacturing environment, automotive parts companies deal with large volumes of production, quality, cost, revenue, delay, and safety data every single day. However, when this information sits in scattered spreadsheets and disconnected reports, teams struggle to see the full picture. That is exactly where this dashboard makes a big difference.
This smart Excel dashboard brings your most important manufacturing KPIs into one interactive and easy-to-use system. As a result, you can quickly monitor production quantity, track defect count, review delayed orders, study revenue and cost patterns, and analyze monthly performance trends without wasting time on manual reporting. Whether you are a plant manager, production supervisor, finance analyst, quality manager, or business owner, this dashboard helps you stay informed and take action faster.
🚗 Key Features of Automotive Parts Manufacturing Dashboard in Excel
The Automotive Parts Manufacturing Dashboard in Excel is designed to give you a complete view of manufacturing performance in one place. It helps users turn raw operational data into clear insights through structured sheets, charts, and summaries.
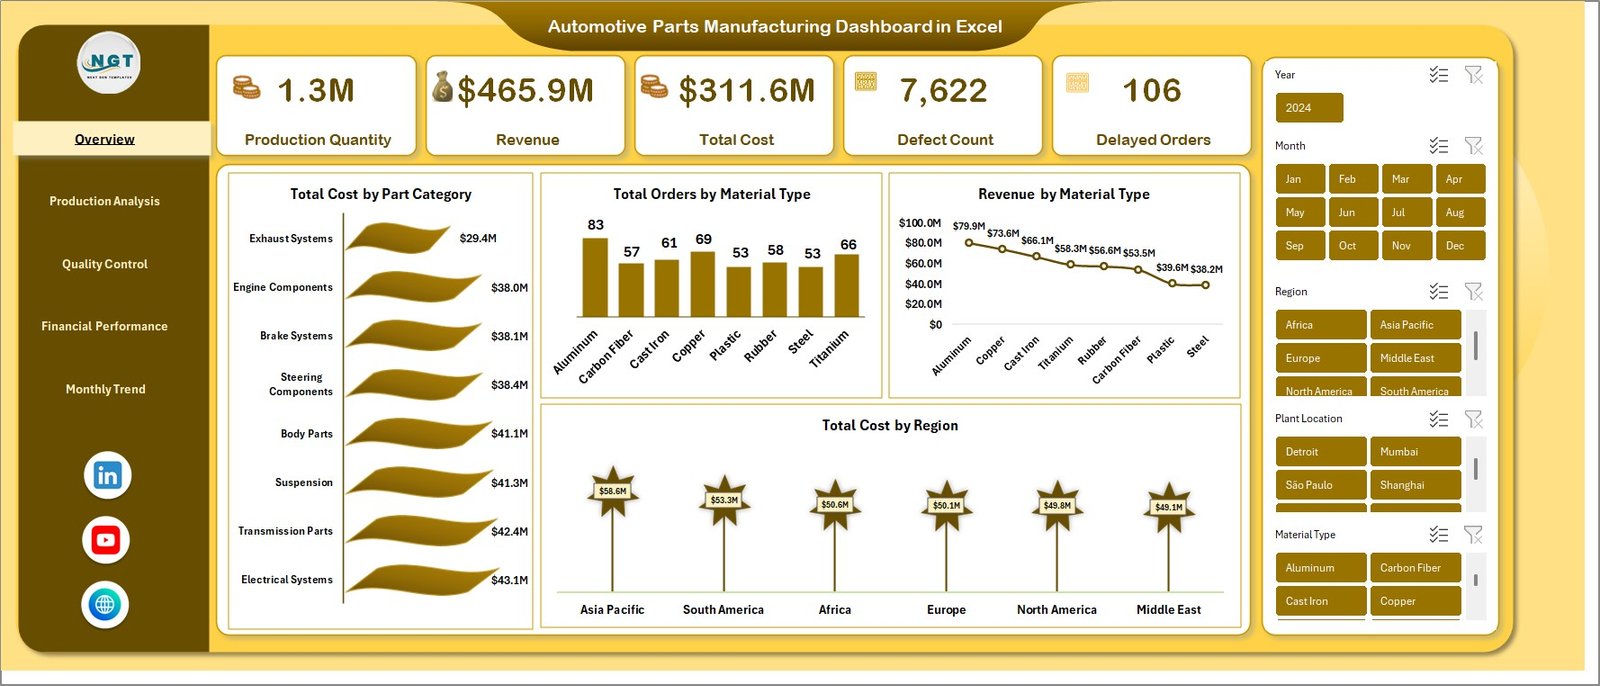
✨ Track Production Quantity, Revenue, Total Cost, Defect Count, and Delayed Orders from one central dashboard
✨ Analyze Total Cost by Part Category and Total Cost by Region for better financial visibility
✨ Monitor Total Orders by Material Type and Revenue by Material Type for smarter planning
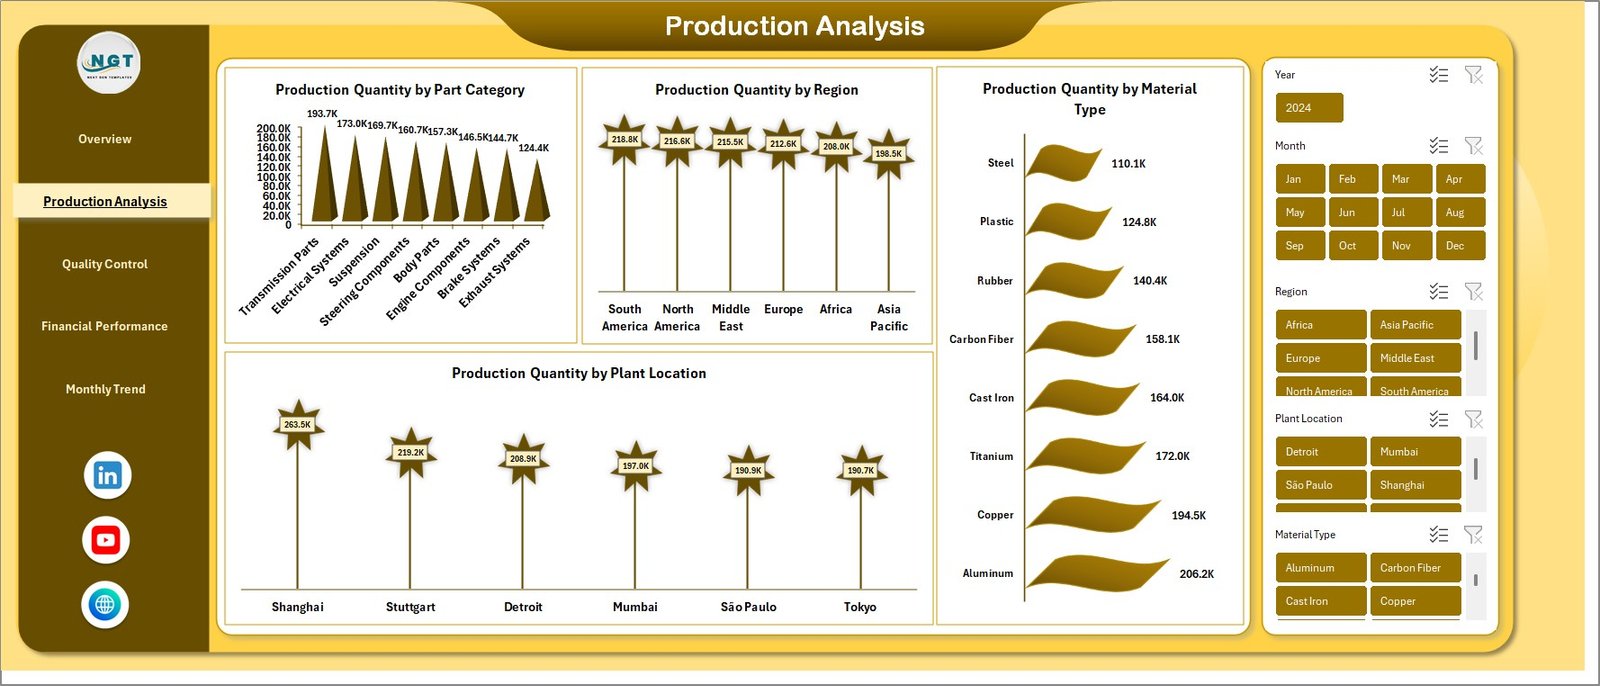
✨ Compare Production Quantity by Part Category, Region, Material Type, and Plant Location
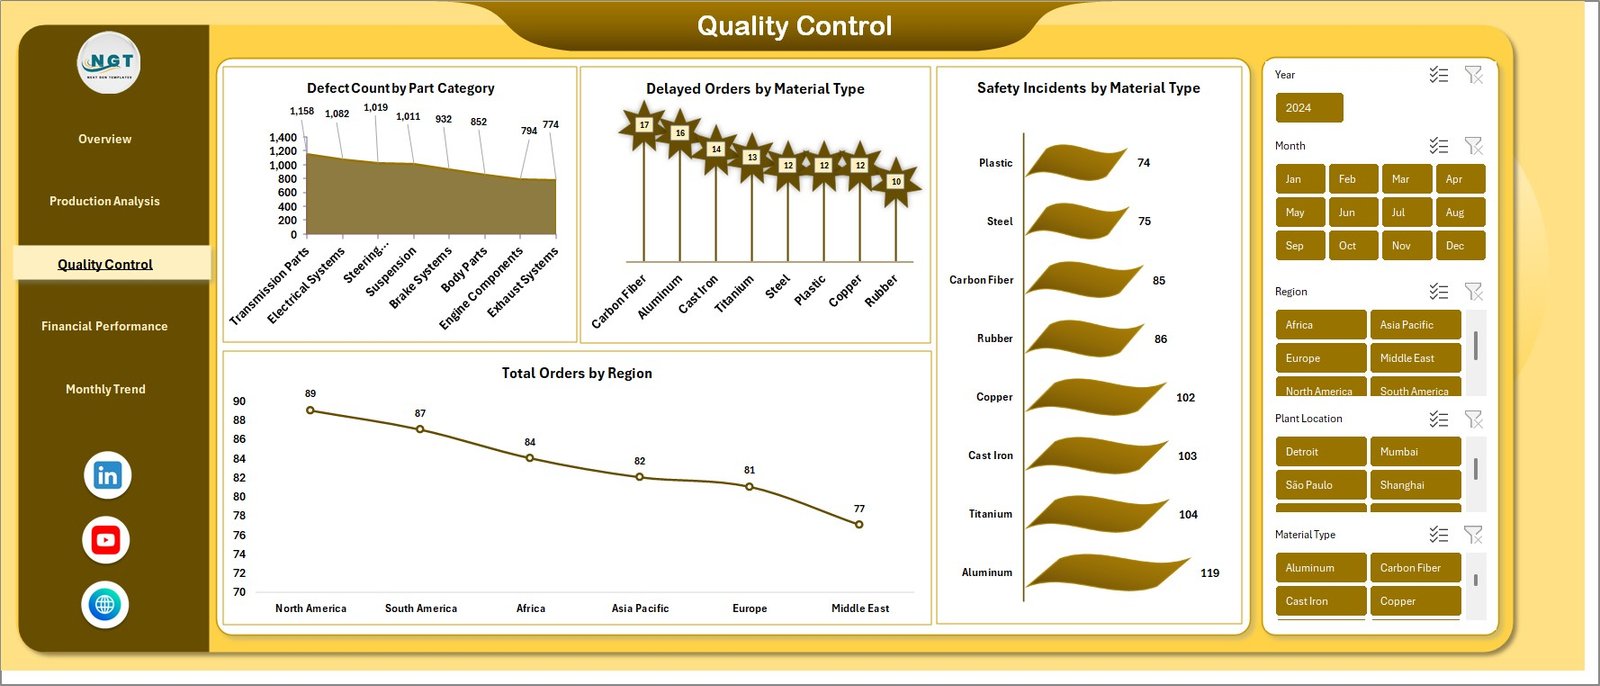
✨ Review Defect Count by Part Category, Delayed Orders by Material Type, and Safety Incidents by Material Type
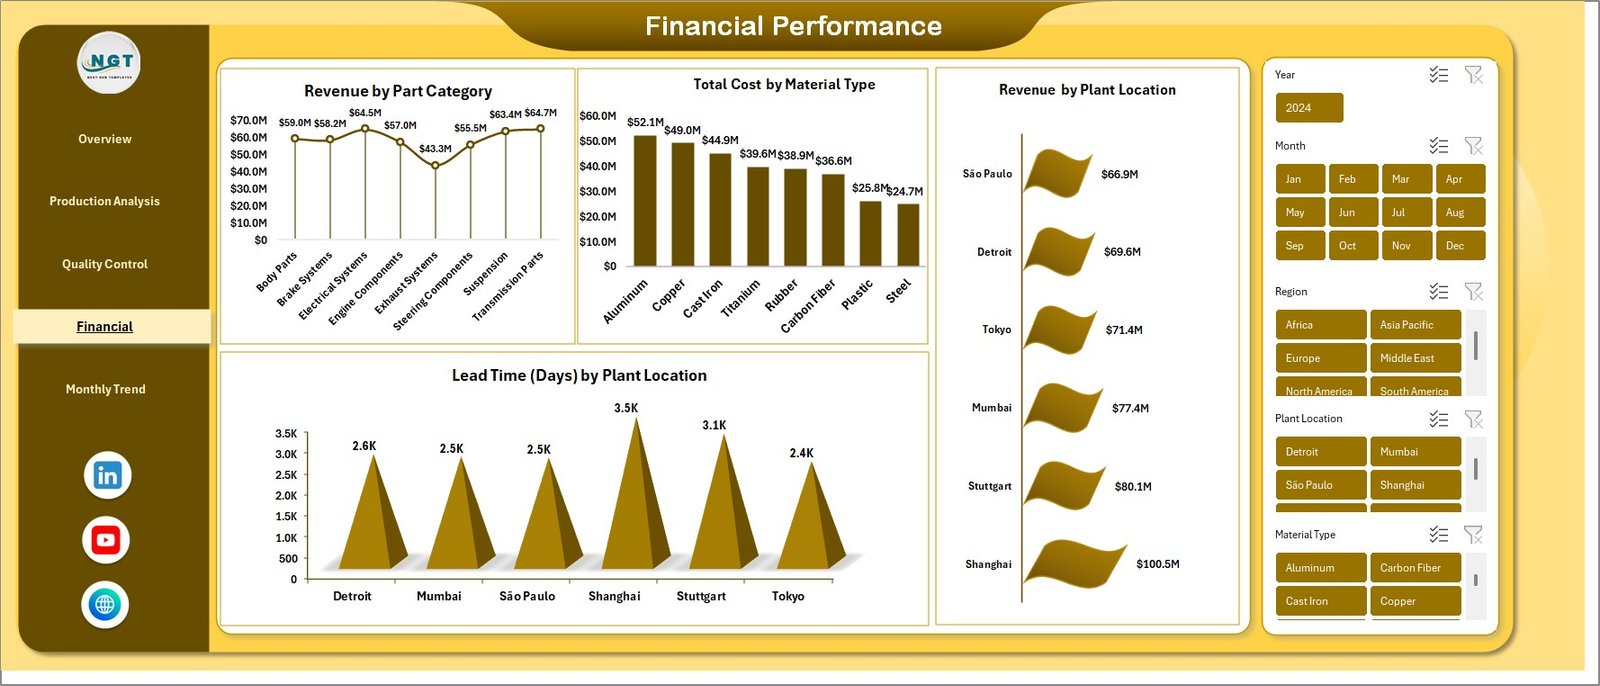
✨ Study Revenue by Part Category, Total Cost by Material Type, and Lead Time by Plant Location
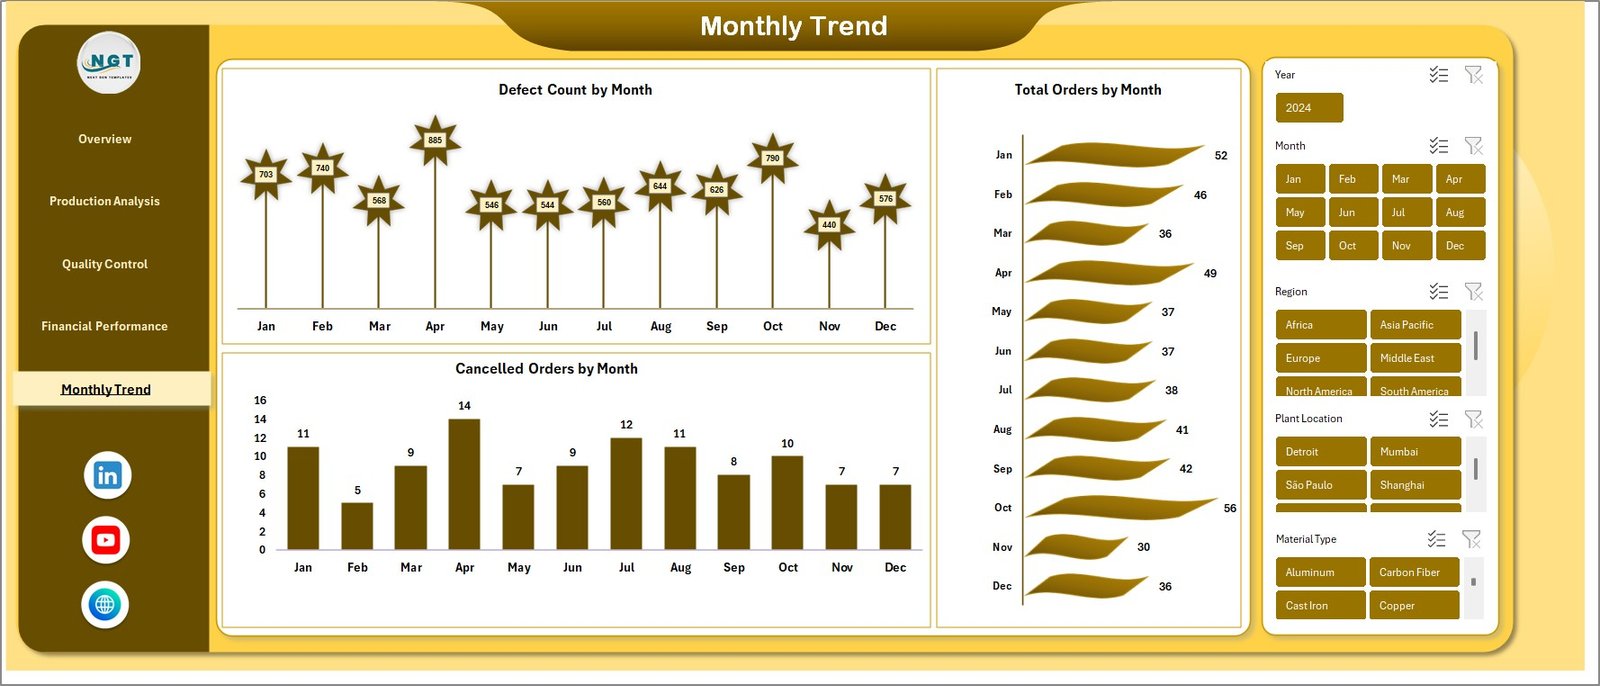
✨ Track monthly changes through Defect Count by Month, Total Orders by Month, and Cancelled Orders by Month
✨ Use a familiar Excel-based system that is practical, flexible, and easy for teams to adopt
Because of these features, the dashboard helps reduce reporting confusion and improves coordination across departments.
📊 What’s Inside the Automotive Parts Manufacturing Dashboard in Excel
This ready-to-use dashboard includes multiple sheet tabs to help you analyze different areas of manufacturing performance in a structured way.
1. Overview Sheet
This is the main summary page of the dashboard. It gives you a quick snapshot of output, cost, revenue, defects, and delayed orders. Therefore, decision-makers can understand the current business situation in seconds.
2. Production Analysis
This page focuses on production performance. It shows production quantity by part category, region, material type, and plant location. As a result, teams can compare output and identify performance gaps quickly.
3. Quality Control
This tab helps you monitor defects, safety incidents, delays, and order distribution. So, quality teams can find risk areas and improve process control faster.
4. Financial Performance
This section provides insights into revenue, cost, and lead time. Therefore, finance teams and management can make smarter budgeting, pricing, and profitability decisions.
5. Monthly Trends
This page tracks performance over time. It helps you understand whether defects, orders, and cancellations are improving or getting worse month by month.
🛠️ How to Use the Automotive Parts Manufacturing Dashboard in Excel
Using this dashboard is simple and practical. First, enter or refresh your source data regularly to keep the dashboard accurate. Then start with the Overview Sheet to get a high-level picture of your business performance. After that, move to the detailed tabs like Production Analysis, Quality Control, Financial Performance, and Monthly Trends to explore deeper insights.
You can compare plant locations, material types, regions, and part categories to identify bottlenecks, high-cost areas, and quality issues. In addition, you can use the trend charts to understand recurring problems and support long-term planning. Because everything is organized in Excel, your team can begin using it without learning complicated software.
👥 Who Can Benefit from This Automotive Parts Manufacturing Dashboard in Excel
This dashboard is ideal for a wide range of professionals in the automotive manufacturing industry.
🚀 Plant Managers who want to monitor plant-level performance and lead time
🚀 Production Supervisors who need to track output across categories and locations
🚀 Quality Managers who want to control defects, delays, and safety incidents
🚀 Finance Analysts who need stronger visibility into revenue and cost trends
🚀 Operations Heads who want to improve efficiency across plants and materials
🚀 Business Owners and Directors who need quick, high-level decision support
No matter your role, this dashboard helps you save time, reduce confusion, and make smarter manufacturing decisions.
Click hare to read the Detailed blog post
Watch the step-by-step video tutorial:
Watch the step-by-step video tutorial:
Learn more about the full features, business benefits, and detailed breakdown of this dashboard in our complete blog post.


