


The Footwear Manufacturing Dashboard in Excel helps production, quality, costing, and operations teams turn factory records into a clear 7-sheet reporting workbook. It includes 4 executive KPI cards, 18 analysis charts, slicer-based filtering, a structured Data sheet, and a pivot-backed Support sheet. Join 8,400+ teams in 40+ countries using NextGenTemplates for one-time-purchase spreadsheet dashboards. Instant download, no subscription, no per-user fees, and lifetime access.
Key Features of Footwear Manufacturing Dashboard in Excel
- 7 worksheet tabs: Overview, Production Trend, Quality Analysis, Cost Analysis, Line Performance, Data, and Support.
- 4 KPI cards: Track Total Quantity Produced, Total Revenue, Total Profit, and Total Manufacturing Cost.
- 18 analysis charts: Review revenue, cost, quality score, defects, hours, shift output, production line completion, factory performance, brand tier, and material usage.
- Excel slicers: Filter dashboard pages quickly without rebuilding reports.
- Editable data sheet: Replace the sample records with your own footwear manufacturing data.
- Pivot-backed support sheet: Refresh all charts from the Excel Data tab after updating data.
- One-time purchase: No subscription, no per-user charges, and lifetime access to the file.
What’s Inside the Footwear Manufacturing Dashboard in Excel
Overview Page
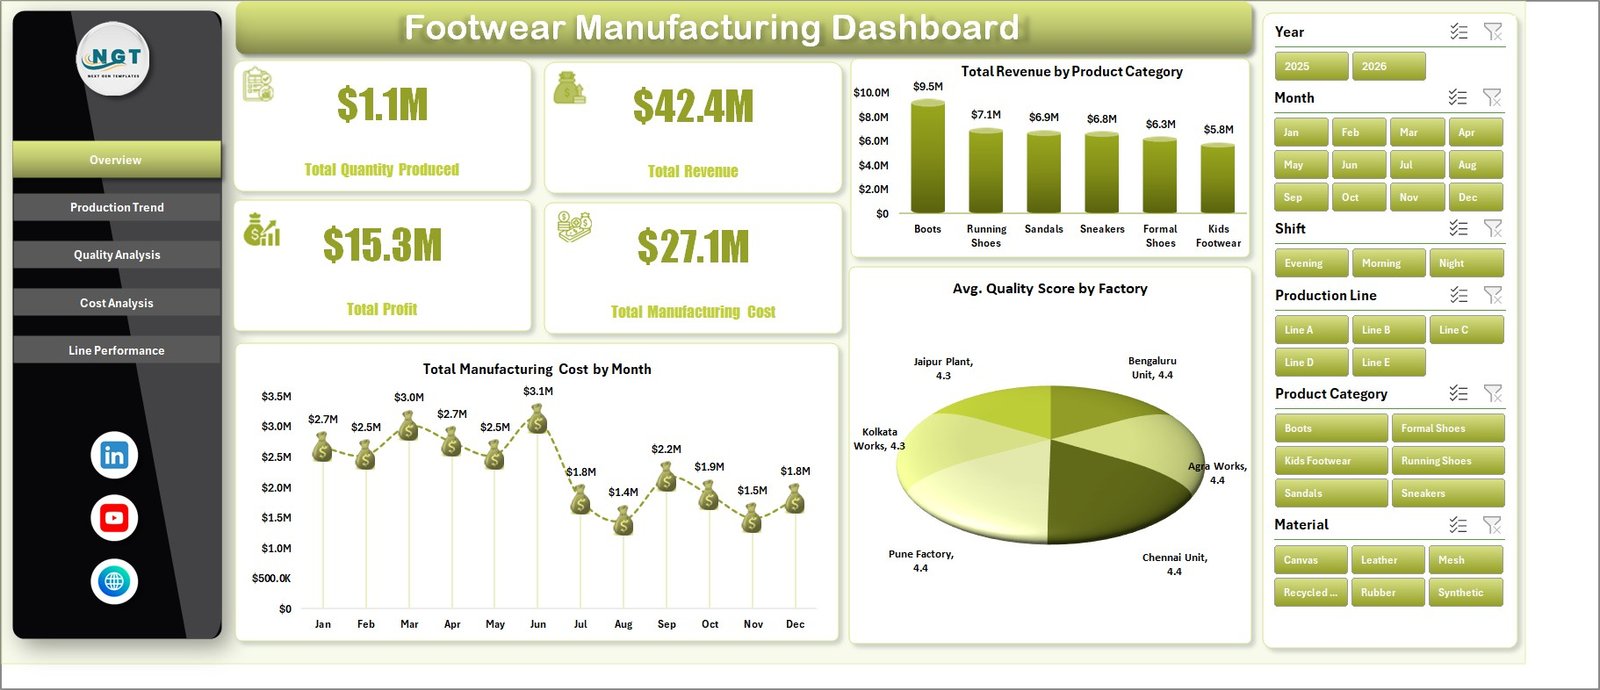
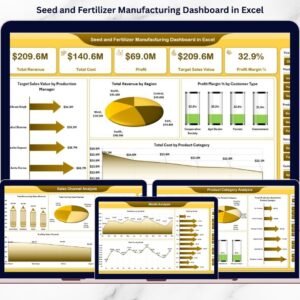
The Overview page gives managers a high-level view of factory performance. Cards show Total Quantity Produced, Total Revenue, Total Profit, and Total Manufacturing Cost, while slicers help users filter the dashboard quickly.
Total Revenue by Product Category: Compares revenue across footwear product groups. Use it to identify the styles or categories creating the strongest sales contribution.
Total Manufacturing Cost by Month: Shows monthly cost movement so production and finance teams can spot cost pressure, seasonal variation, or unusual spend changes.
Avg. Quality Score by Factory: Compares quality performance across factories. This helps leaders identify plants that need process review, training, or supplier-quality action.
Footwear Manufacturing Dashboard in Excel
Production Trend
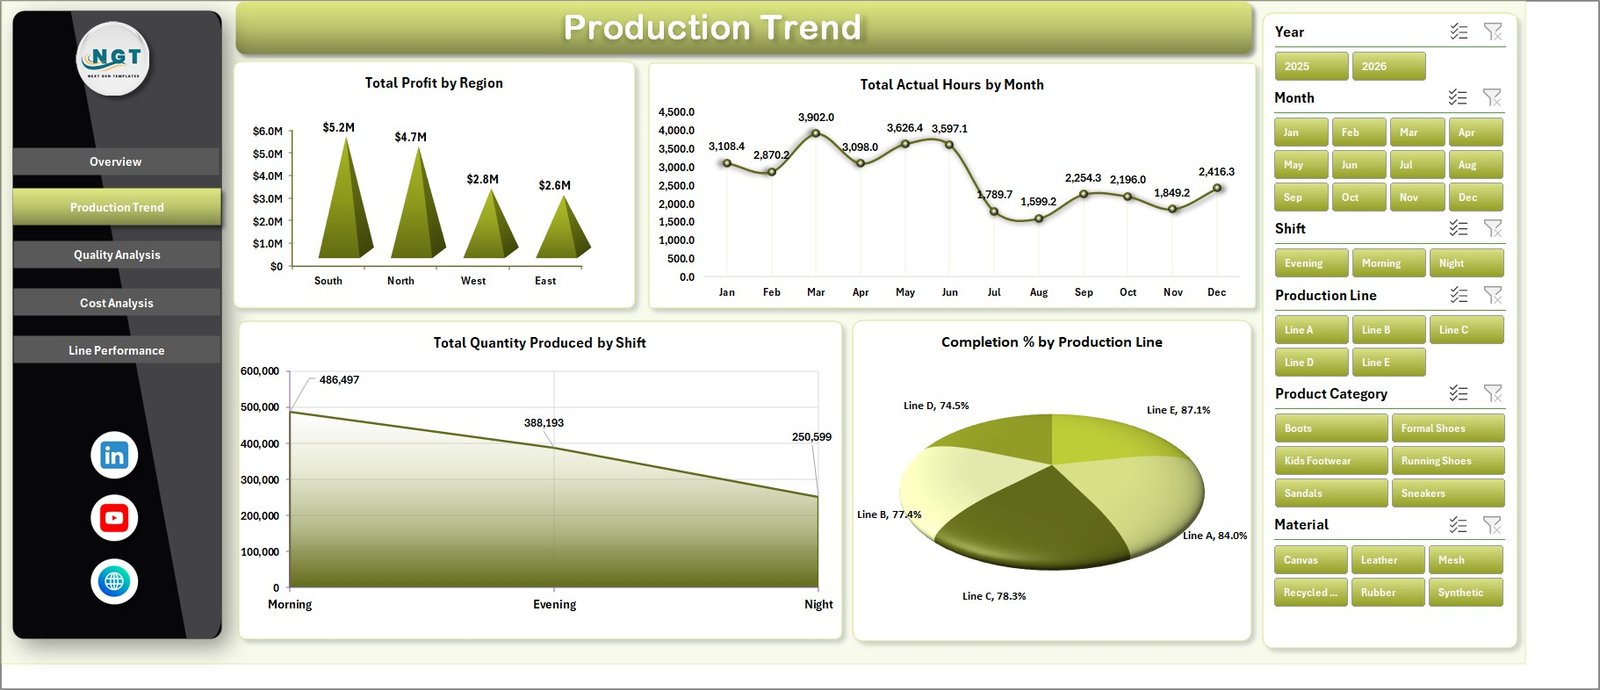
The Production Trend sheet focuses on profit, actual hours, shift output, and production line completion. It includes Total Profit by Region, Total Actual Hours by Month, Total Quantity Produced by Shift, and Completion % by Production Line.
Production Trend
Quality Analysis
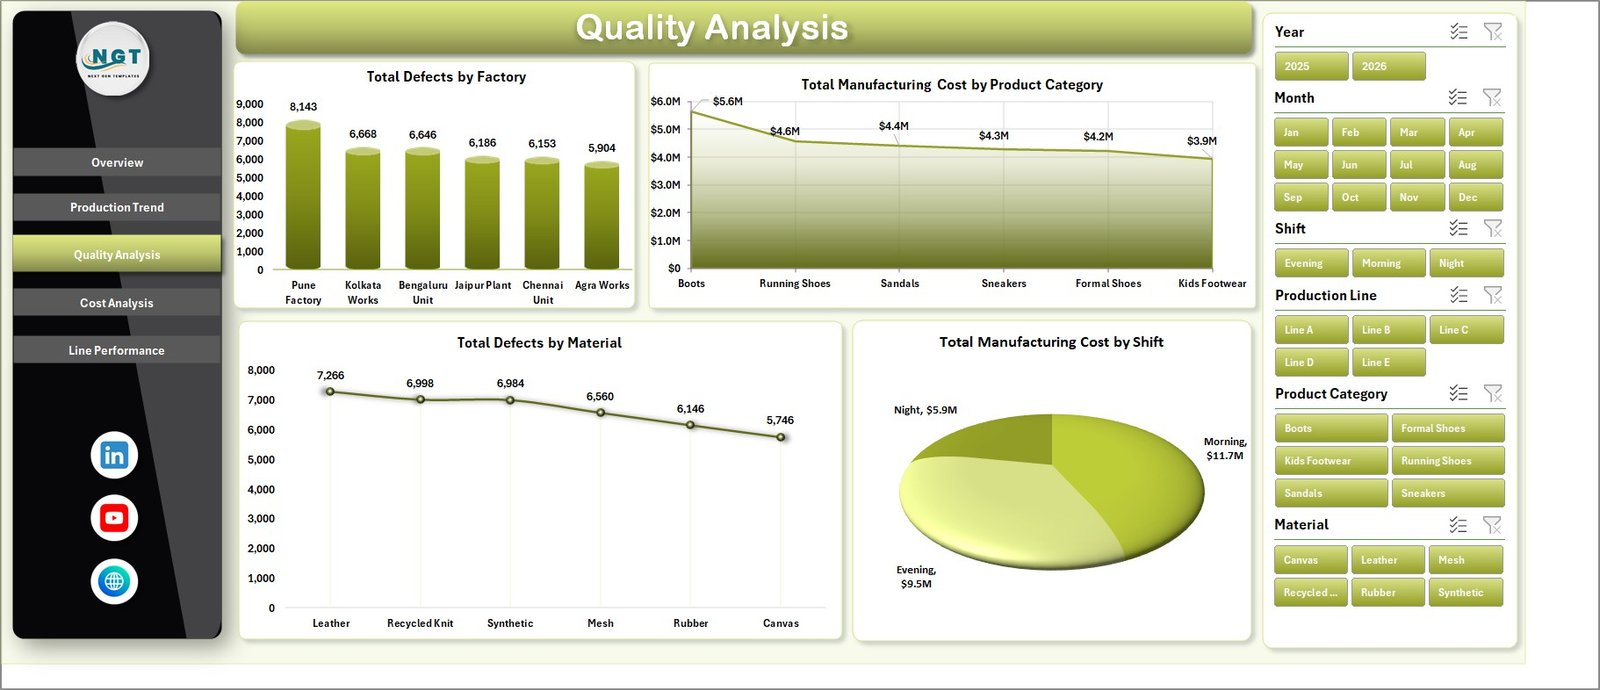
The Quality Analysis sheet helps teams review factory defects, product category costs, material-level defects, and shift-level manufacturing cost. It includes Total Defects by Factory, Total Manufacturing Cost by Product Category, Total Defects by Material, and Total Manufacturing Cost by Shift.
Quality Analysis
Cost Analysis
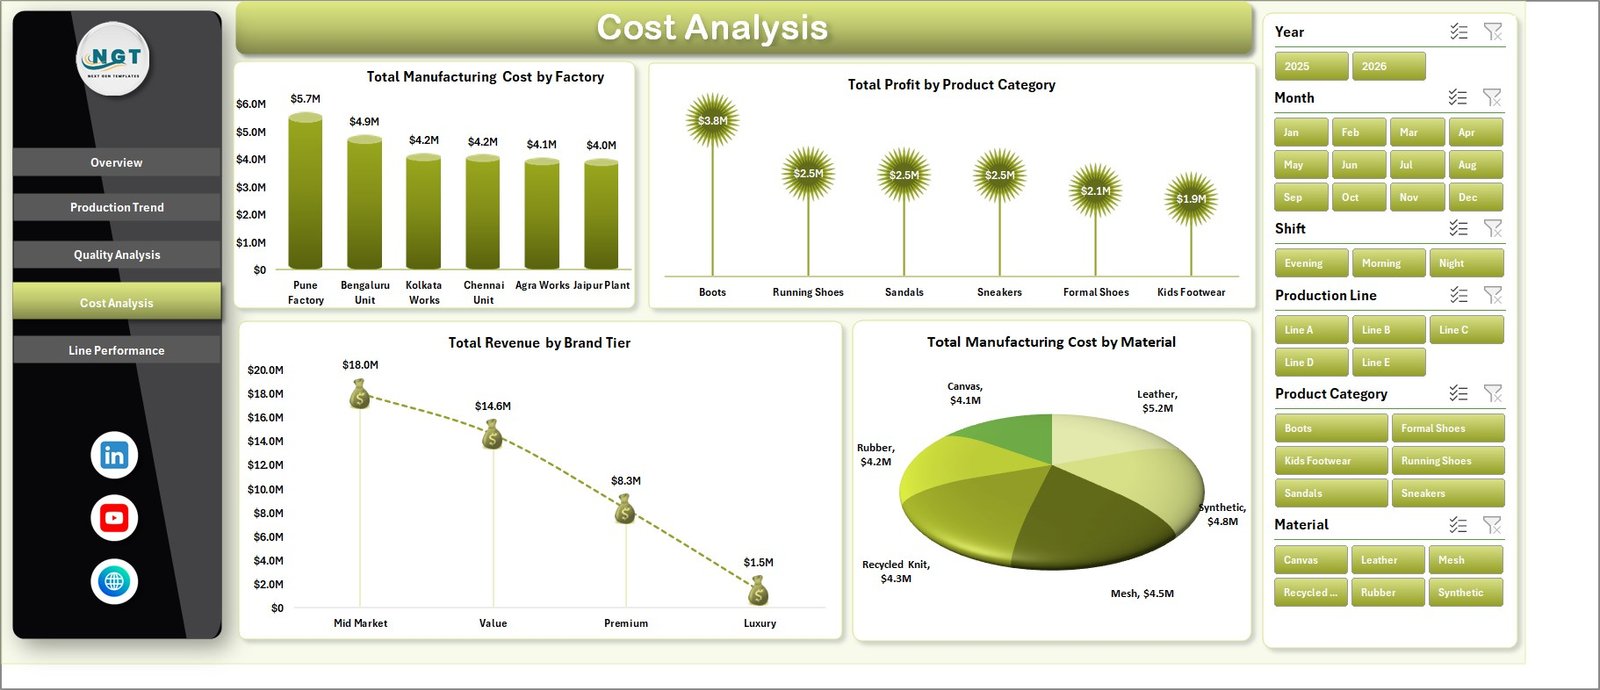
The Cost Analysis sheet supports margin and cost-control review. It includes Total Manufacturing Cost by Factory, Total Profit by Product Category, Total Revenue by Brand Tier, and Total Manufacturing Cost by Material.
Cost Analysis
Line Performance
The Line Performance sheet connects production output, downtime, and regional revenue. It includes Total Quantity Produced by Production Line, Total Downtime Hours by Shift, and Total Revenue by Region.
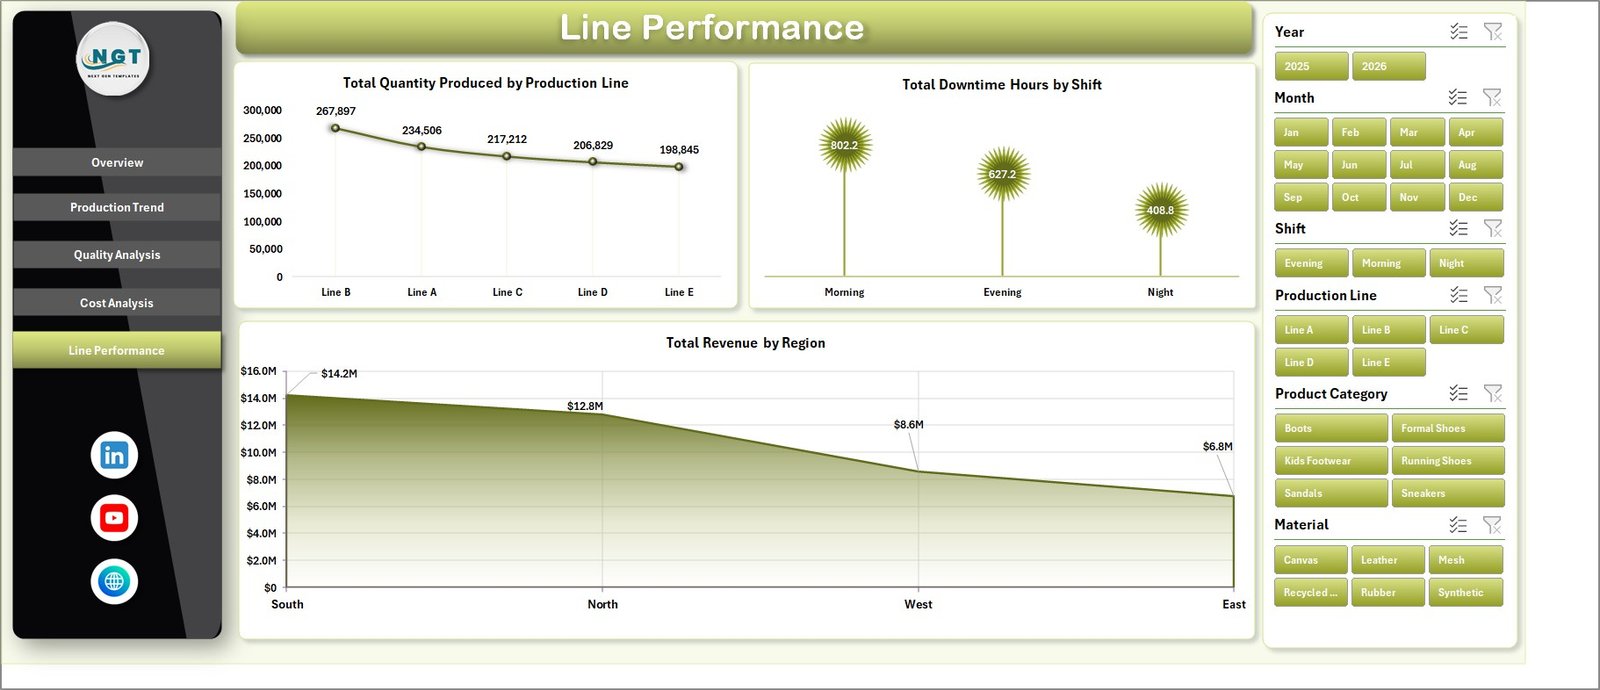
Line Performance
Data Sheet Tab
The Data sheet is where users add footwear manufacturing records in the same structured format. Keep the column layout unchanged so dashboard cards, charts, slicers, and pivot tables continue working correctly.
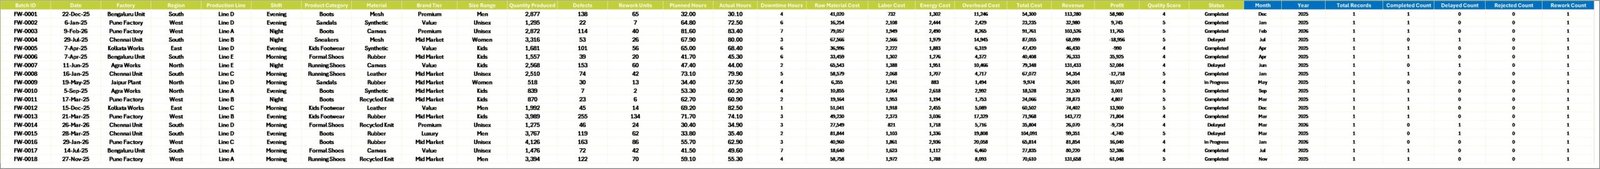
Data Sheet tab
Support Sheet Tab
The Support sheet contains multiple pivot tables used to build the dashboard dynamically. After updating the Data sheet, go to the Data tab in the Excel Ribbon and click Refresh All. You can keep this sheet hidden after setup.
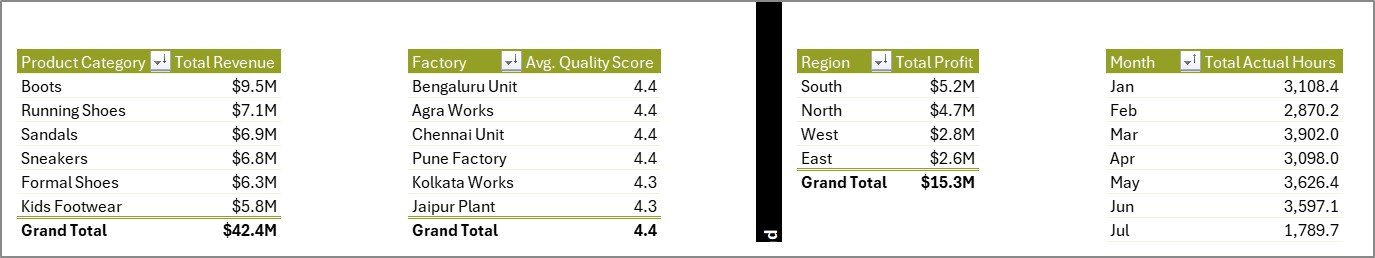
Support sheet tab
Footwear Manufacturing Dashboard in Excel vs. Google Sheets vs. Paid CRM/SaaS – Where This Fits
| Feature | This Excel Dashboard | Google Sheets Alternative | Paid Manufacturing SaaS |
|---|---|---|---|
| Cost | $17.99 one-time | Low one-time cost | Monthly subscription |
| Platform | Microsoft Excel | Browser-based Sheets | Cloud SaaS or MRP |
| Setup time | Open, replace data, refresh | Copy file and replace data | Implementation and configuration |
| Real-time team collaboration | Possible with OneDrive or SharePoint | Native Google Drive sharing | Built in |
| Mobile access | Excel app or browser | Google Sheets app or browser | Vendor app |
| Customizable fields | High for Excel users | High for spreadsheet users | Limited by plan and permissions |
| Share with link | Possible with OneDrive | Native sharing | Usually role-based |
| Year-1 cost at 5 users | $17.99 total | Low one-time cost | Often hundreds or thousands of dollars |
| Best use case | Footwear production, cost, quality, and line reporting | Collaborative lightweight reporting | Full ERP, MRP, or shop-floor workflow |
Who This Template Is For – and Who It’s Not For
This template is for footwear manufacturers, factory managers, production supervisors, quality analysts, operations teams, and finance teams that need quick visibility into output, cost, profit, defects, downtime, factories, materials, shifts, and production lines.
It is not a replacement for ERP, MRP, live machine integration, barcode scanning, purchase order automation, or shop-floor execution software. If you need controlled workflows and live system integrations, dedicated manufacturing software may be a better fit.
How to Use the Footwear Manufacturing Dashboard in Excel
- Download and unzip the Excel dashboard file.
- Open the workbook in Microsoft Excel.
- Go to the Data sheet and replace the sample records with your own footwear manufacturing data.
- Keep the same column structure so pivots and charts work correctly.
- Go to the Excel Ribbon Data tab and click Refresh All.
- Use slicers to review overview, production trend, quality, cost, and line performance views.
- Hide the Support sheet if you want a cleaner workbook for end users.
Real-World Use Cases
Aisha, Factory Manager: reviews output by production line and downtime by shift before the daily production meeting.
Rahul, Quality Lead: checks defects by factory and material to prioritize corrective action with supervisors and suppliers.
Meera, Cost Analyst: uses monthly manufacturing cost, product category profit, and material cost views for cost-control commentary.
Frequently Asked Questions
Does this dashboard work in Microsoft Excel?
Yes. It is built for Microsoft Excel and uses worksheets, slicers, charts, and pivot tables.
Can I replace the sample data?
Yes. Replace the sample rows in the Data sheet, keep the same format, and click Refresh All from the Data tab.
What pages are included?
The workbook includes Overview, Production Trend, Quality Analysis, Cost Analysis, Line Performance, Data, and Support sheets.
Can I hide the Support sheet?
Yes. The Support sheet powers the dashboard with pivot tables and can be hidden after setup.
Is this a full ERP or MRP system?
No. It is a reporting dashboard for analysis. It does not include production scheduling, inventory netting, purchase orders, or shop-floor execution.
Can I customize the dashboard?
Yes. Experienced Excel users can edit chart fields, slicers, colors, formulas, and the data model as needed.
About the Author
Built by PK – Microsoft Certified Professional with 15+ years of Excel, Google Sheets, and Power BI experience. Founder of NextGenTemplates, reaching 300K+ subscribers across YouTube channels. Every template is hand-built and tested before release.
Explore Related Templates
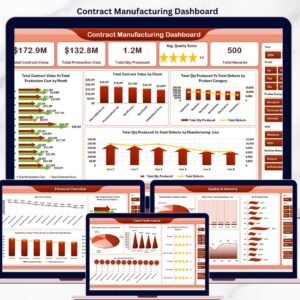
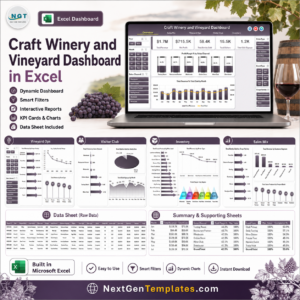
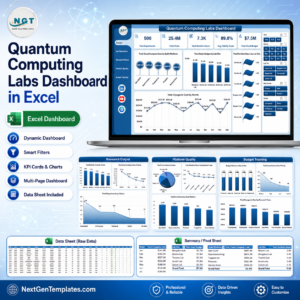
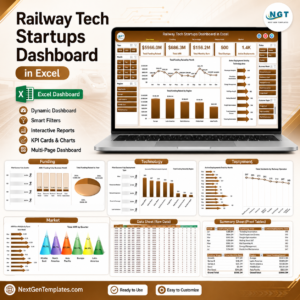
You may also like the Footwear Manufacturing KPI Dashboard in Excel, Fertilizer Manufacturing Dashboard in Excel, Packaging Machine Downtime Dashboard in Excel, and Contract Manufacturing Dashboard in Google Sheets. Browse more Excel Dashboard templates and Manufacturing Excel templates.
Click here to read the detailed blog post.
Download the Footwear Manufacturing Dashboard in Excel today and turn footwear production data into clear factory insight.
Last updated: June 15, 2026.


Reviews
There are no reviews yet.