
Struggling to track office issues across emails, spreadsheets, and disconnected systems? You’re not alone. Many organizations face delays, missed escalations, and poor visibility when managing workplace issues manually.
👉 What if you could track, analyze, and resolve every issue in one powerful dashboard?
Introducing the Office Issues Management Dashboard in Power BI — your all-in-one solution to monitor internal issues, improve response times, and boost workplace productivity.
This interactive dashboard transforms complex issue data into clear, actionable insights. As a result, managers can make faster decisions, reduce bottlenecks, and improve employee satisfaction effortlessly.
📊 Key Features of Office Issues Management Dashboard in Power BI
✨ 5 Fully Interactive Dashboard Pages – Analyze issues from multiple angles with structured insights
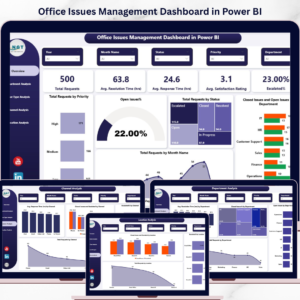
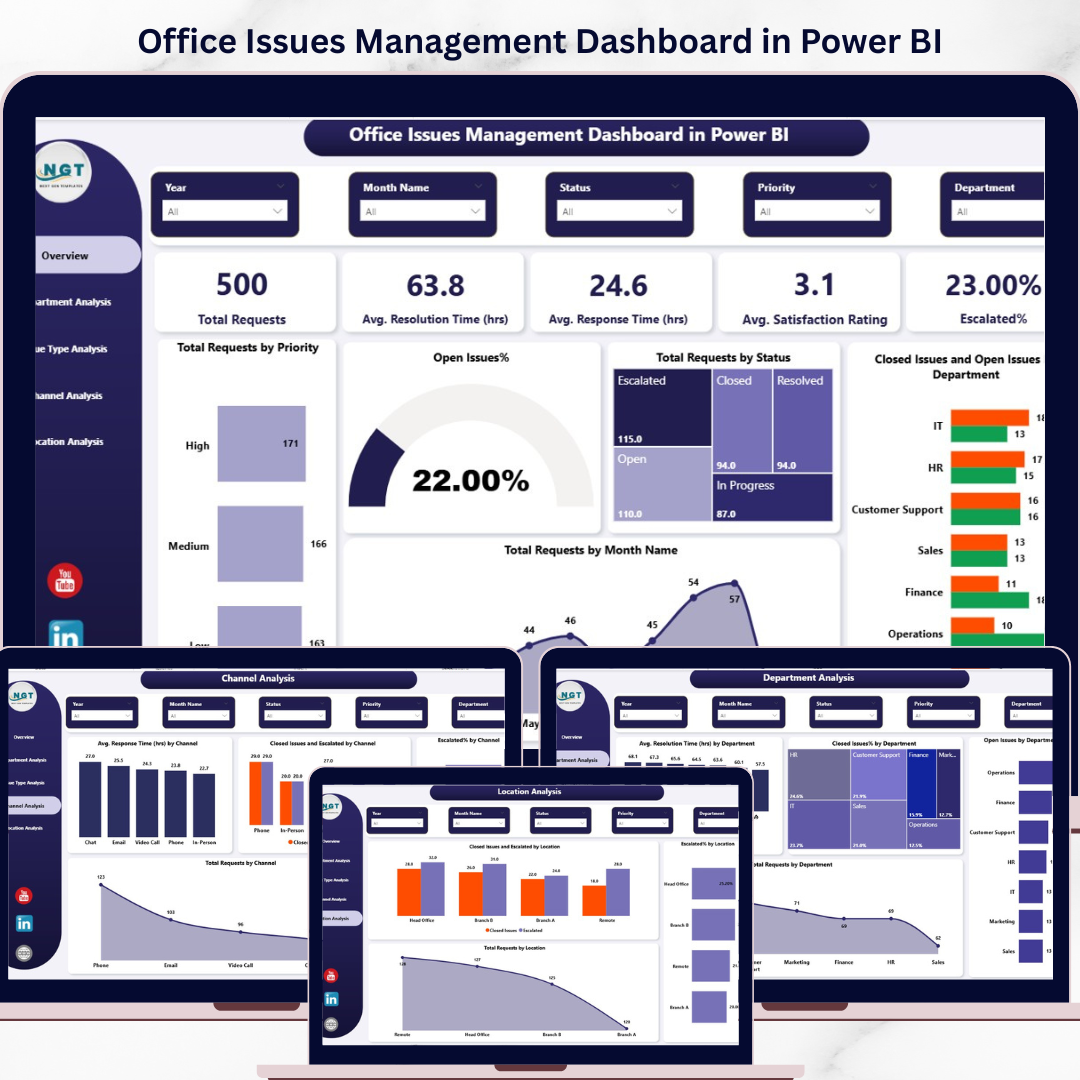
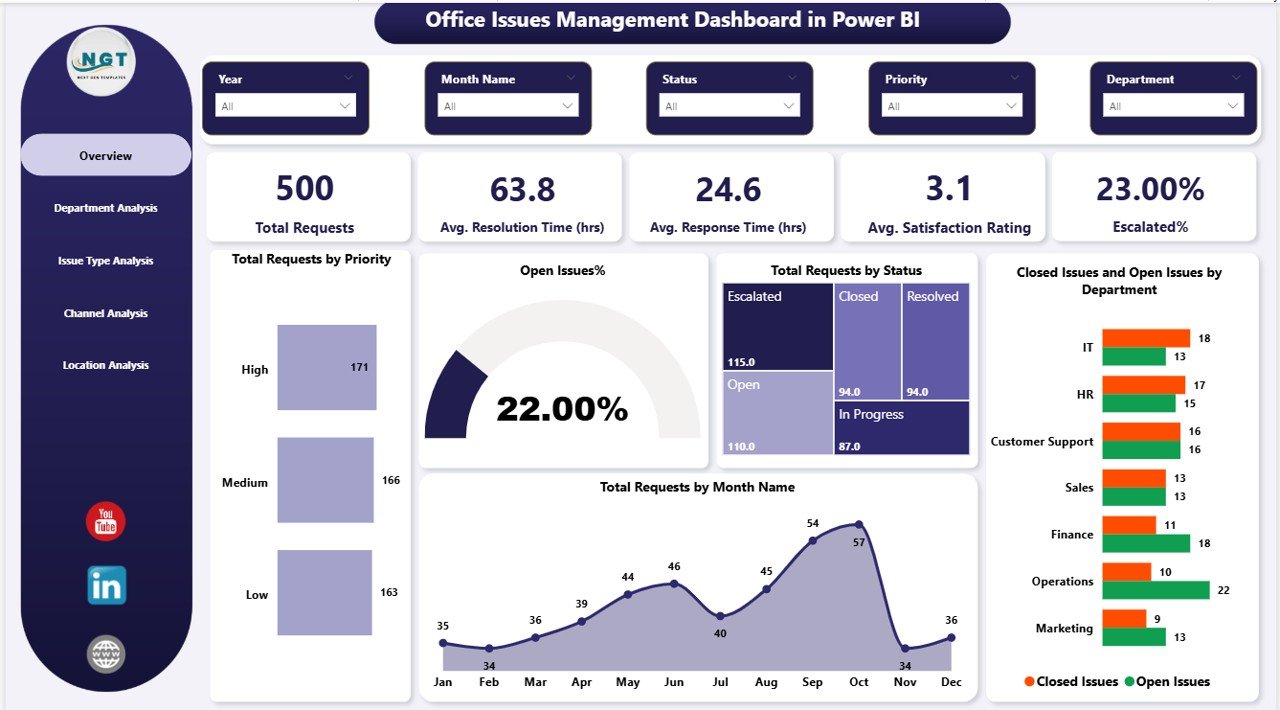
📌 Powerful KPI Cards – Track total requests, response time, resolution time, satisfaction rating, and escalation %
📈 Real-Time Monitoring – Stay updated with live data and performance trends
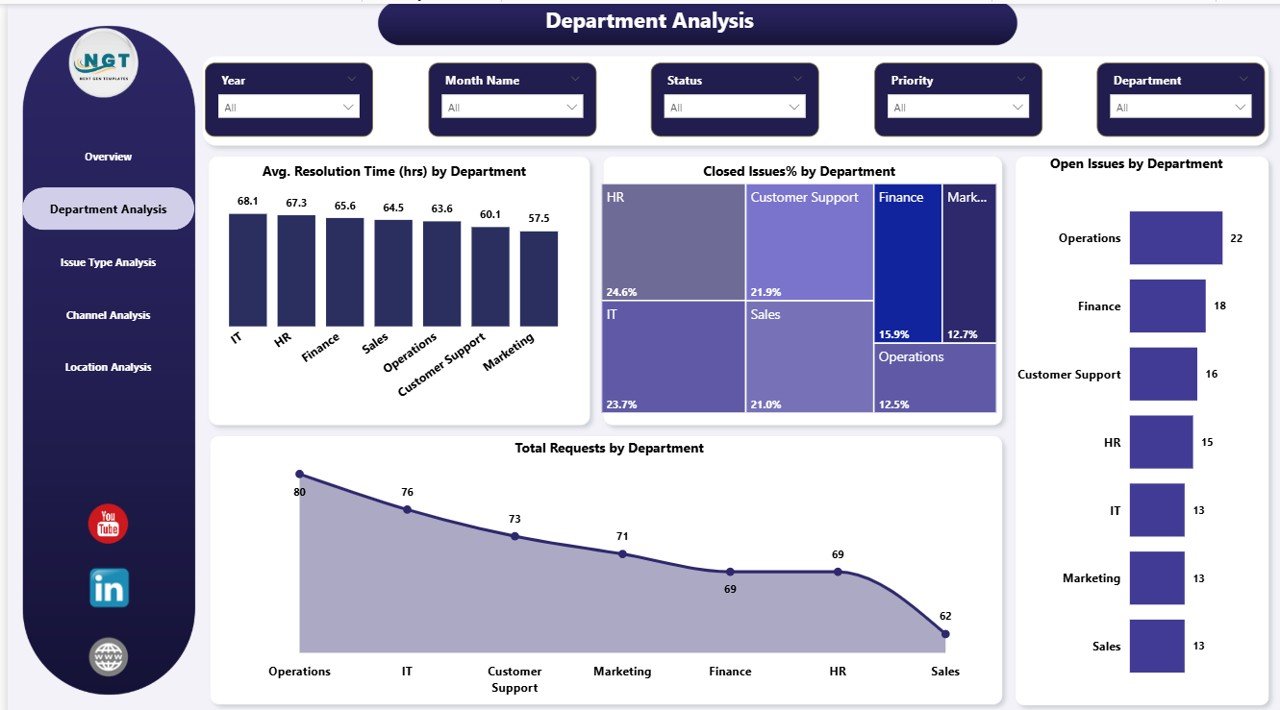
🏢 Department Analysis – Identify high-performing and underperforming departments
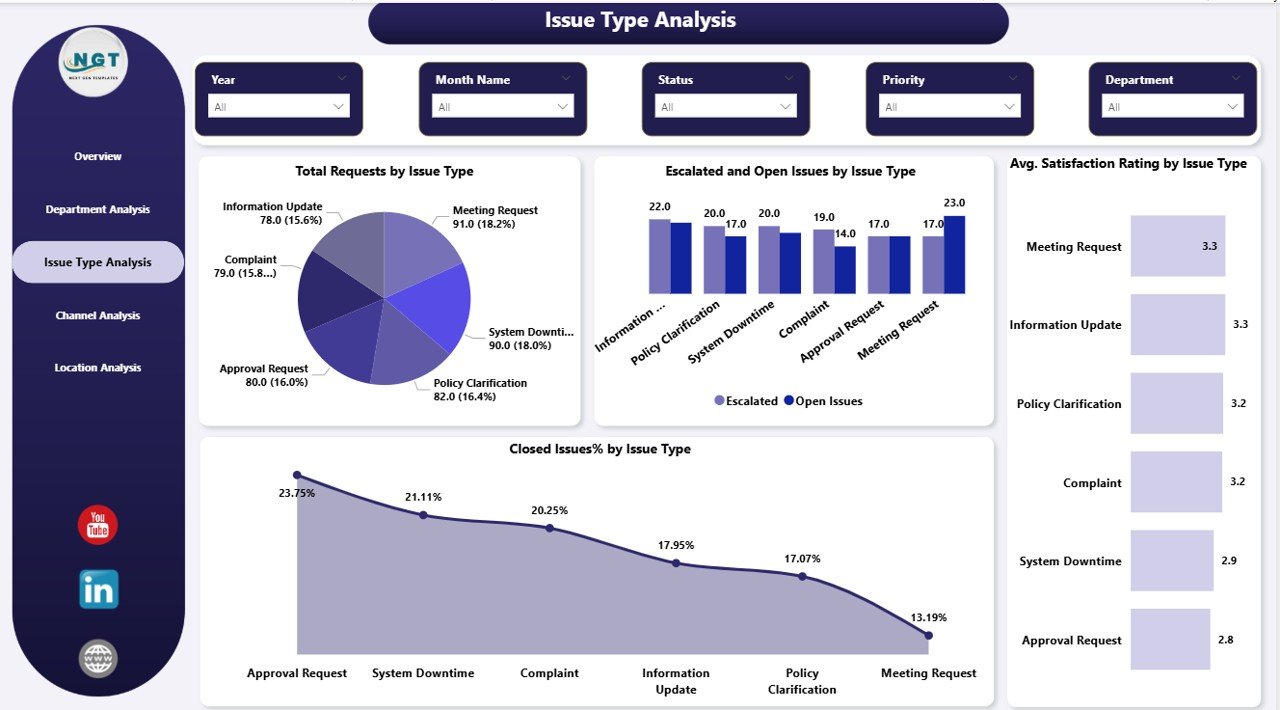
🧩 Issue Type Insights – Understand which issues cause the most delays or escalations
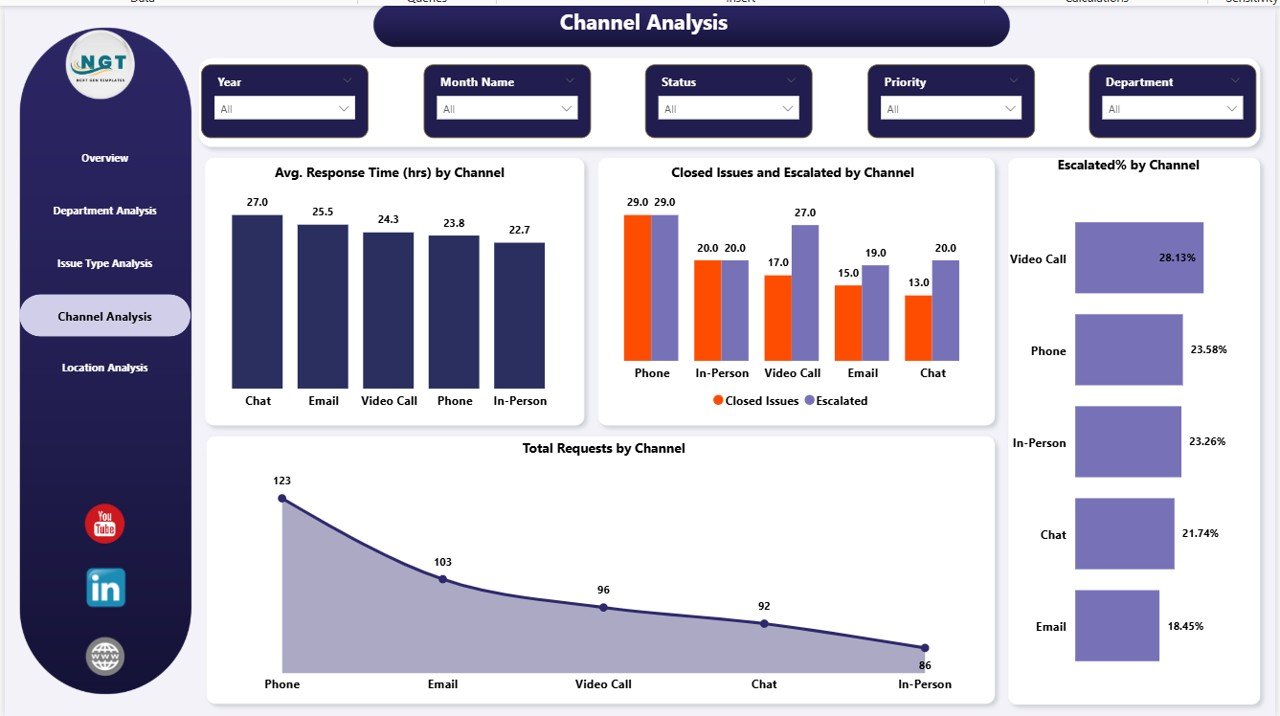
📞 Channel Performance Tracking – Evaluate email, phone, or ticket-based issue handling
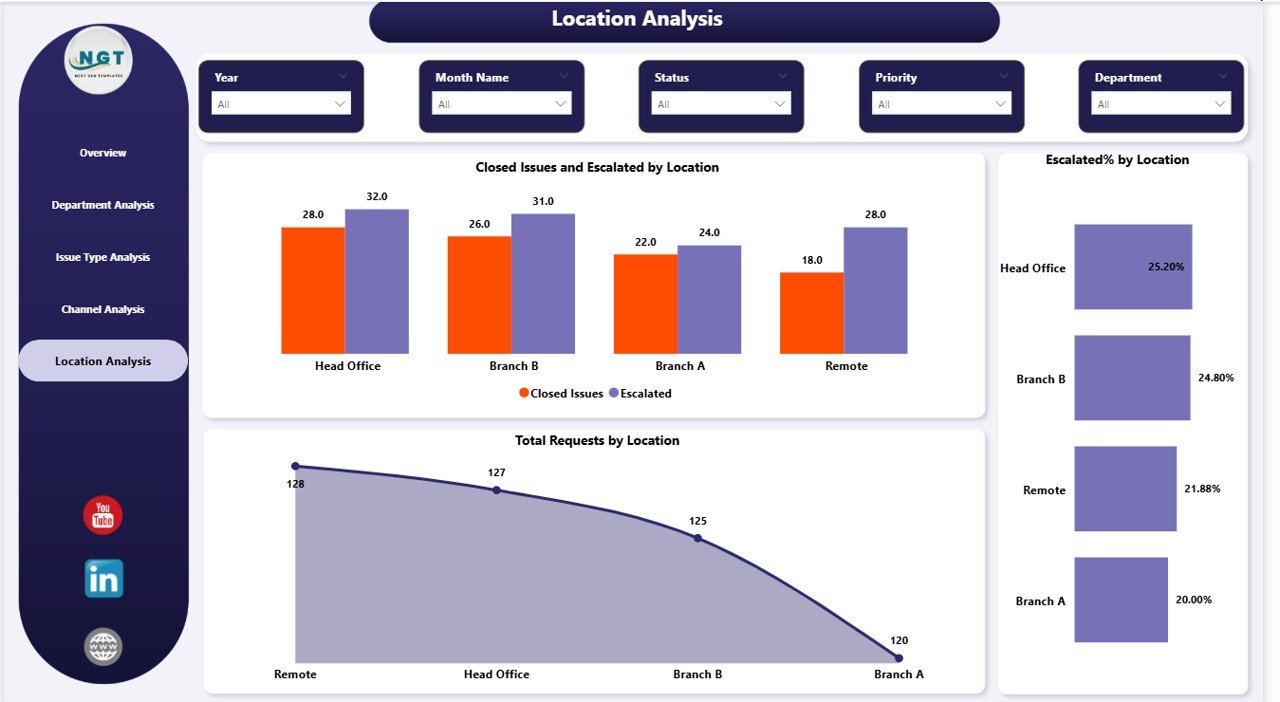
🌍 Location-Based Analysis – Monitor performance across multiple office locations
🎯 Advanced Filters & Slicers – Drill down into data for deeper insights
📦 What’s Inside the Office Issues Management Dashboard in Power BI
This ready-to-use dashboard includes 5 powerful pages designed for complete issue management:
📍 Overview Page
Get a quick snapshot with KPI cards and charts like total requests, open issues %, and monthly trends.
📍 Department Analysis Page
Analyze resolution time, issue volume, and performance by department.
📍 Issue Type Analysis Page
Understand trends by issue categories and identify critical problem areas.
📍 Channel Analysis Page
Evaluate which communication channels are most efficient.
📍 Location Analysis Page
Track issue handling performance across different locations.
Each page is designed to provide clear, actionable insights for smarter decision-making.
⚙️ How to Use the Office Issues Management Dashboard in Power BI
Using this dashboard is simple—even for beginners:
🔹 Import your issue dataset into Power BI
🔹 Connect and refresh your data
🔹 Use slicers to filter by department, location, or issue type
🔹 Monitor KPI cards and charts
🔹 Identify delays, bottlenecks, and escalation patterns
🔹 Take data-driven actions to improve performance
👉 Within minutes, you’ll gain complete control over your issue management process.
👥 Who Can Benefit from This Office Issues Management Dashboard?
This dashboard is perfect for:
👨💼 Office Administrators – Manage daily operations efficiently
👩💼 HR Managers – Track employee concerns and satisfaction
💻 IT Support Teams – Monitor technical issue resolution
🏭 Operations Managers – Improve workflow efficiency
🏢 Facility Management Teams – Handle maintenance and service issues
👉 Whether you’re a small business or a large organization, this dashboard helps you stay in control.
💡 Why This Dashboard is a Game-Changer
✔ Reduce issue resolution time
✔ Improve accountability across departments
✔ Minimize escalations and delays
✔ Centralize all issue data in one place
✔ Make faster, data-driven decisions
👉 Stop guessing. Start managing issues with clarity and confidence.
Click here to read the Detailed blog post
Watch the step-by-step video tutorial:
Visit our YouTube channel to learn step-by-step video tutorials
👉 https://youtube.com/@PKAnExcelExpert
Compatibility and Requirements
- Works in Power BI Desktop, which is free to download from Microsoft.
- You import your own issue dataset and refresh the data in Power BI. Microsoft explains the download and setup in Get Power BI Desktop.
Frequently Asked Questions
How many pages does the dashboard have?
Five pages: Overview, Department Analysis, Issue Type Analysis, Channel Analysis and Location Analysis.
Which KPIs does it show?
KPI cards cover total requests, response time, resolution time, satisfaction rating and escalation %. The Overview page also shows open issues % and monthly trends.
Can I filter the data?
Yes. Slicers let you filter by department, location or issue type.
Can I see which channel handles issues best?
Yes. The Channel Analysis page compares channels such as email, phone and tickets.
Is there an Excel version?
Yes. See the Office Issues Management Dashboard in Excel.
Related Office Dashboards
- Office Issues Management Dashboard in Excel: the same issue tracking in Excel
- Office Security Incident Dashboard in Power BI: another Power BI dashboard for office incidents
- Office Incident Report Dashboard in Excel: incident reporting in Excel
- Project Issue Tracker in Google Sheets: a simple issue log in Google Sheets
- Power BI Dashboard Mega Collection: 15 Power BI dashboard templates in one download
Browse all Power BI dashboards.