


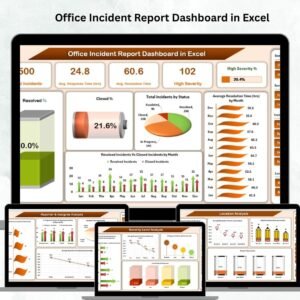
Managing workplace incidents effectively is no longer optional—it’s a necessity. Organizations today face increasing compliance demands, safety concerns, and operational risks. Without a structured system, incident reporting becomes chaotic and inefficient. The Office Incident Report Dashboard in Excel is your ready-to-use solution that transforms raw incident data into clear, actionable insights.
This interactive dashboard empowers HR teams, safety officers, and managers to track incidents, monitor response times, measure severity, and identify trends. With real-time insights, you can prioritize critical cases, improve team efficiency, and strengthen workplace safety.
✨ Key Features of the Office Incident Report Dashboard
📌 Centralized Tracking – Consolidates all incident data in one Excel file.
⚡ Real-Time Insights – Updates automatically as new incidents are logged.
🚨 Severity Monitoring – Tracks high-severity incidents and their resolution.
🌍 Location-Based Analysis – Compare performance across office branches.
📊 Trend Analysis – Monitor resolution and closure rates over time.
👥 Reporter Insights – Evaluate reporting efficiency by employee or department.
🎯 Customizable Filters – Drill down by type, location, severity, or reporter.
📂 What’s Inside the Office Incident Report Dashboard
This dashboard is organized into six easy-to-navigate sheets:
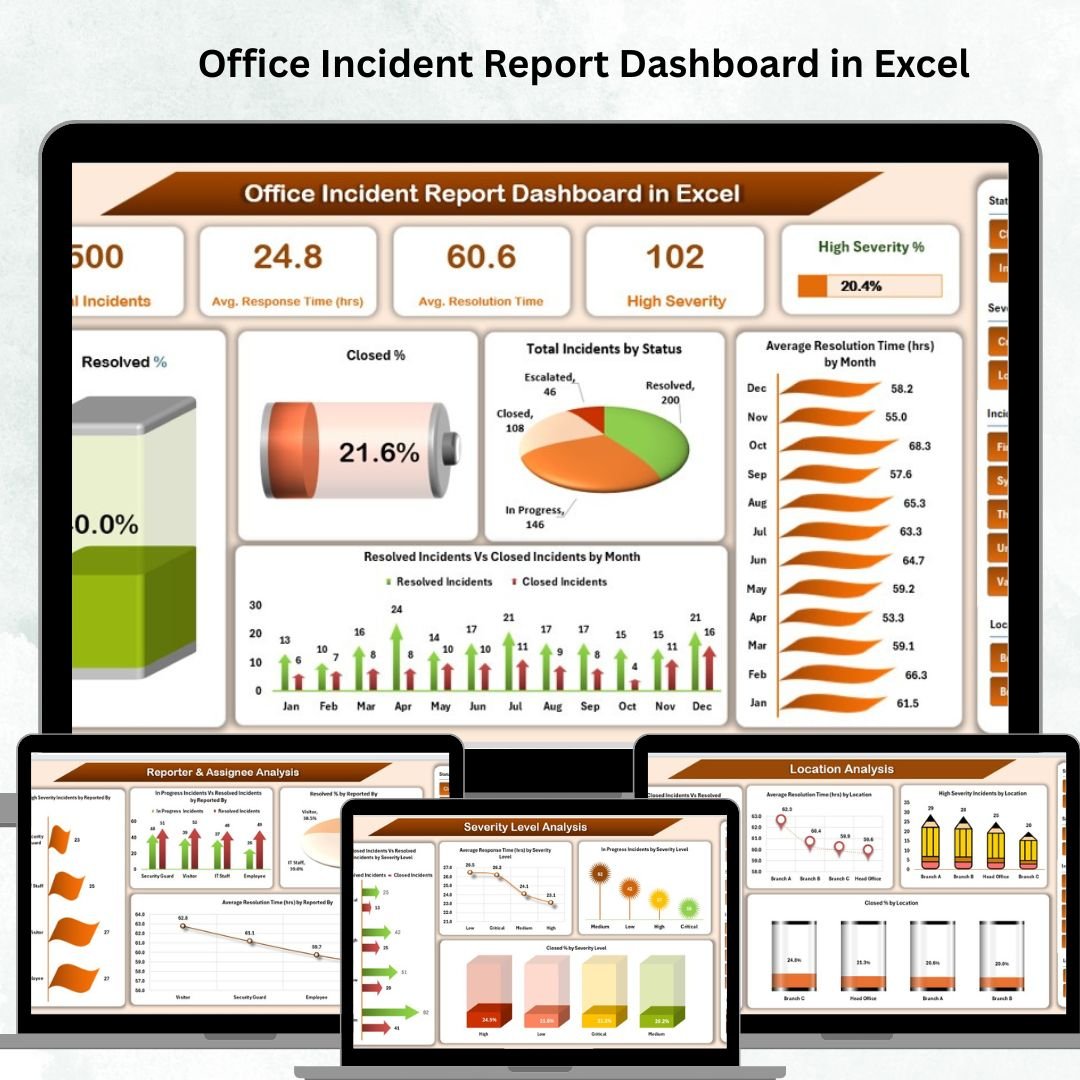
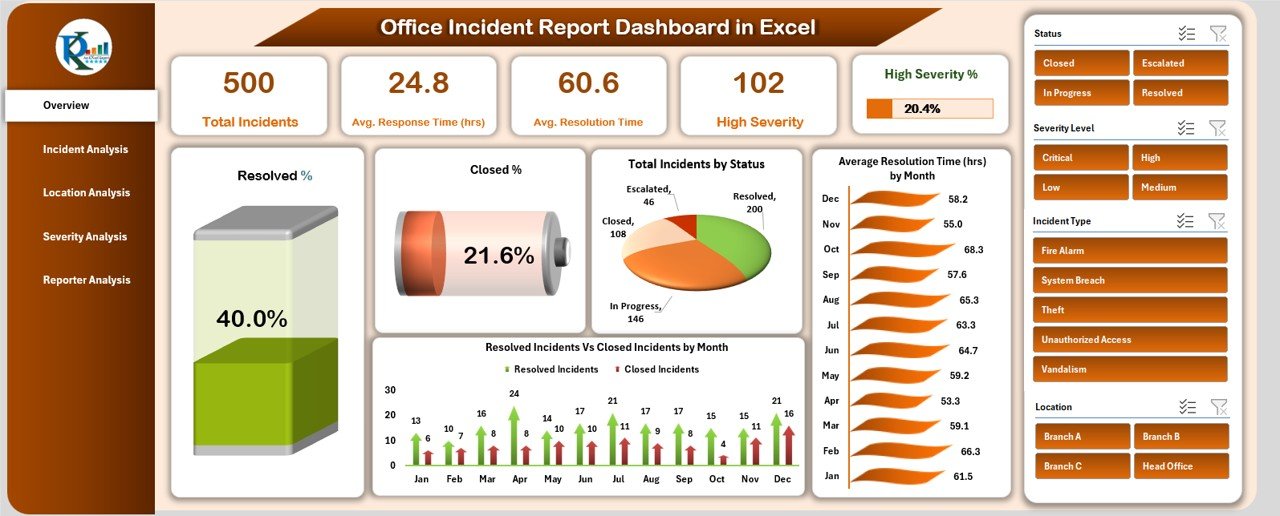
Overview Sheet – A high-level snapshot with cards for total incidents, average response time, resolution time, high severity %, and charts for trends.
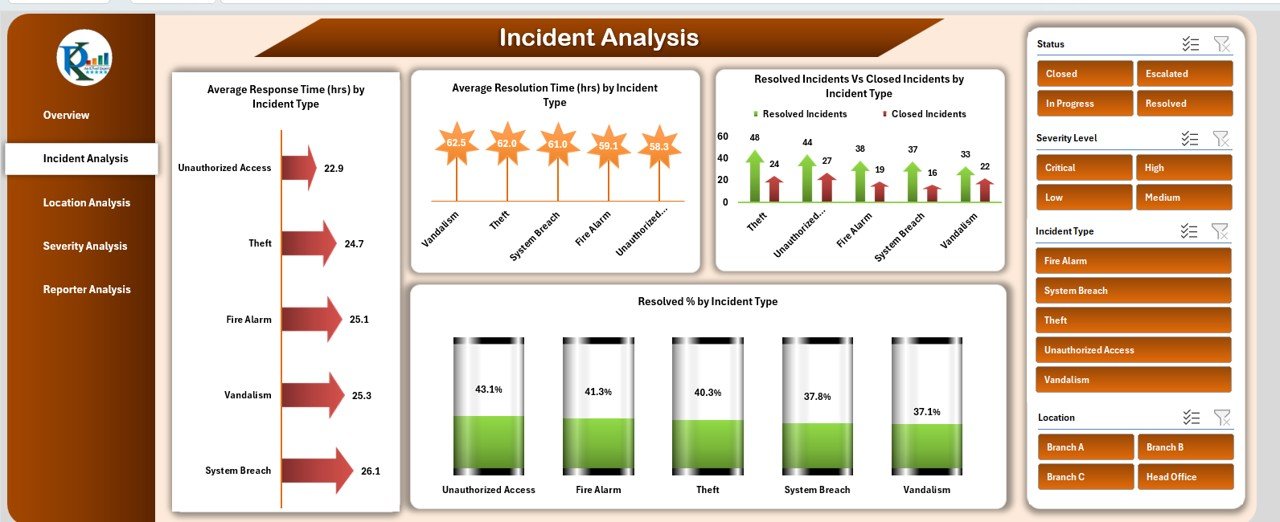
Incident Analysis Sheet – Breakdown of incidents by type with resolution and response insights.
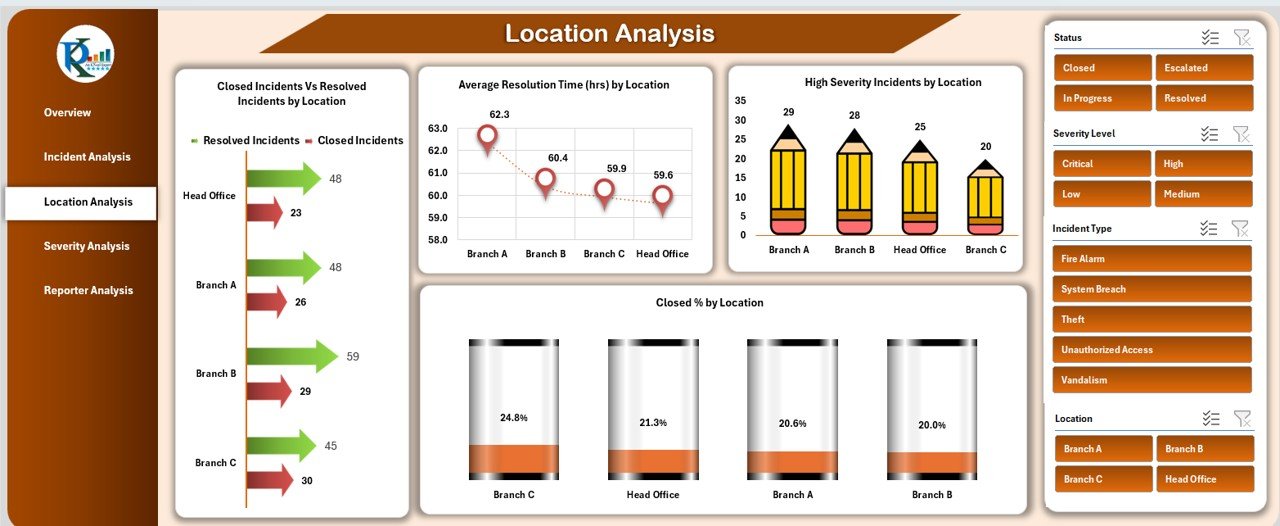
Location Analysis Sheet – Compare incidents and performance across multiple office locations.
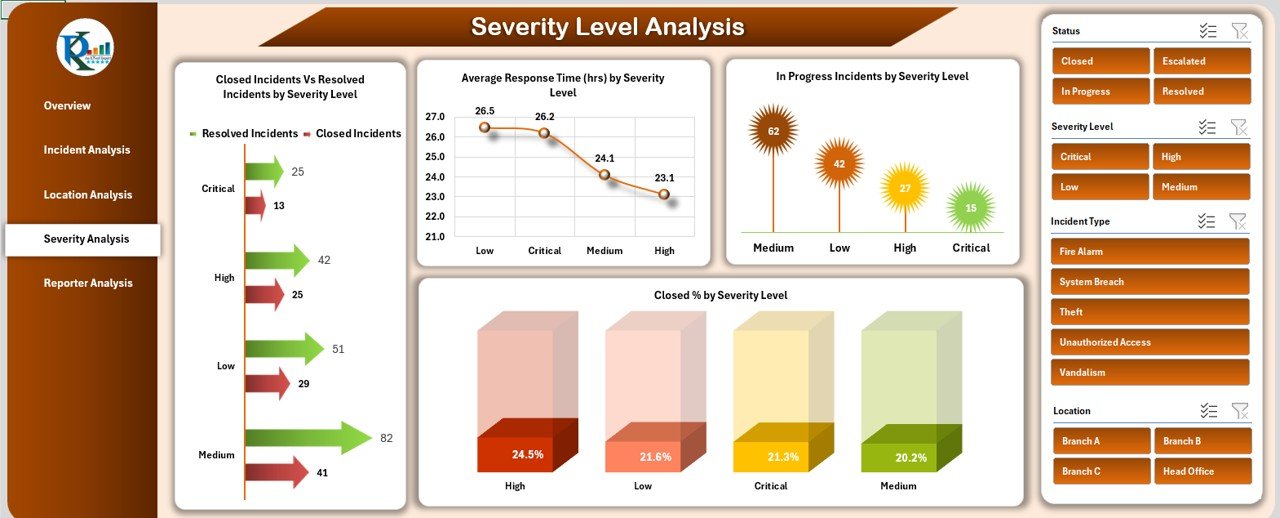
Severity Analysis Sheet – Track high-severity cases with closure and response metrics.
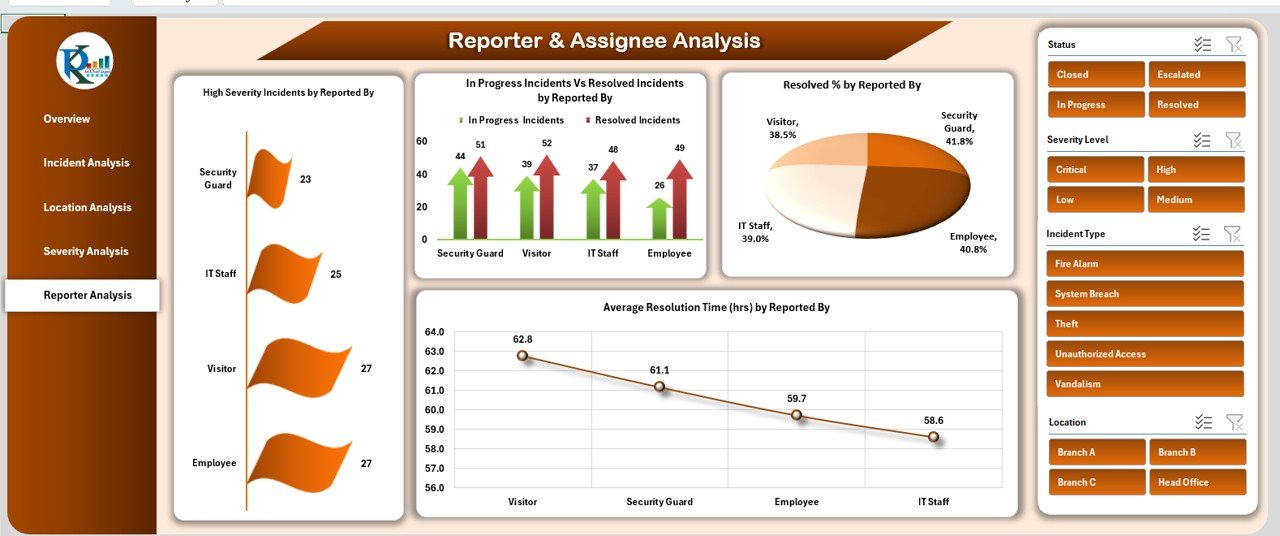
Reporter Analysis Sheet – Evaluate incident reporting trends by employees or departments.
Data Sheet – Input all incident details; updates flow into all dashboard visuals automatically.
🛠 How to Use the Office Incident Report Dashboard
Input Data: Log each incident in the Data Sheet with fields like type, location, severity, reporter, and resolution details.
Refresh Reports: Excel automatically updates cards, charts, and metrics.
Analyze Trends: Use monthly and yearly views to track patterns.
Prioritize Actions: Focus on high-severity and overdue incidents.
Share Insights: Export visuals for management or compliance reporting.
👥 Who Can Benefit from This Dashboard?
HR Teams 👩💼 – Monitor employee-related incidents and workplace issues.
Facility & Safety Managers 🏢 – Ensure safety compliance and reduce risks.
Executives 👔 – Get a high-level view of incident performance across branches.
Operations Teams ⚙️ – Improve efficiency by tracking resolution times.
Compliance Officers 📑 – Maintain accurate records for audits and reporting.
🚀 Advantages of Using This Dashboard
Boost Workplace Safety – Track incidents and reduce recurrence.
Improve Efficiency – Monitor response and resolution times in real-time.
Enhance Accountability – Identify bottlenecks by department or reporter.
Data-Driven Decisions – Allocate resources where they’re most needed.
Stay Compliant – Maintain records that meet regulatory requirements.
✅ Best Practices for Maximum Impact
Update incident data daily or weekly for accuracy.
Focus on high-severity incidents for quicker action.
Use filters to analyze by location, department, or severity.
Monitor monthly/quarterly trends to plan preventive actions.
Document actions taken for each incident in the Data Sheet.
📌 Click here to read the Detailed Blog Post
Watch the step-by-step video Demo:
📺 Visit our YouTube channel to learn step-by-step video tutorials → PKAnExcelExpert
Compatibility and Requirements
- Works in Microsoft Excel desktop (Excel 2016 or later, or Microsoft 365).
- Microsoft’s guide Create a chart from start to finish explains the Excel feature this file is built on.
Frequently Asked Questions
How many sheets does the Office Incident Report Dashboard have?
Six: Overview, Incident Analysis, Location Analysis, Severity Analysis, Reporter Analysis and the Data sheet.
What do the Overview cards show?
Total incidents, average response time, average resolution time and the share of high severity incidents, with trend charts below.
What do I enter for each incident?
Log each incident in the Data sheet with its type, location, severity, reporter and resolution details. The cards and charts update from there.
Can I compare office locations?
Yes. The Location Analysis sheet compares incident counts and performance across office branches.
Can I filter the reports?
Yes. You can drill down by incident type, location, severity or reporter, and use the monthly and yearly views to spot patterns.
Related Incident and Safety Templates
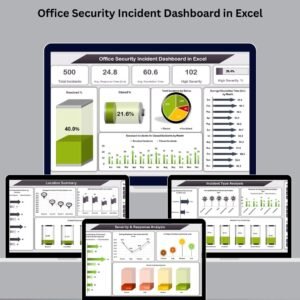
- Office Security Incident Dashboard in Excel: focused on security incidents
- Employee Health and Safety Dashboard in Excel: track workplace health and safety
- Incident Report Tracker in Excel: a simple incident log
- Workplace Safety & Incident Management Dashboard in Google Sheets: a browser-based version
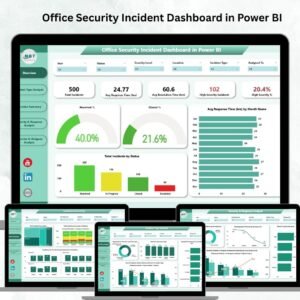
- Office Security Incident Dashboard in Power BI: an interactive Power BI option
Browse all Excel dashboards or the Excel health and safety templates.






























Reviews
There are no reviews yet.