Biotechnology organizations operate in one of the most data-intensive industries in the world. Research investments, clinical trials, regulatory approvals, and operational expenses must be monitored continuously to ensure projects remain efficient and financially viable. However, many biotech companies still rely on static spreadsheets and manual reporting processes, making performance tracking slow and difficult.
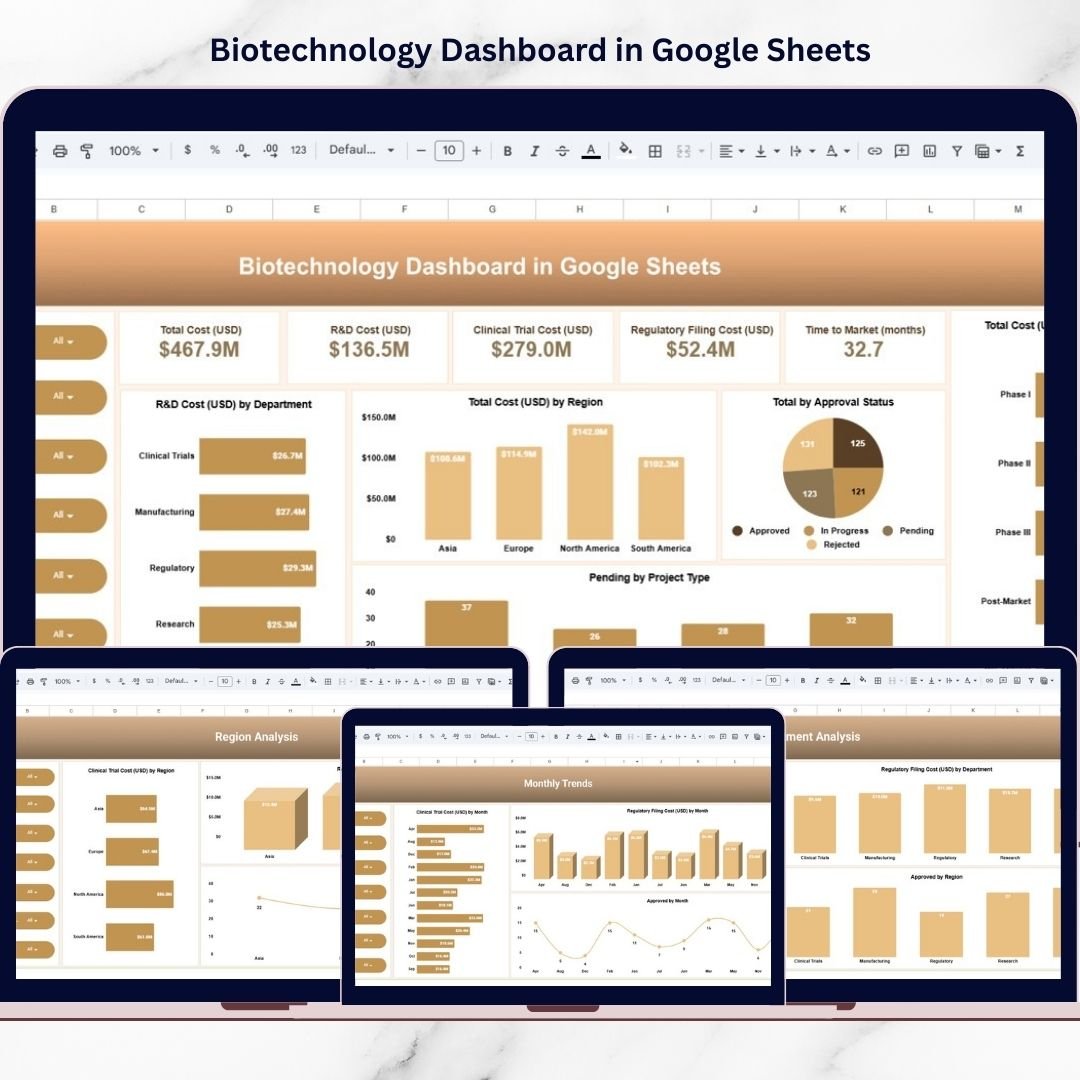
The Biotechnology Dashboard in Google Sheets provides a smarter and more structured way to analyze biotechnology operations. This ready-to-use dashboard transforms complex research and financial data into clear visual insights, allowing decision-makers to evaluate performance instantly.
Instead of reviewing multiple reports across departments and regions, leaders can monitor all critical biotechnology KPIs in one centralized dashboard. Built using Google Sheets, the solution enables real-time collaboration, automated calculations, and dynamic analytics — helping organizations improve decision-making while reducing reporting effort.
Whether managing research investments, tracking clinical trial costs, or analyzing approval performance, this dashboard delivers actionable insights that support innovation and strategic growth.
🧬 Key Feature of Biotechnology Dashboard in Google Sheets
📊 Comprehensive KPI Monitoring
Track R&D costs, clinical trial expenses, regulatory filings, and project approvals in one dashboard.
🌍 Multi-Dimensional Analysis
Evaluate performance by department, region, project type, and development phase.
📅 Monthly Trend Tracking
Monitor operational and financial trends over time for better forecasting.
⚡ Interactive Visual Analytics
Dynamic charts simplify complex biotechnology data into easy insights.
☁️ Cloud-Based Collaboration
Multiple users can update and analyze data simultaneously in Google Sheets.
📈 Investment Visibility
Understand where research budgets are allocated and how efficiently they perform.
🔍 Project Performance Monitoring
Track approval status and pending projects to improve development planning.
📦 What’s Inside the Biotechnology Dashboard in Google Sheets
This professional template includes five analytical dashboard pages, each answering a critical business question:
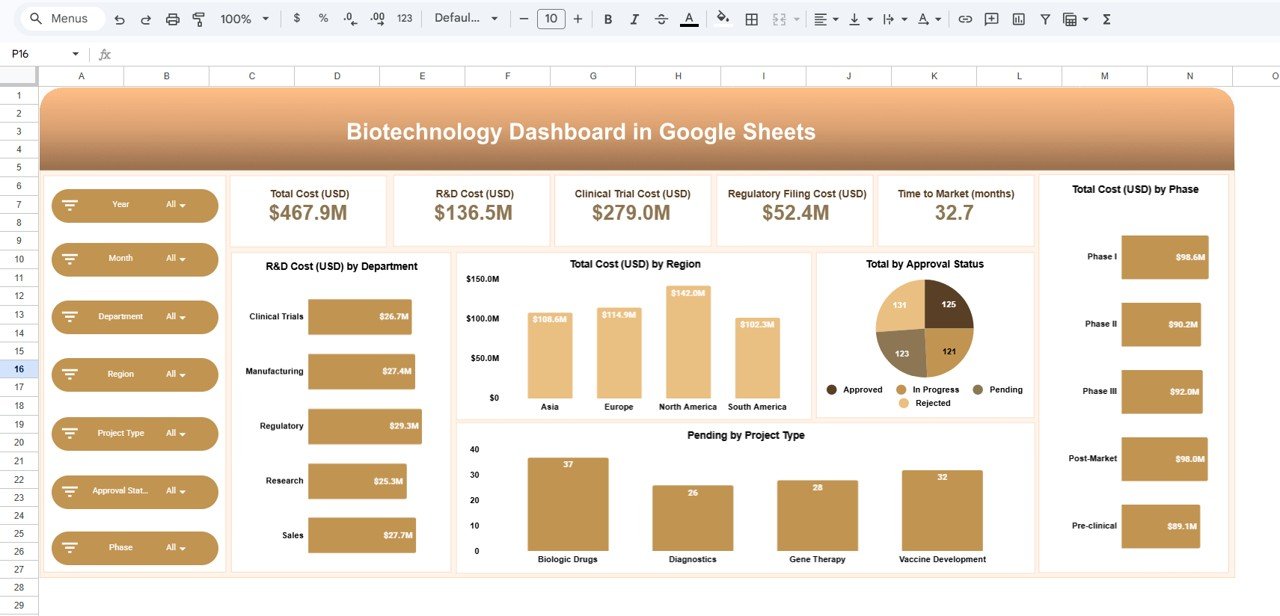
✅ Overview Dashboard – Displays total cost, R&D investment, clinical trial expenses, regulatory costs, and time-to-market KPIs with visual summaries.
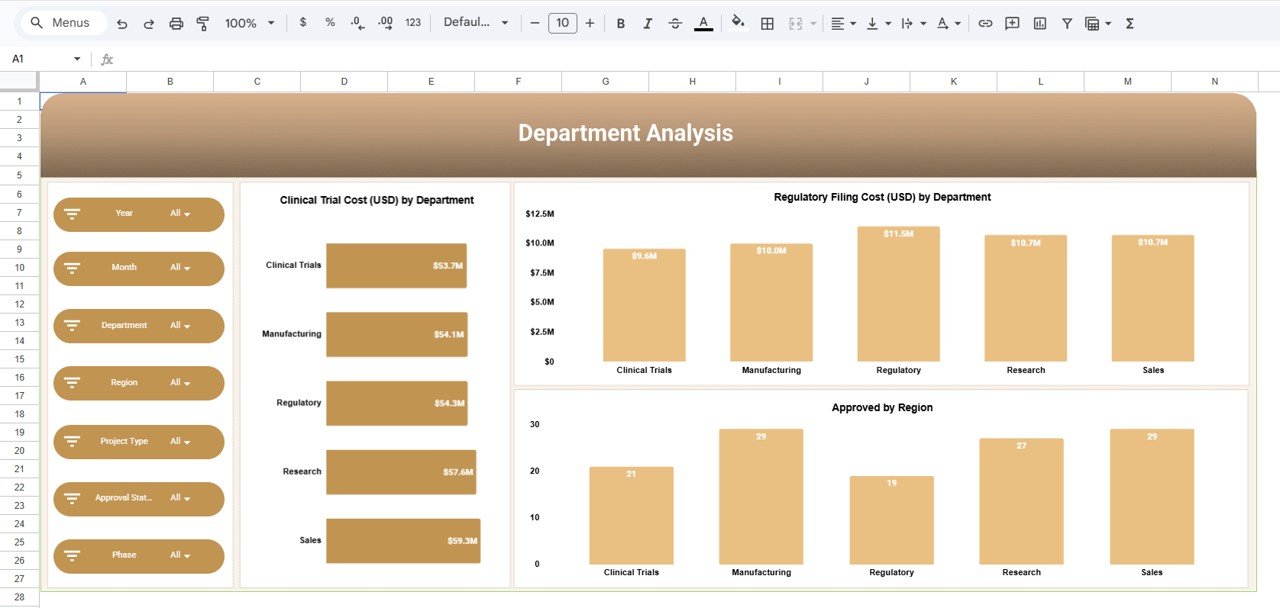
✅ Department Analysis – Compare costs and approved projects across organizational departments.
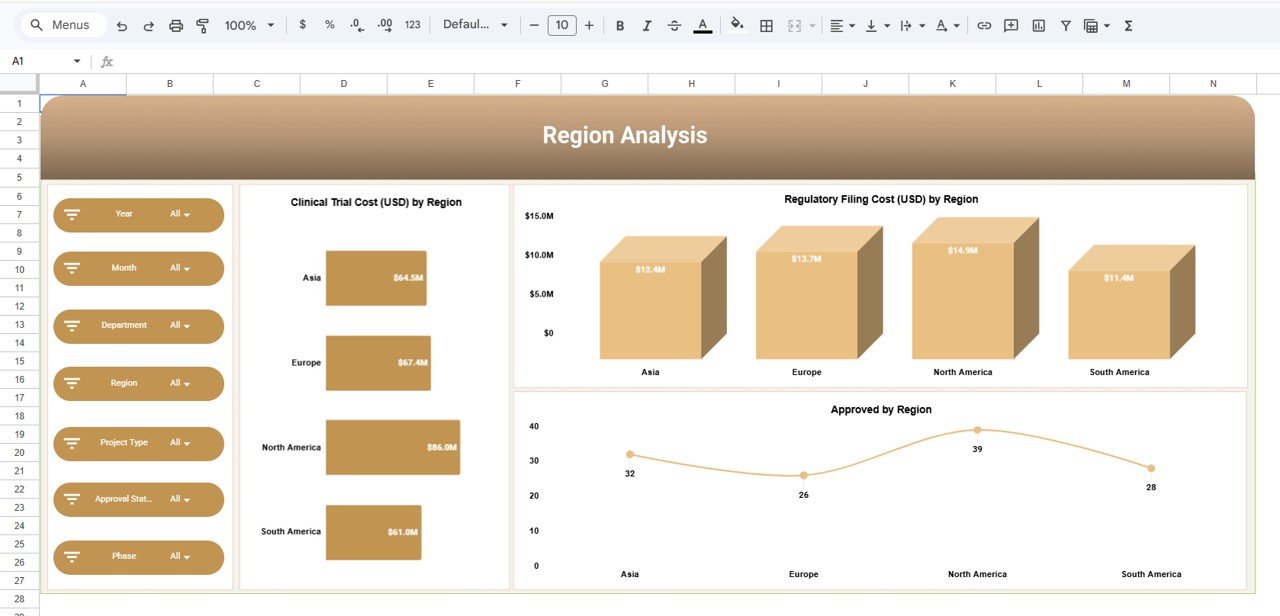
✅ Region Analysis – Analyze global investment distribution and regional performance trends.
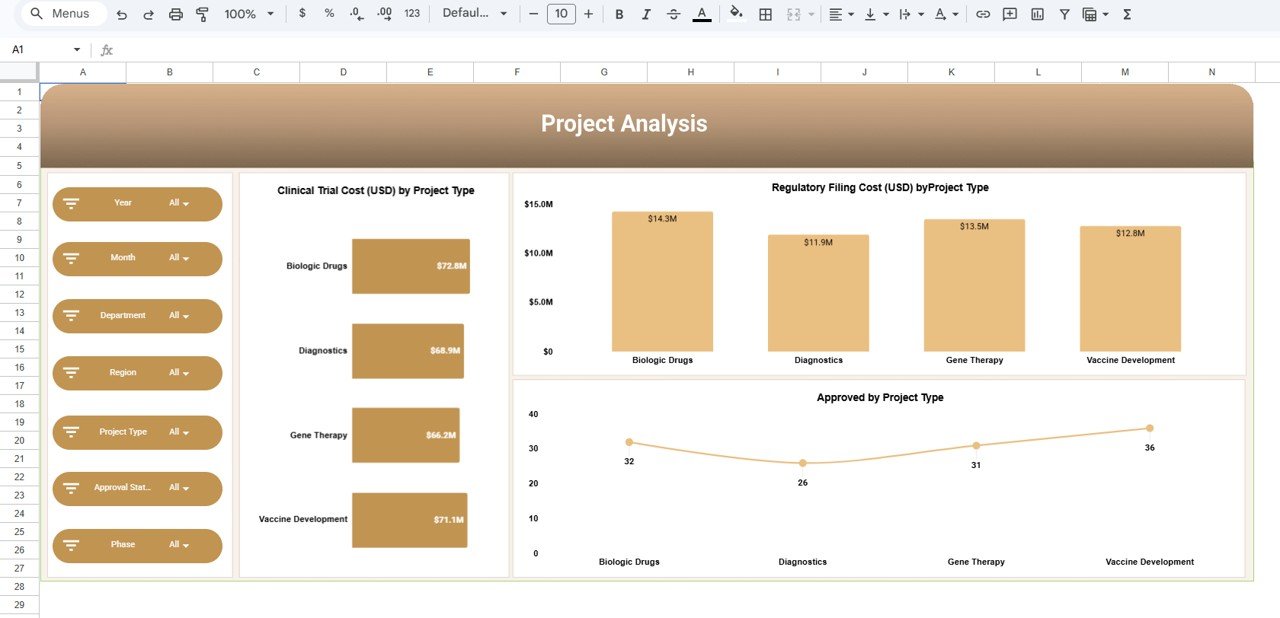
✅ Project Analysis – Evaluate performance across different biotechnology project types.
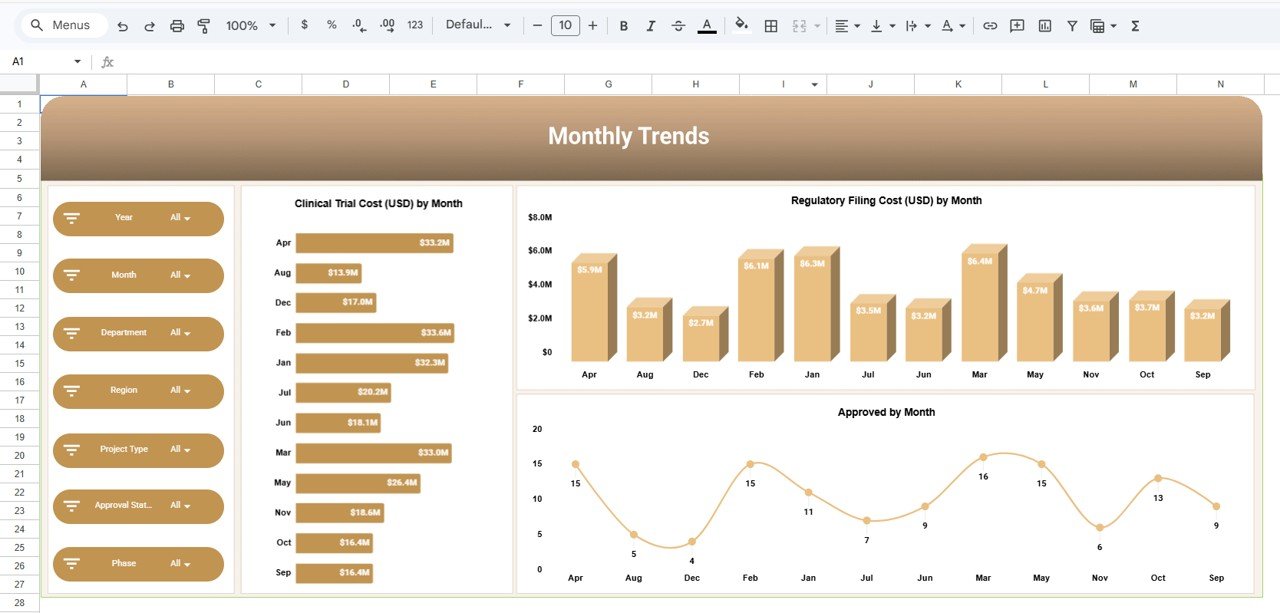
✅ Monthly Trends Page – Monitor performance changes and forecast future investment patterns.
All pages are interconnected, ensuring automatic updates whenever data is modified.
🛠️ How to Use the Biotechnology Dashboard in Google Sheets
Using the dashboard is simple and requires minimal technical knowledge:
1️⃣ Enter biotechnology operational and financial data.
2️⃣ Update departments, regions, and project categories as needed.
3️⃣ Refresh charts automatically through built-in formulas.
4️⃣ Analyze KPIs using interactive visualizations.
5️⃣ Share insights instantly with stakeholders via cloud access.
Because calculations and layouts are prebuilt, users focus only on analysis instead of report creation.
🎯 Who Can Benefit from This Biotechnology Dashboard in Google Sheets
🧪 Biotechnology Companies – Monitor research investments and project efficiency.
👨🔬 R&D Managers – Track development costs and project progress.
📊 Financial Analysts – Analyze operational spending and investment performance.
🌍 Executive Leadership – Gain high-level visibility into organizational performance.
📈 Strategy Teams – Support long-term planning with data-driven insights.
🚀 Healthcare & Life Sciences Organizations – Improve innovation monitoring and reporting.
This dashboard empowers organizations to move from reactive reporting to proactive strategic management.
Modern biotechnology success depends on data clarity and fast decision-making. By combining structured analytics with interactive visualization, this dashboard enables organizations to control costs, optimize research investments, and accelerate innovation outcomes.
Stop managing biotech performance through scattered spreadsheets — start using a centralized analytics solution built for smarter decisions and measurable growth.
### Click here to read the Detailed blog post
Watch the step-by-step video tutorial: