Renewable Infrastructure Projects Dashboard is expanding faster than ever. Governments are investing billions. Private investors are funding large solar parks and wind farms. Project managers are handling multiple contracts across regions and energy sources.
But here’s the problem…
When performance data sits inside scattered Excel sheets, visibility disappears. ROI tracking becomes slow. Cost overruns go unnoticed. Strategic decisions get delayed.
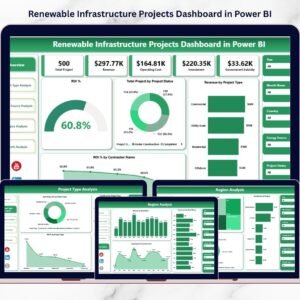
That is exactly why we created the Renewable Infrastructure Projects Dashboard in Power BI — a powerful, interactive performance management solution designed specifically for renewable infrastructure portfolios.
This ready-to-use Power BI dashboard transforms raw financial and operational data into clear, actionable insights. Instead of preparing static reports, you monitor ROI %, investment flow, operating costs, subsidies, and regional performance instantly.
If you want smarter capital allocation and stronger financial control, this dashboard delivers.
🚀 Key Feature of Renewable Infrastructure Projects Dashboard in Power BI
This dashboard includes 5 fully structured analytical pages, designed to provide 360-degree visibility.
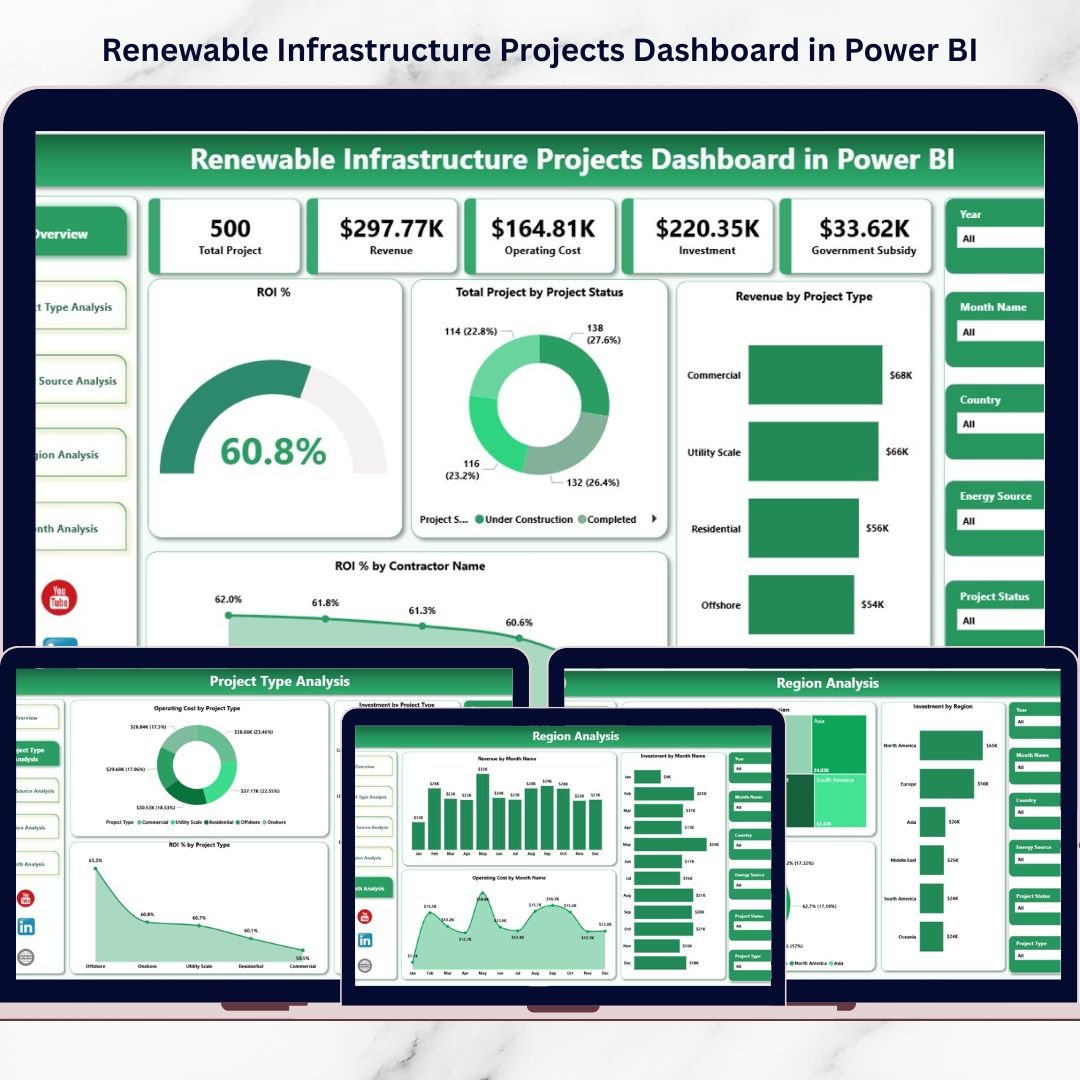
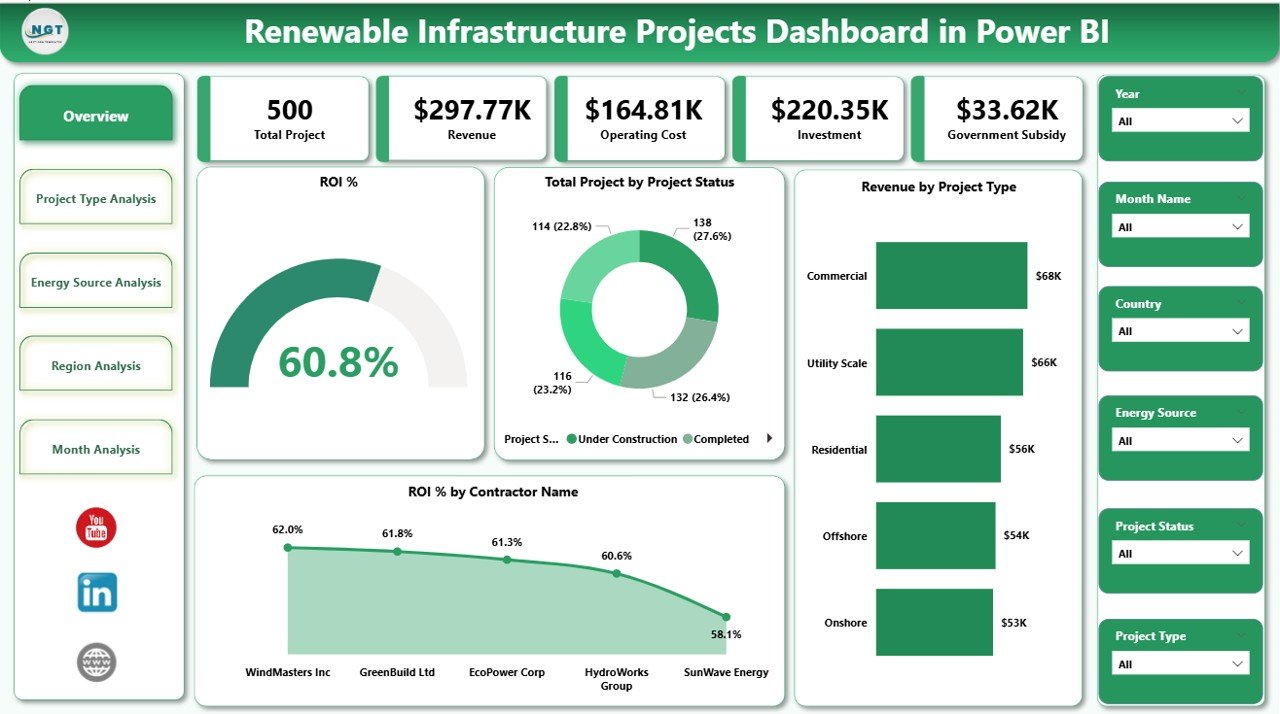
📊 Overview Page – Executive-level snapshot with ROI %, Total Investment, Project Status, and Revenue insights.
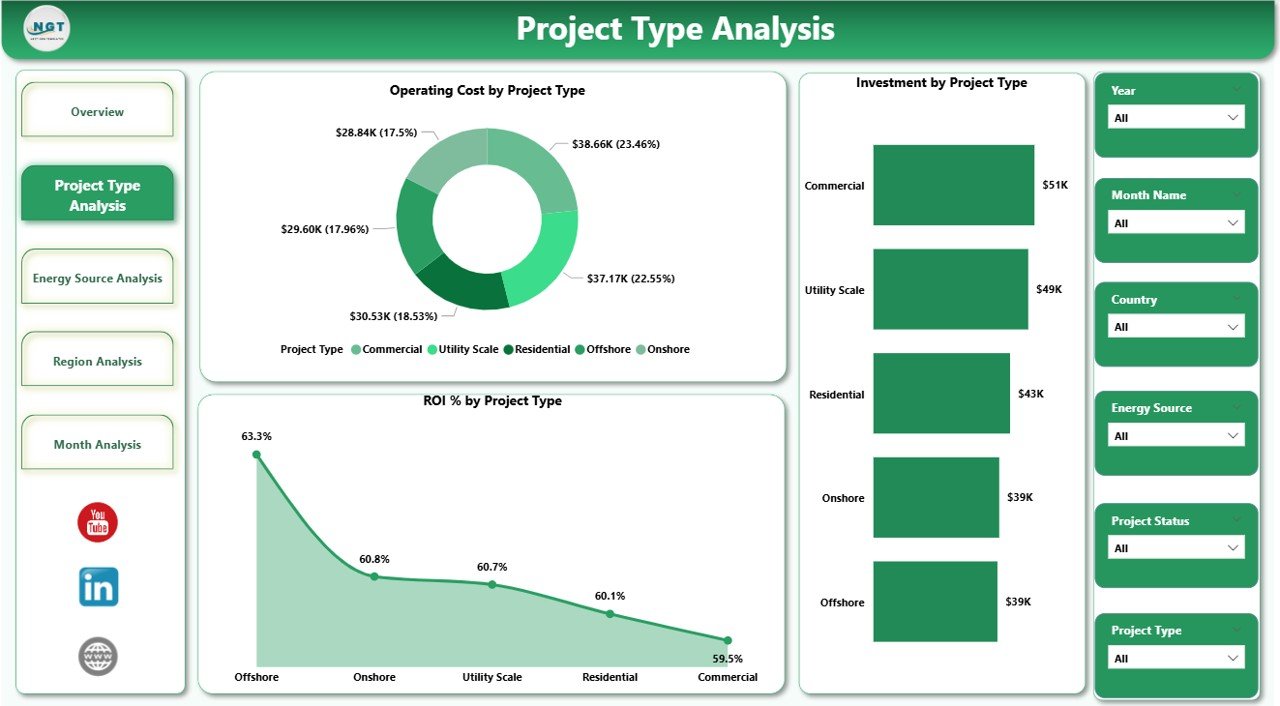
🏗 Project Type Analysis – Compare Solar, Wind, Hydro, Biomass, and Geothermal projects.
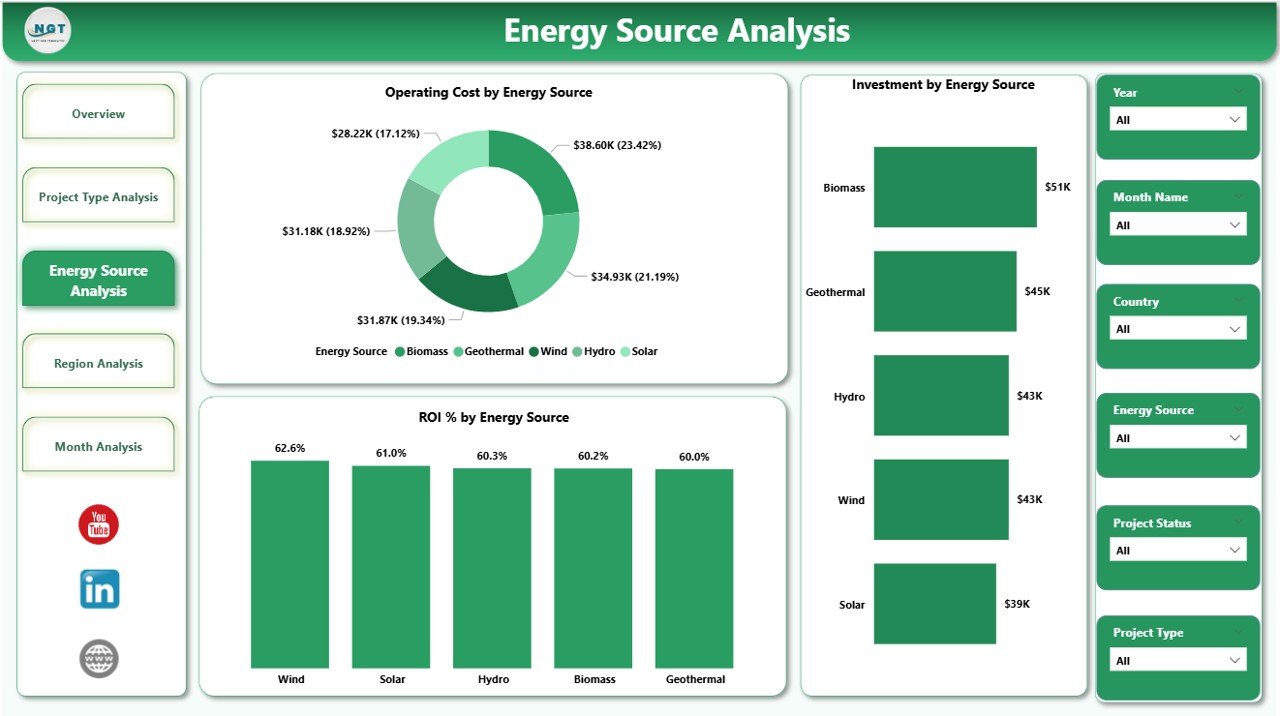
⚡ Energy Source Analysis – Analyze ROI, investment, and operating cost by energy source.
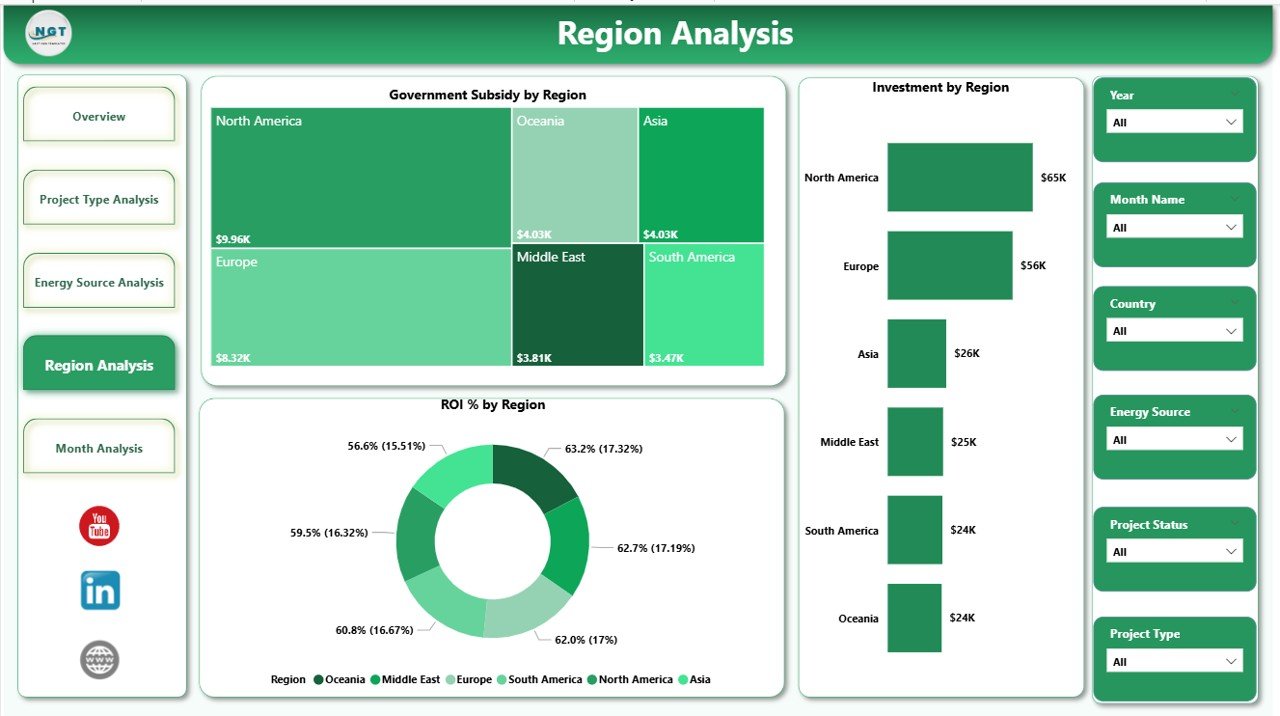
🌍 Region Analysis – Evaluate subsidies, investment distribution, and ROI by region.
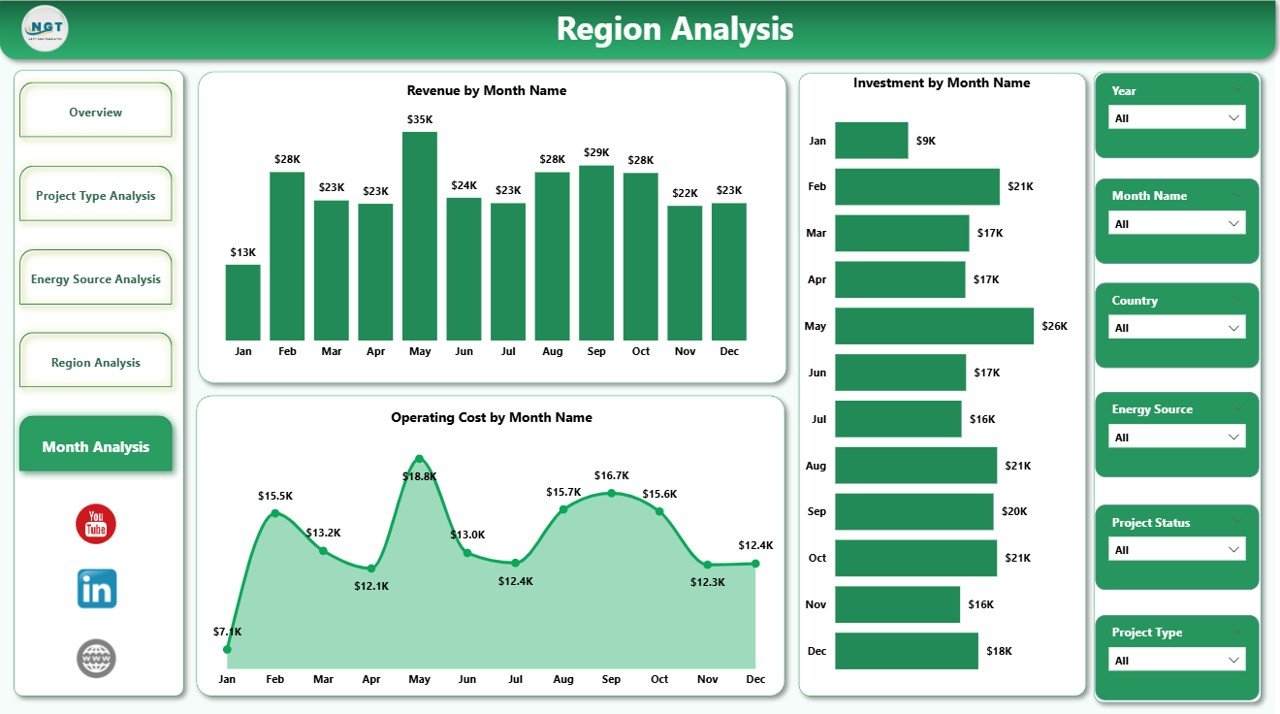
📅 Month Analysis – Track monthly trends for revenue, cost, and ROI performance.
✨ Advanced Power BI capabilities:
-
Interactive slicers (Year, Region, Energy Source, Contract Name)
-
Drill-down and drill-through functionality
-
Dynamic filtering
-
Real-time data refresh
-
Clean KPI cards for executive reporting
Because everything updates dynamically, leadership gains instant clarity.
📦 What’s Inside the Renewable Infrastructure Projects Dashboard in Power BI
This ready-to-use Power BI file provides:
✔ ROI % tracking across contracts
✔ Total Investment monitoring
✔ Revenue by Project Type visualization
✔ Operating Cost analysis
✔ Government Subsidy by Region breakdown
✔ Contract-level ROI comparison
✔ Energy source performance insights
✔ Monthly trend tracking
✔ Interactive filters for deep analysis
You connect your Excel, ERP, or financial data source — and Power BI handles the analytics.
🛠 How to Use the Renewable Infrastructure Projects Dashboard in Power BI
Using this dashboard is simple:
1️⃣ Connect your project data (Excel, ERP, or database).
2️⃣ Refresh the Power BI model.
3️⃣ Use slicers to filter by region, project type, energy source, or contract.
4️⃣ Analyze ROI, cost, and subsidy distribution instantly.
5️⃣ Monitor monthly trends for forecasting.
For example:
If solar projects deliver 18% ROI while wind projects deliver 10%, you can reallocate capital.
If one region shows strong subsidies and high returns, you can expand investment.
If operating costs rise month-over-month, you can investigate immediately.
Because insights are visual and interactive, decision-making becomes faster and more strategic.
👥 Who Can Benefit from This Renewable Infrastructure Projects Dashboard in Power BI
This dashboard is ideal for:
🌱 Renewable Energy Companies
💼 Infrastructure Investors
🏛 Government Energy Departments
📊 Financial Analysts
🏗 Project Management Teams
🌍 Sustainability Consultants
Whether you manage a diversified renewable portfolio or evaluate individual contracts, this dashboard improves:
✔ ROI monitoring
✔ Capital allocation
✔ Risk management
✔ Subsidy tracking
✔ Regional expansion planning
When performance becomes measurable, growth becomes controlled.
💰 How This Dashboard Strengthens Investment Strategy
Renewable growth requires disciplined financial monitoring.
This dashboard helps you:
-
Identify high-performing contracts
-
Compare ROI across energy sources
-
Reduce exposure to low-return projects
-
Track subsidy impact clearly
-
Monitor investment trends monthly
Instead of guessing where to invest next, you invest based on real data.
And that drives long-term profitability.
Click hare to read the Detailed blog post
Visit our YouTube channel to learn step-by-step video tutorials