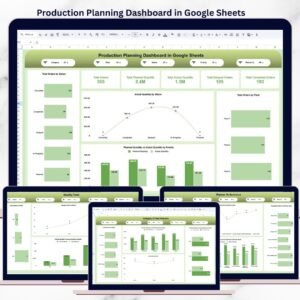
Production planning sits at the core of manufacturing success. Yet many teams still rely on scattered spreadsheets, manual follow-ups, and delayed updates, leading to production delays, missed targets, and poor coordination between planners and plants.
The Production Planning Dashboard in Google Sheets is a ready-to-use, interactive solution designed to bring orders, quantities, delays, priorities, plants, and planner performance into one centralized, real-time view.
Built entirely in Google Sheets, this dashboard enables teams to collaborate live, track planned vs actual output, identify bottlenecks early, and make faster, data-driven decisions—without expensive BI tools or complex setups.
🚀 Key Features of Production Planning Dashboard in Google Sheets
📊 Centralized Production Visibility
Track all production orders, quantities, and statuses in one dashboard.
⏱️ Planned vs Actual Quantity Tracking
Instantly compare planned output with actual production results.
⚠️ Delay Identification & Monitoring
Spot delayed orders early and take corrective action.
🏭 Plant & Production Line Analysis
Analyze performance across plants and production lines.
👥 Planner Performance Tracking
Measure workload, efficiency, and delivery performance by planner.
📈 Monthly Trend & Performance Analysis
Understand production trends, seasonality, and recurring issues.
🔍 Interactive Filters (Slicers)
Filter by category, plant, status, priority, and planner name instantly.
☁️ Real-Time Google Sheets Collaboration
Multiple users can update and view data simultaneously.
📦 What’s Inside the Production Planning Dashboard
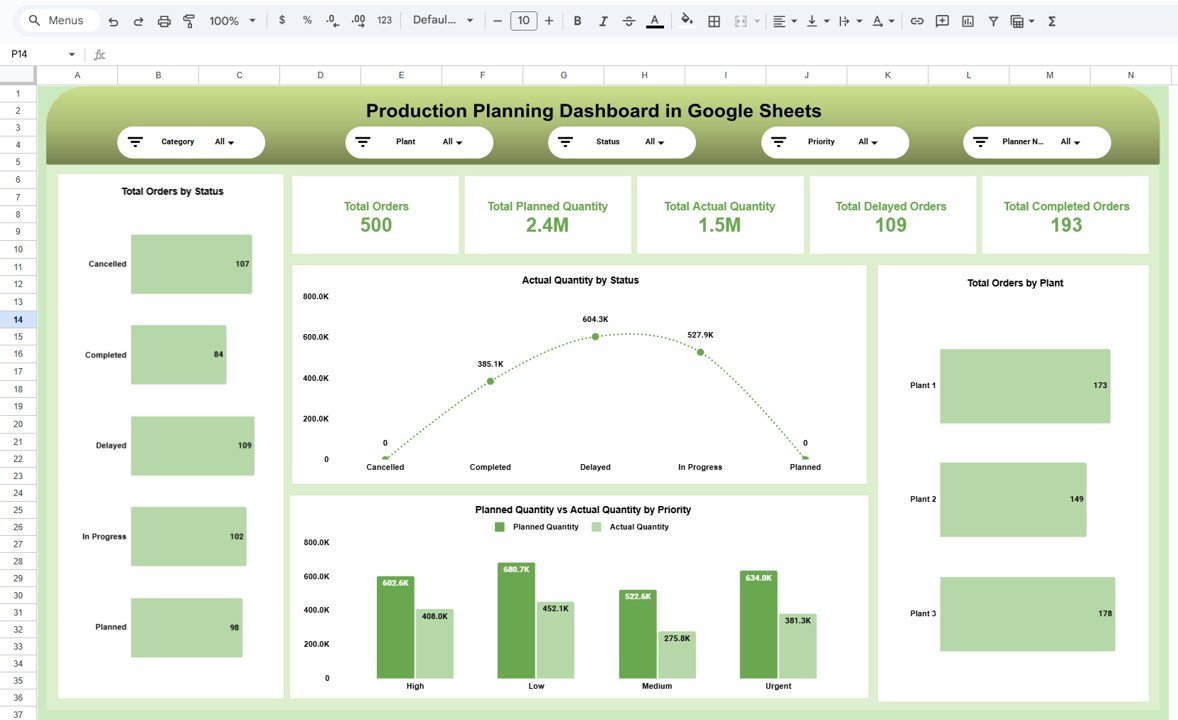
📁 Overview Page
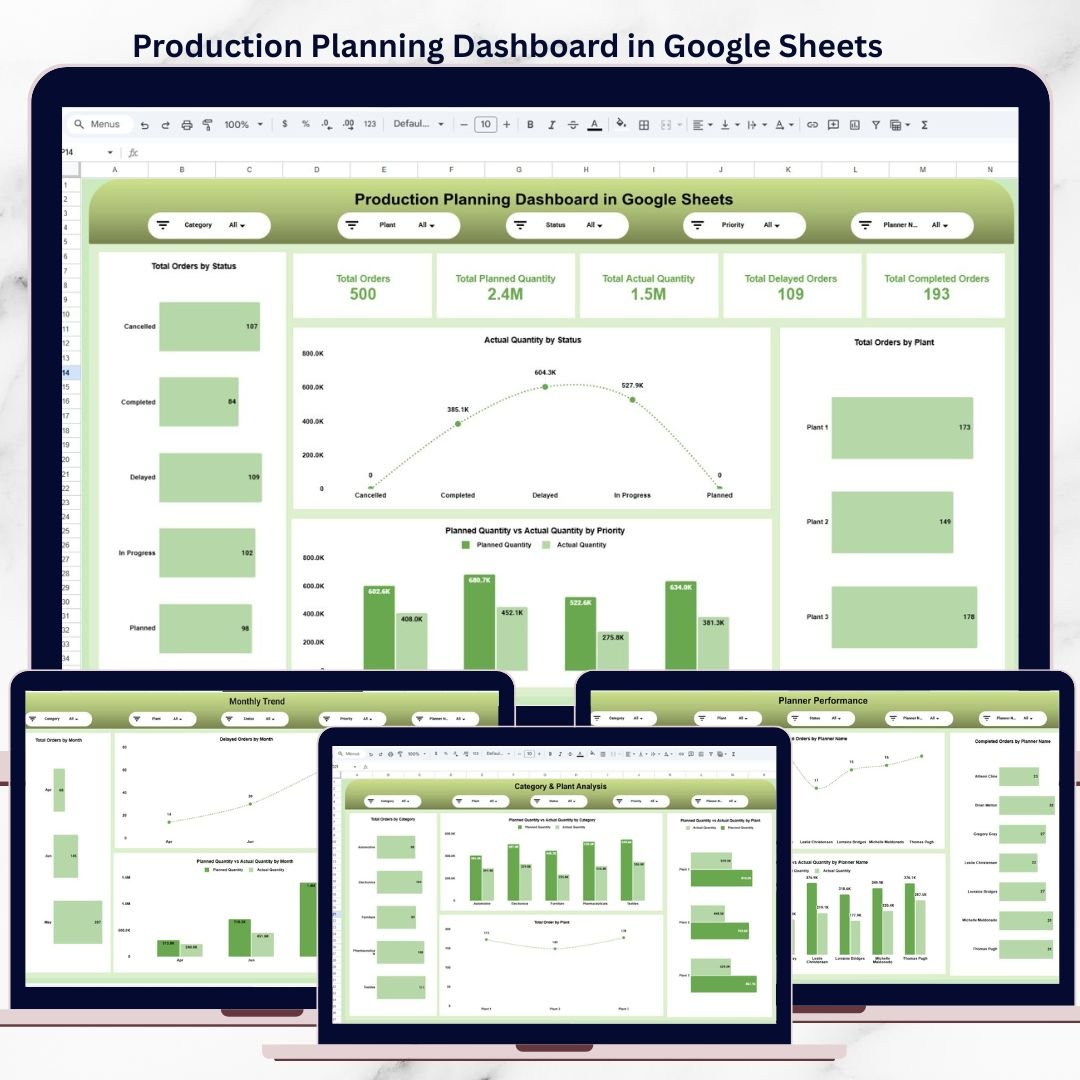
A complete snapshot of overall production health, including:
Total Orders
Planned Quantity
Actual Quantity
Delayed Orders
Completed Orders
Charts included:
Orders by Status
Actual Quantity by Status
Planned vs Actual by Priority
Orders by Plant
📁 Category & Plant Analysis Page
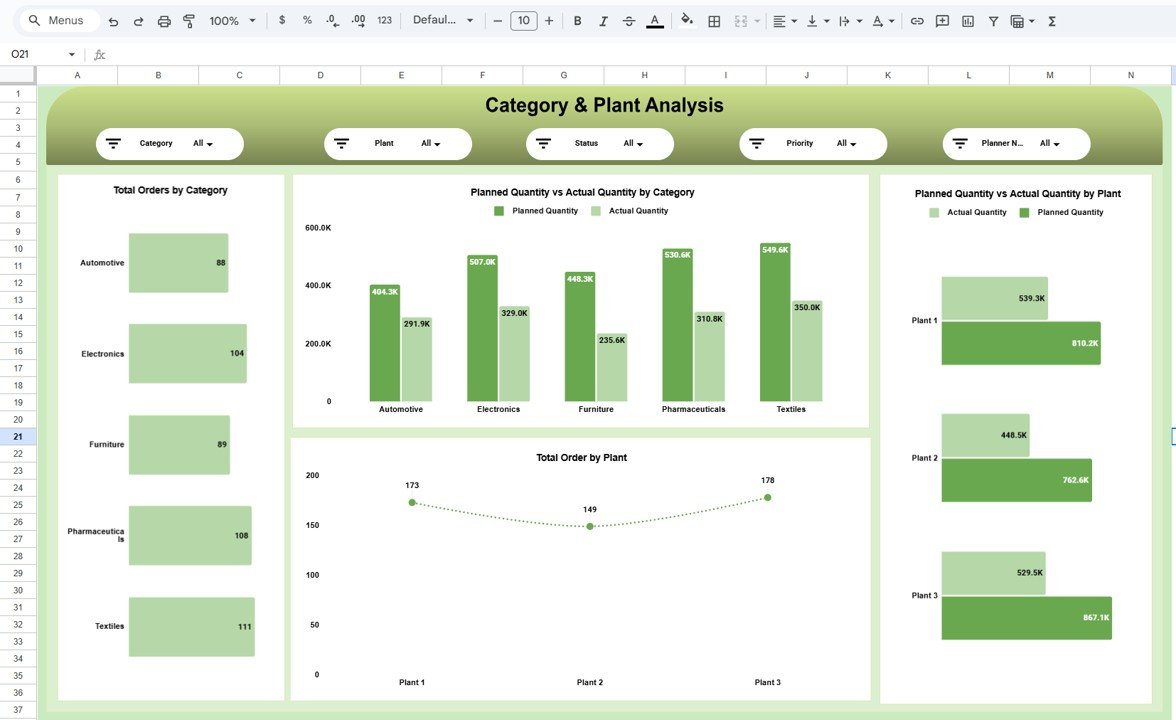
Deep insights into production performance by:
Product Category
Manufacturing Plant
Planned vs Actual by Category
Planned vs Actual by Plant
📁 Timeline & Delay Analysis Page
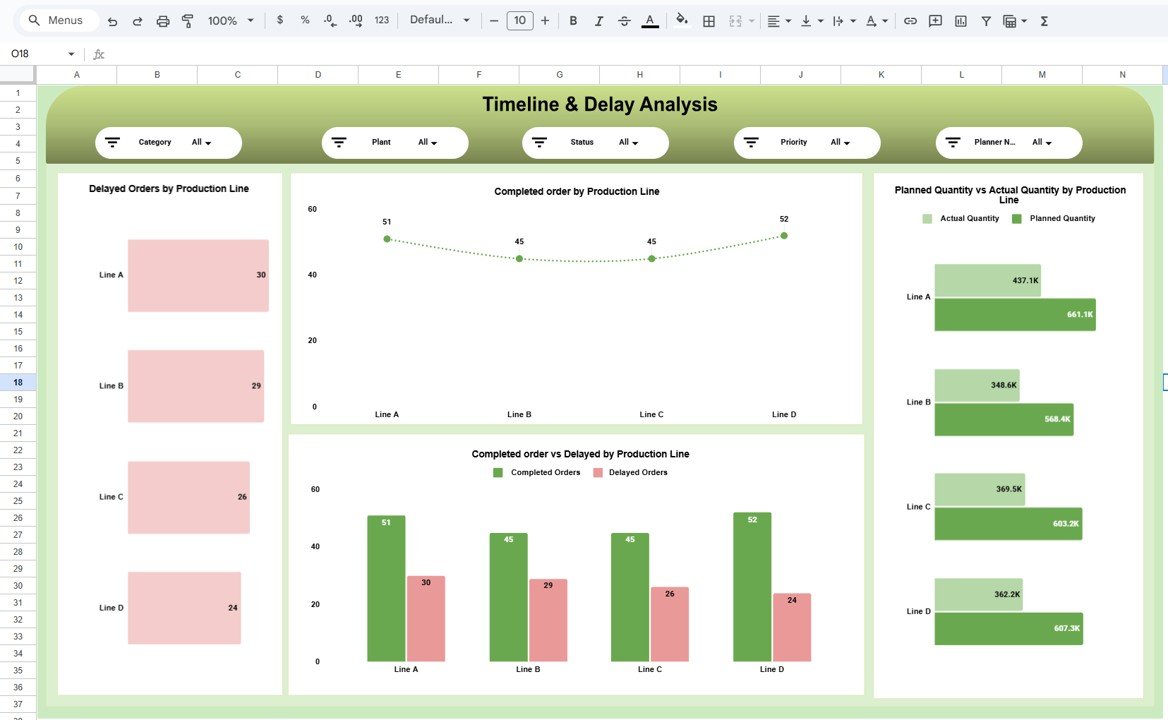
Identify bottlenecks using:
Delayed Orders by Production Line
Completed vs Delayed Orders
Planned vs Actual by Production Line
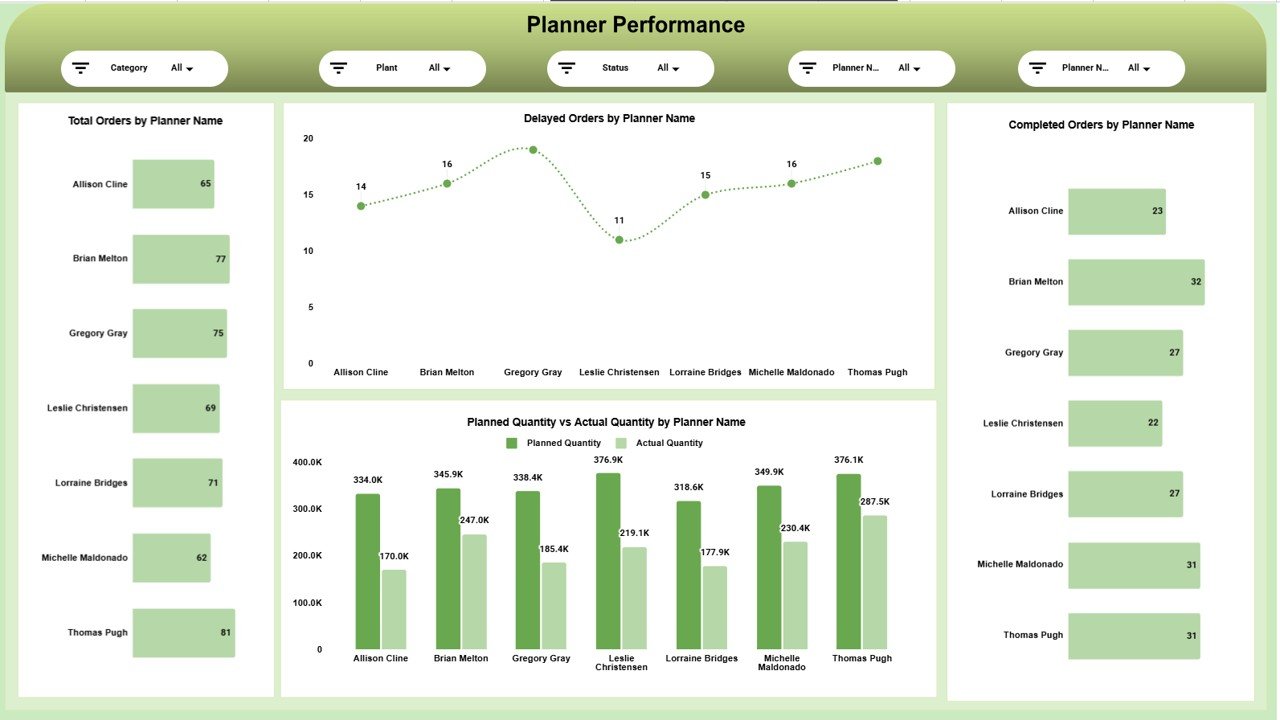
📁 Planner Performance Page
Evaluate planner efficiency with:
Total Orders by Planner
Delayed Orders by Planner
Completed Orders by Planner
Planned vs Actual by Planner
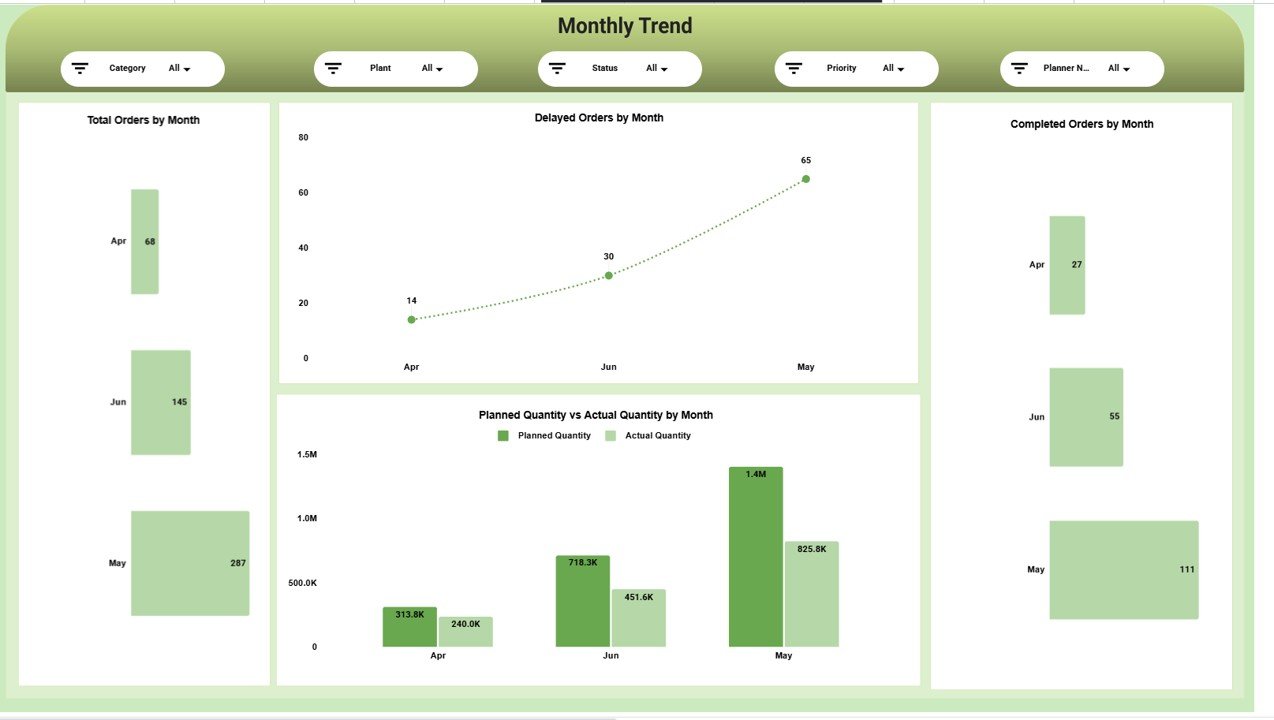
📁 Monthly Trend Page
Track time-based performance:
Orders by Month
Delays by Month
Completions by Month
Planned vs Actual by Month
📁 Data Sheet & Backend Logic
Clean structure for easy data entry and automatic updates.
🛠️ How to Use the Production Planning Dashboard
1️⃣ Enter or update production order data in the Data Sheet
2️⃣ Select filters such as plant, category, priority, or planner
3️⃣ Review planned vs actual output instantly
4️⃣ Identify delayed orders and problem areas
5️⃣ Monitor planner and plant performance
6️⃣ Take faster, informed production decisions
No coding. No complex formulas. Just update data and analyze.
👥 Who Can Benefit from This Production Planning Dashboard
🏭 Production Managers – Gain full visibility into production status
📊 Operations Heads – Track delays and improve coordination
📦 Manufacturing Planners – Balance workloads and priorities
🚚 Supply Chain Teams – Align production with delivery schedules
🏗️ Plant Managers – Compare plant-level performance
🏢 SMEs & Mid-Sized Manufacturers – Powerful analytics without high cost
If you plan, schedule, or monitor production—this dashboard is built for you.
📘 Click here to read the Detailed blog post
Watch the step-by-step video tutorial: