

In today’s fast-paced manufacturing world, every second counts. Delays, inefficiencies, and resource mismanagement can cost your business more than just money—they can damage your reputation. That’s why we created the Production Planning KPI Dashboard in Excel—a powerful, ready-to-use tool that lets you monitor key performance indicators (KPIs), eliminate bottlenecks, and maximize output.
Whether you’re a factory floor manager, production planner, or operations executive, this dashboard gives you everything you need to track, analyze, and improve your production processes—all within the comfort of Microsoft Excel.
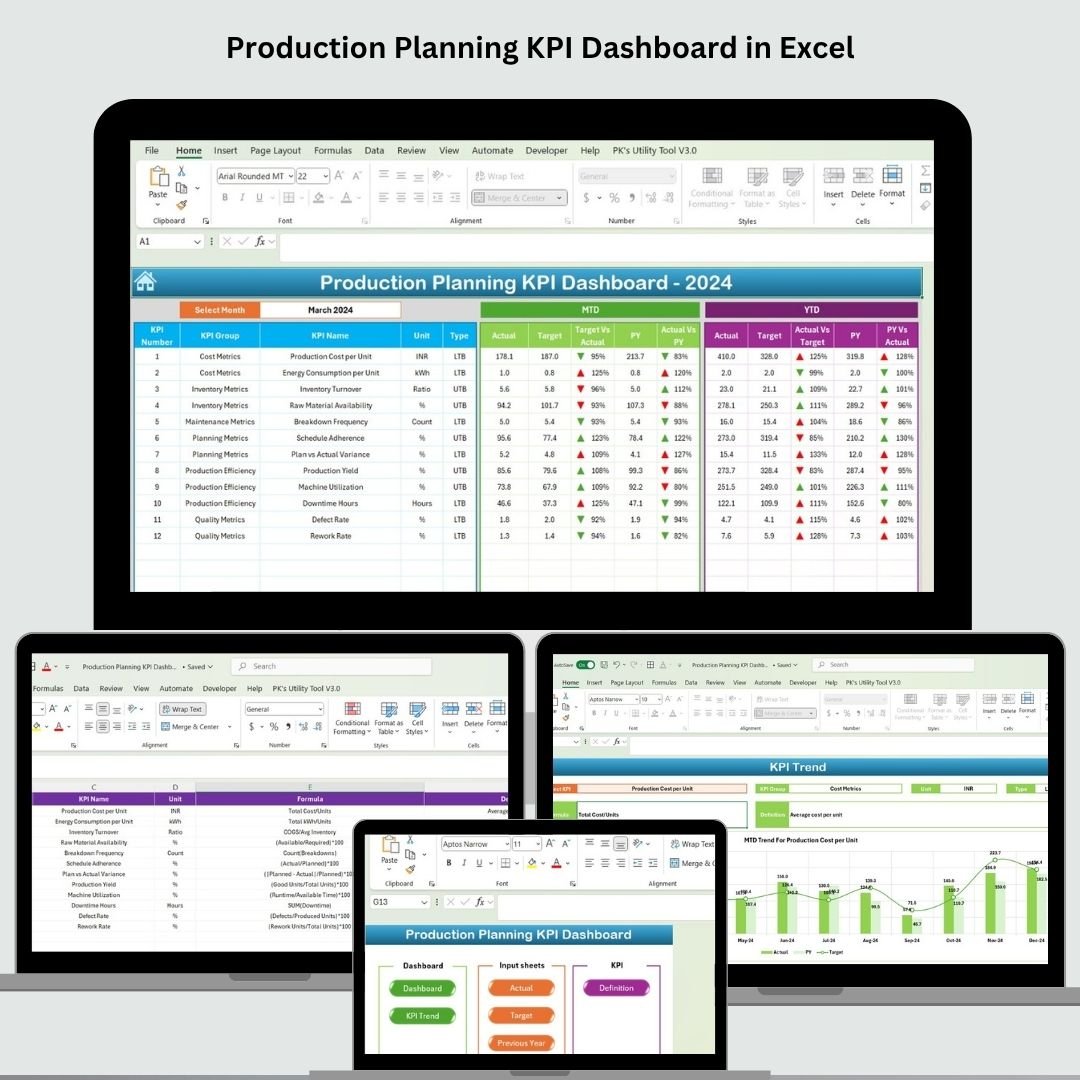
✨ Key Features of Production Planning KPI Dashboard in Excel
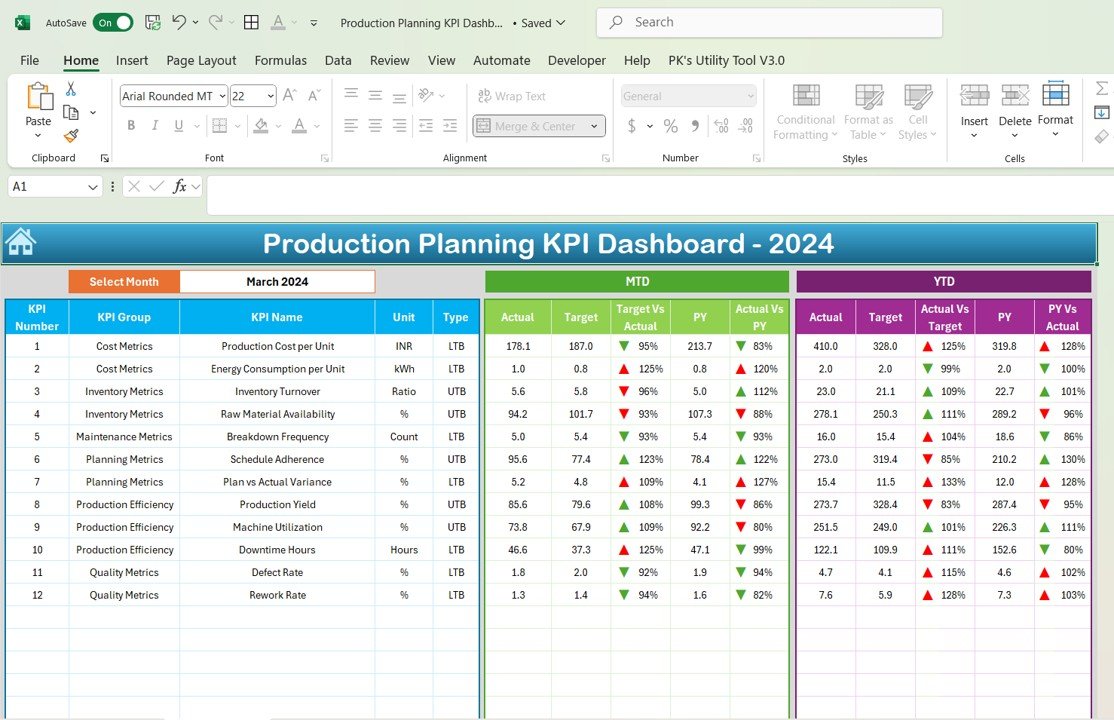
📊 Interactive Dashboard Overview
Get real-time visibility into Month-to-Date (MTD) and Year-to-Date (YTD) performance. Use the built-in dropdown to filter by month and watch your metrics update instantly.
🎯 Target vs Actual Comparison
Compare actual performance against targets with intuitive up/down arrow indicators, and assess progress compared to last year’s figures.
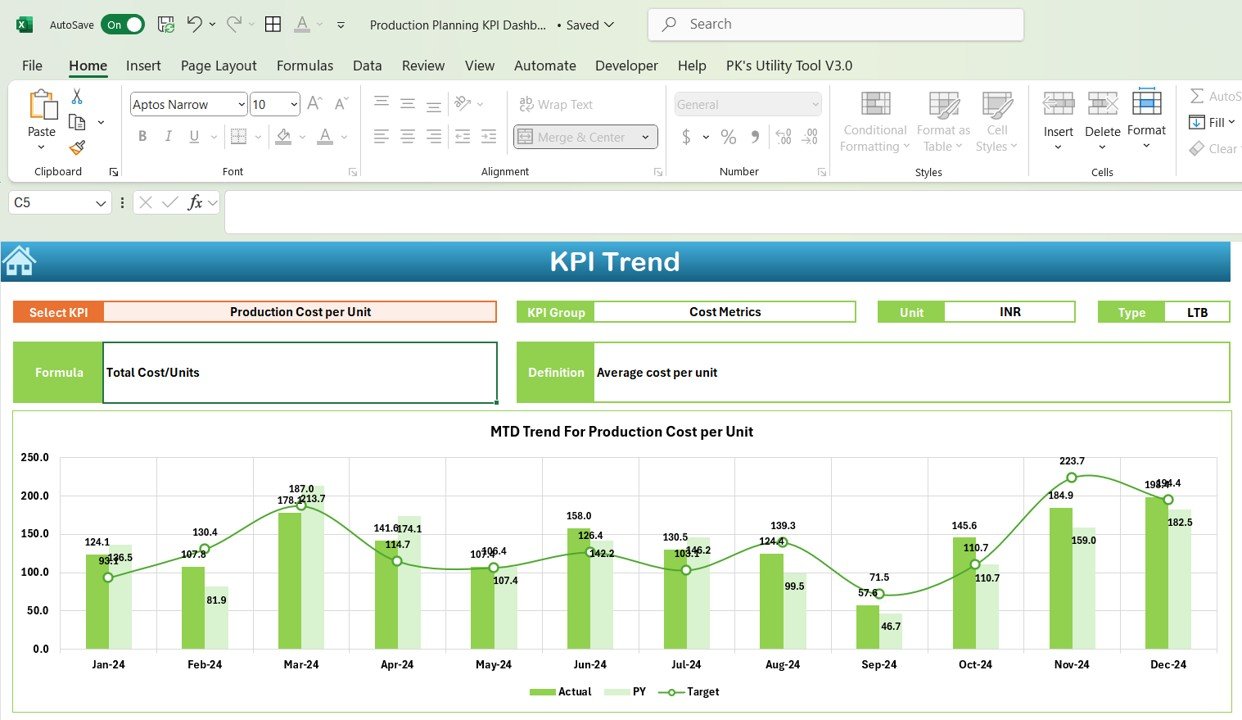
📈 Trend Analysis
Visualize trends in production output, cycle time, and other KPIs across time to make data-backed decisions faster.
🧮 Automated KPI Calculations
All formulas are pre-built for you! Just enter your actual and target data, and the dashboard takes care of the rest.
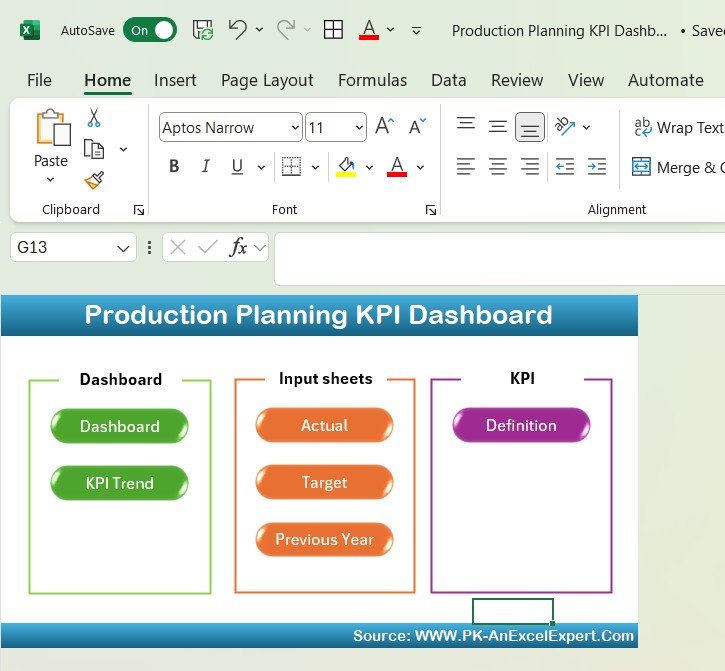
📁 Multi-Sheet Layout
Includes 7 well-organized sheets: Home, Dashboard, KPI Trend, Actual Numbers, Target, Previous Year, and KPI Definition.
📦 What’s Inside the Production Planning KPI Dashboard
-
Home Sheet – Your navigation hub with clear guidance and links to all other sections.
-
Dashboard Tab – The heart of the tool, presenting a visual snapshot of key metrics, targets, and comparisons.
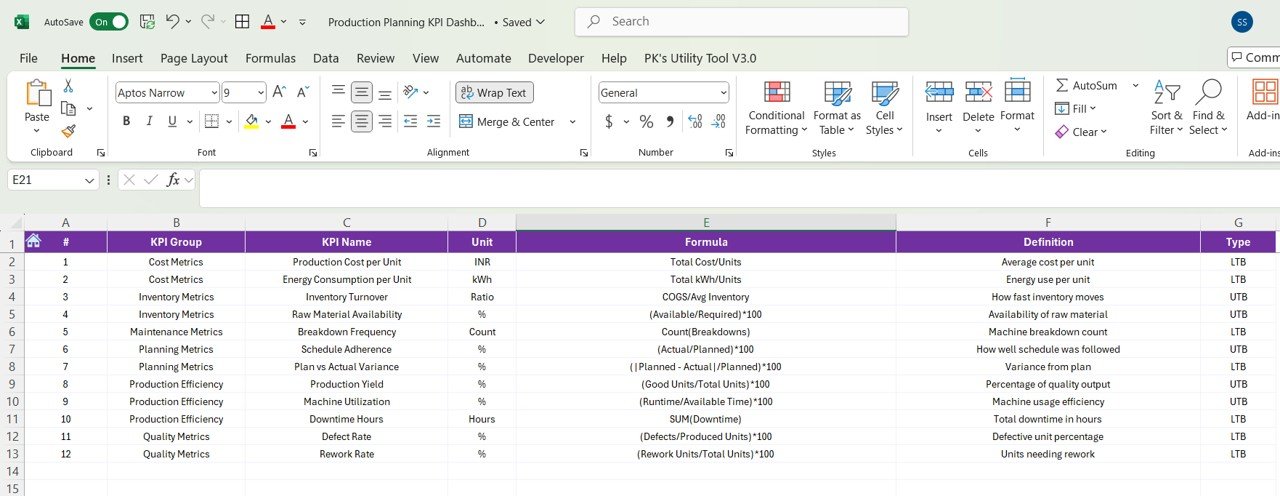
-
KPI Trend Tab – Dive deep into each KPI’s performance, unit of measurement, formula, and definition.
-
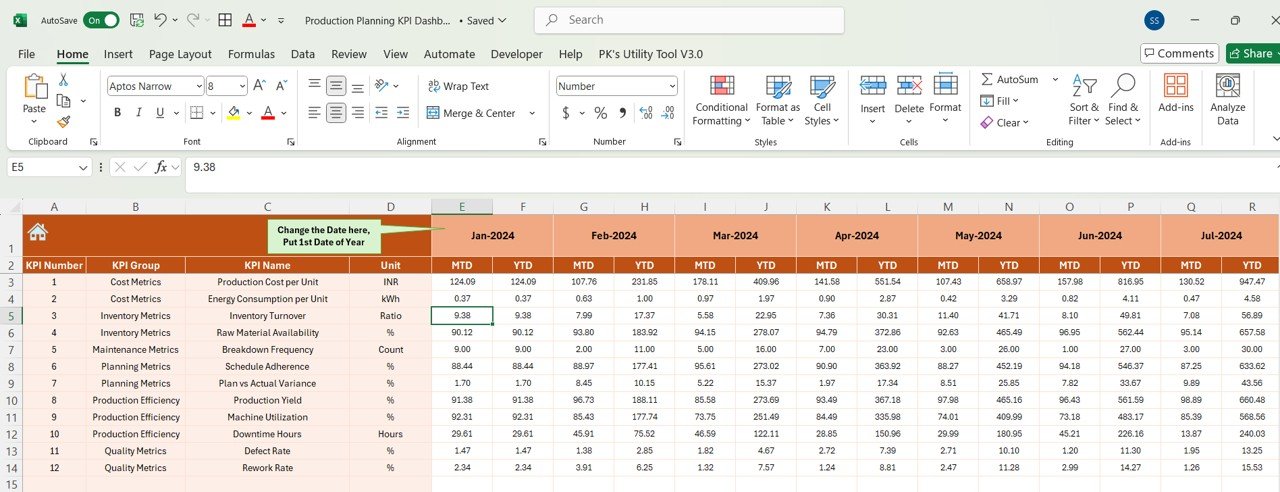
Actual Numbers Tab – Input MTD and YTD actuals in a clean table format.
-
Target Tab – Set measurable targets for performance tracking.
-
Previous Year Tab – Store historical data for easy year-over-year comparison.
-
KPI Definition Tab – Reference sheet with definitions and logic behind each KPI for full clarity.
🔧 How to Use the Production Planning KPI Dashboard
-
Enter Actuals – Use the Actual Numbers tab to input your real data.
-
Set Targets – Add monthly or yearly targets in the Target tab.
-
Compare Performance – See live comparisons with visuals on the Dashboard tab.
-
Track Trends – Head to the KPI Trend tab to analyze performance over time.
-
Update Monthly – Change the month using the dropdown, and the entire dashboard refreshes automatically.
No formulas to edit. No design work. Just plug in your numbers and go!
👥 Who Can Benefit from This Dashboard?
-
🏭 Manufacturing Managers – Monitor factory floor performance with precision.
-
📈 Operations Analysts – Gain real-time insights into cycle time, waste percentage, and production output.
-
📊 Production Planners – Plan better with data-backed forecasting.
-
🧑💼 Executives & Leadership – Make high-level strategic decisions based on real-time KPIs.
-
🧰 Small Business Owners – Streamline planning without complex software tools.
✅ Click here to read the Detailed blog post
Watch the step-by-step video Demo:


Reviews
There are no reviews yet.