Managing an asset management company without real-time visibility is a serious risk. Revenue, profit, operating costs, asset classes, fund types, client segments, and market trends constantly shift. However, when performance data remains trapped in spreadsheets and static reports, leaders react late and opportunities slip away.
That is exactly why the Asset Management Companies Dashboard in Power BI becomes a mission-critical intelligence solution.
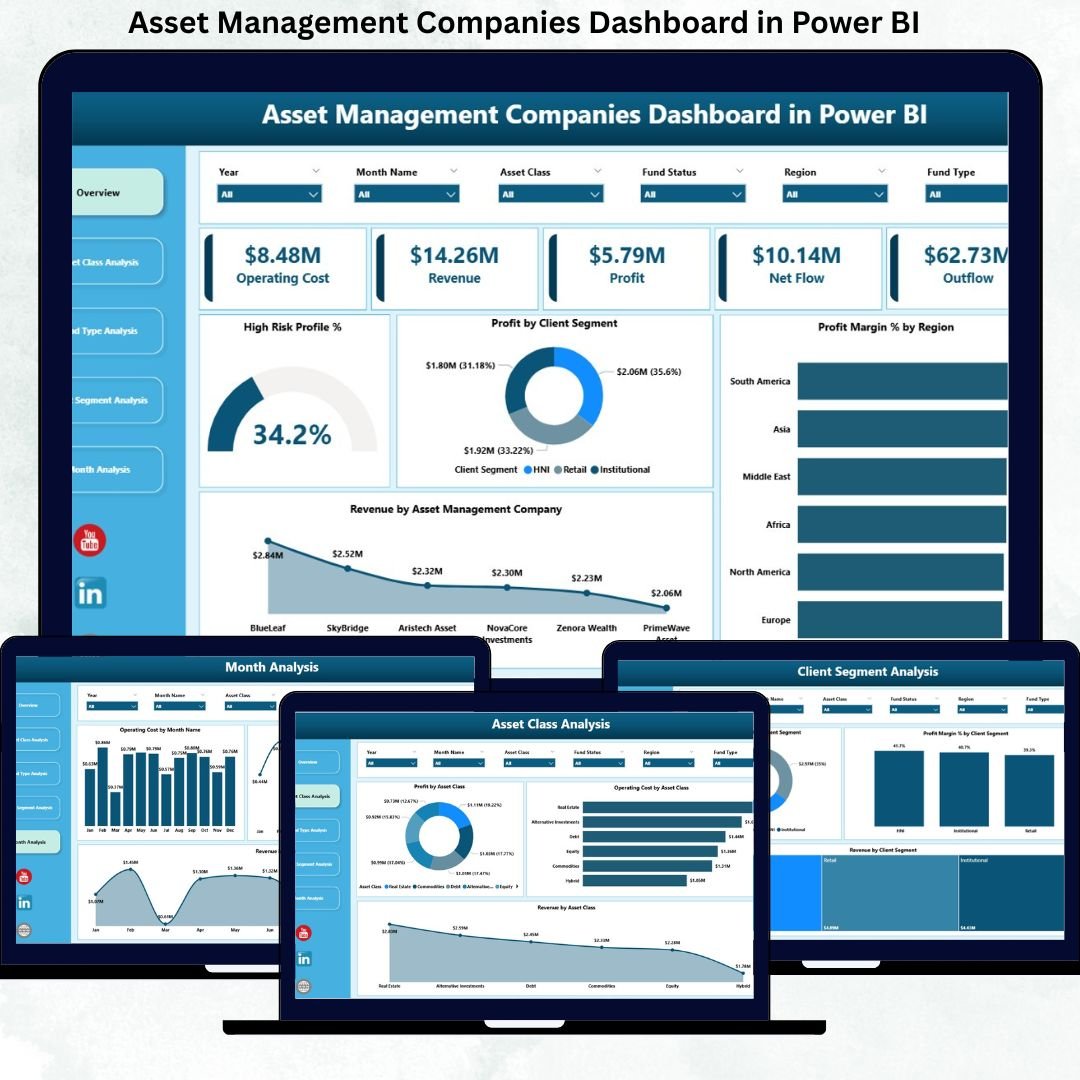
This ready-to-use, interactive Power BI dashboard converts complex financial and operational data into clear KPIs, visual insights, and actionable trends. Instead of manually compiling reports, asset managers and executives gain instant clarity across profitability, cost efficiency, risk exposure, and growth drivers.
Designed for modern investment firms, this dashboard acts as a central performance command center—helping organizations move from reactive reporting to proactive, data-driven decision-making.
🔑 Key Features of Asset Management Companies Dashboard in Power BI
📊 Centralized Performance Monitoring
Track revenue, profit, operating costs, and margins from one unified dashboard.
📈 Profitability & Margin Analysis
Understand profit and margin performance across asset classes, fund types, regions, and client segments.
⚠️ Risk-Aware Insights
Analyze high-risk profit contribution to balance risk and return effectively.
💼 Client Segment Performance Tracking
Identify high-value and cost-intensive client segments with clarity.
🏦 Asset Class & Fund Type Analysis
Evaluate performance across different investment products and portfolio structures.
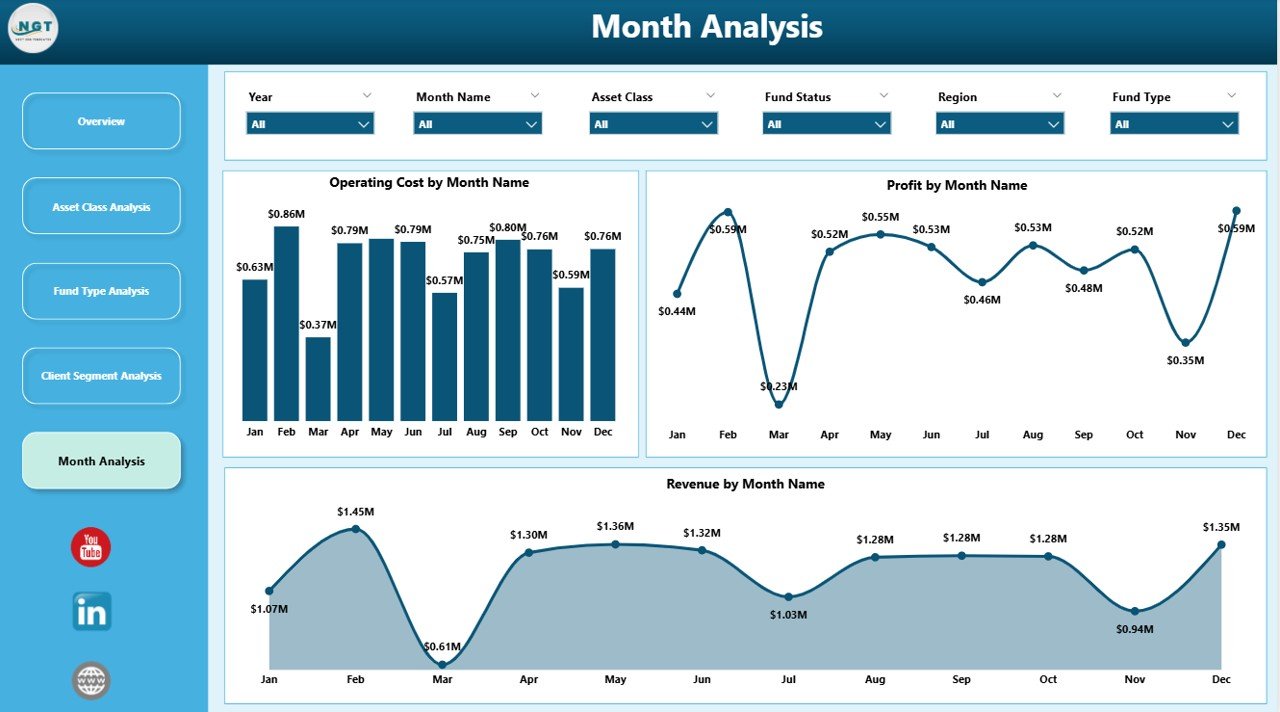
📅 Monthly Trend Analysis
Monitor revenue, profit, and cost trends over time to support forecasting.
⚡ Interactive Power BI Visuals
Use slicers and filters to explore data dynamically without technical skills.
📈 Scalable & Flexible Design
Adapt the dashboard easily as assets, funds, and clients grow.
📂 What’s Inside the Asset Management Companies Dashboard in Power BI
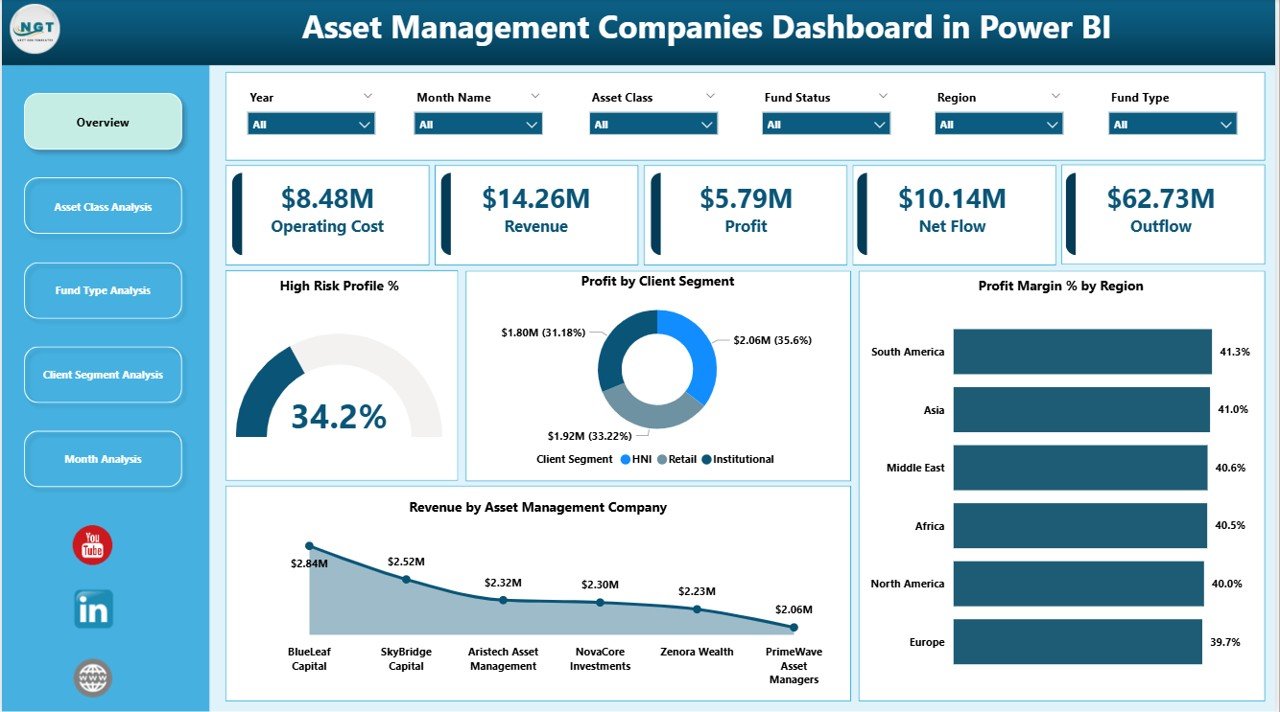
📁 Overview Page – High-level snapshot with KPI cards and strategic performance charts
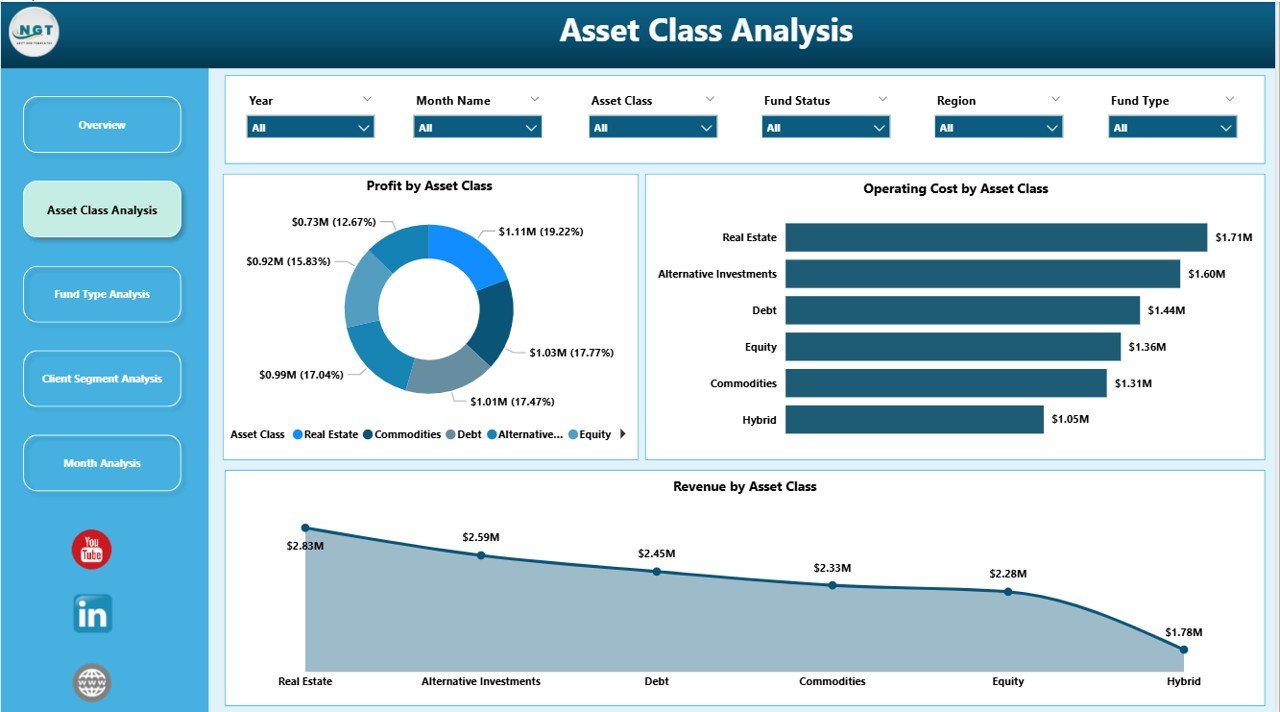
📁 Asset Class Analysis Page – Profit, revenue, and operating cost by asset class
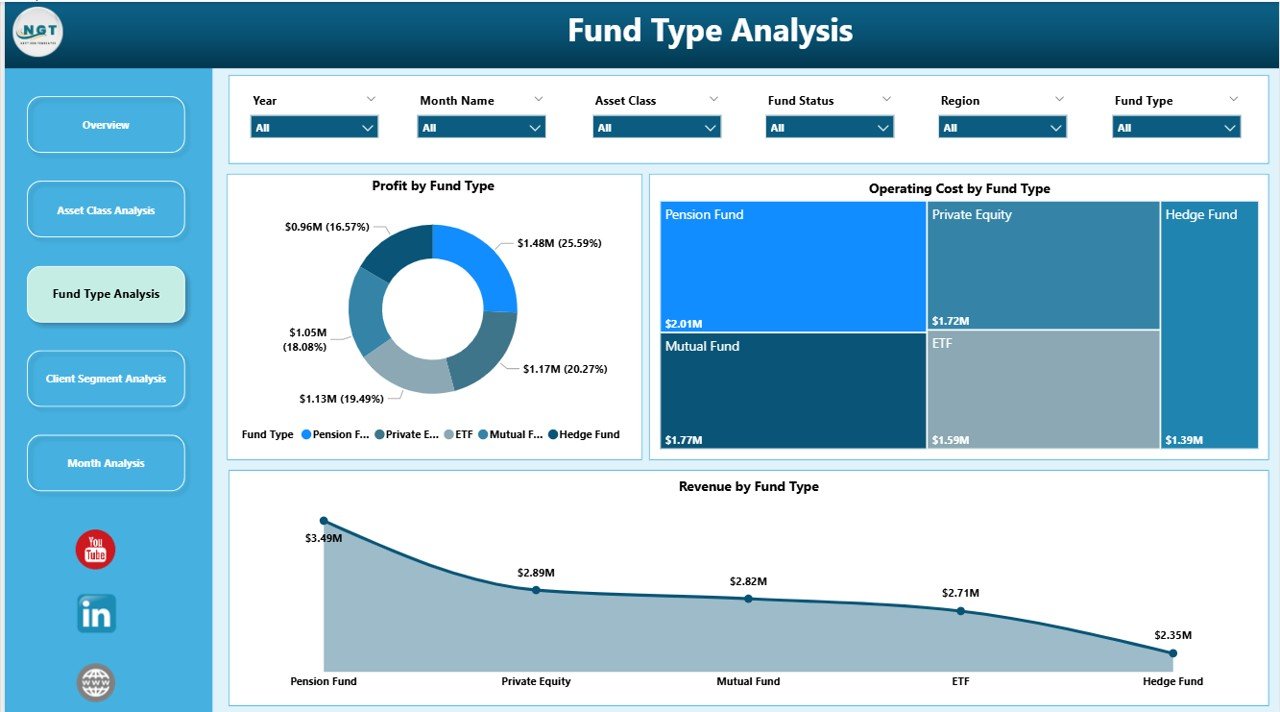
📁 Fund Type Analysis Page – Performance insights across different fund structures
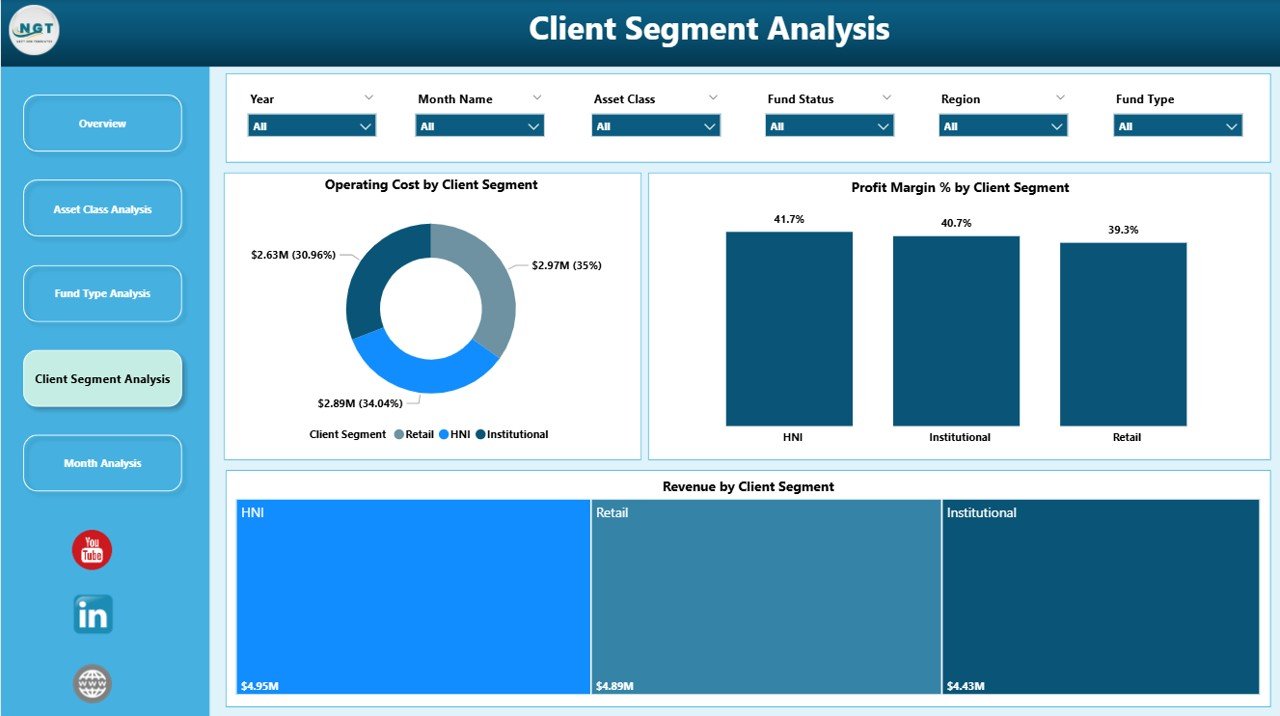
📁 Client Segment Analysis Page – Revenue, cost, and margin by client category
📁 Monthly Trends Page – Time-based analysis of revenue, profit, and costs
Together, these pages deliver a complete investment and operational performance intelligence system.
🛠️ How to Use the Asset Management Companies Dashboard in Power BI
1️⃣ Prepare structured data in Excel, ERP systems, or databases
2️⃣ Load or refresh the data in Power BI
3️⃣ Use slicers to filter by asset class, fund type, region, client segment, or time
4️⃣ Review KPI cards for quick performance checks
5️⃣ Analyze charts to identify profitable and underperforming areas
6️⃣ Use trend analysis for budgeting, forecasting, and strategy planning
The dashboard is intuitive, visual, and easy to adopt—no advanced Power BI expertise required.
👥 Who Can Benefit from This Asset Management Companies Dashboard in Power BI
💼 Asset management company leadership
📊 Portfolio and investment managers
💰 Finance and operations teams
🏦 Fund managers
📈 Strategy and planning teams
🏢 Small, mid-size, and large asset management firms
If your organization manages investments, funds, and client portfolios, this dashboard delivers immediate strategic value.
📘 Click here to read the Detailed blog post
🎥 Visit our YouTube channel to learn step-by-step video tutorials
👉 YouTube Channel


Reviews
There are no reviews yet.