



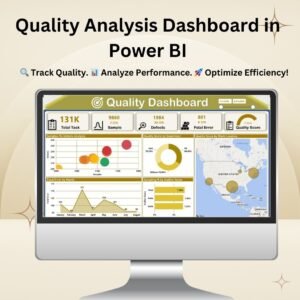
The Quality Analysis Dashboard in Power BI is a ready-made tool for tracking, monitoring and improving the quality of processes, products and employee performance. It is built for quality managers, supervisors, auditors and operations teams who want clear, real-time insight into key quality metrics. It helps you reduce defects, improve efficiency and make better quality decisions.
Key Features of the Quality Analysis Dashboard in Power BI
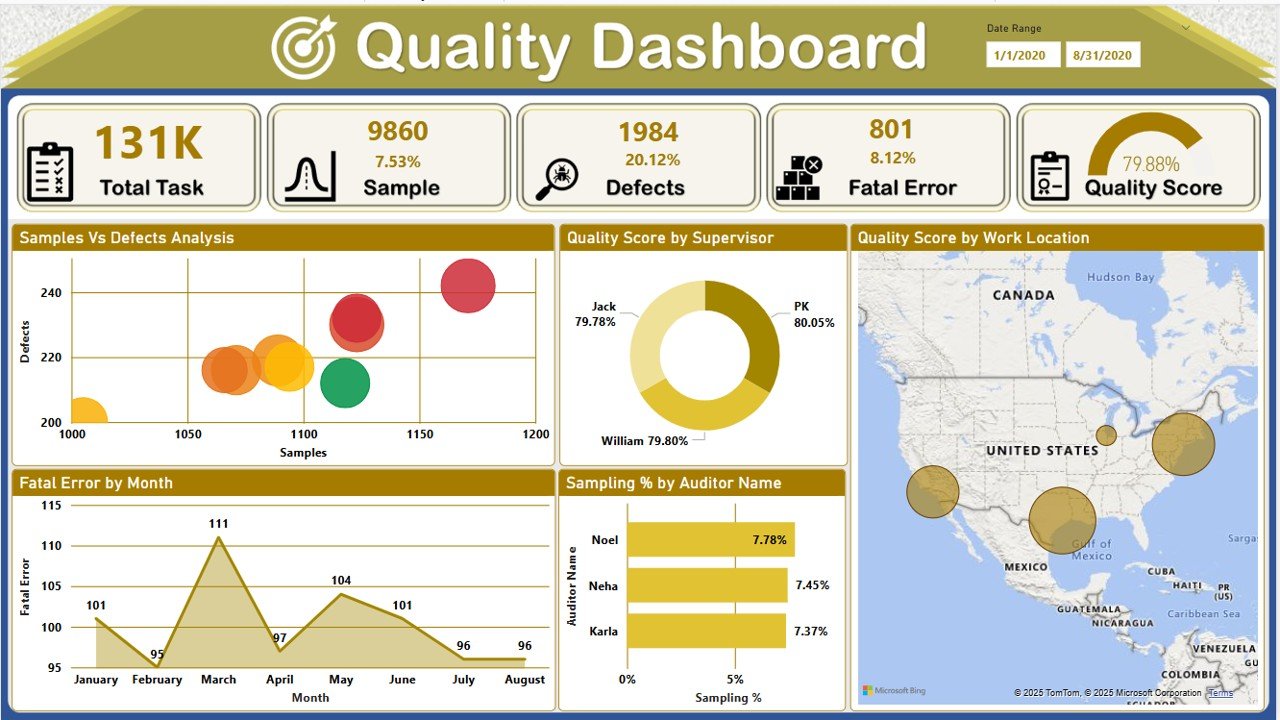
- Comprehensive quality overview: The main dashboard gives you a snapshot of quality metrics, including Total Task Count, Defects, Fatal Errors and Quality Scores. Interactive visuals let you assess performance and spot problem areas quickly.
- Samples vs. defects analysis: A dedicated bubble chart compares the samples tested with the defects found. Quality managers can use it to pinpoint high-risk areas and act early.
- Performance by supervisor: Monitor quality scores by supervisor to evaluate team efficiency and identify training needs.
- Performance by work location: A geo-map visualization shows quality performance across locations, which supports regional quality management.
- Trend analysis: A trend line shows how quality performance changes over time. It makes seasonal patterns and improvements easy to see.
- Fatal errors by month: The fatal error tracker highlights critical defects so you can reduce future risks.
- Sampling percentage by auditor name: A bar chart ranks auditors by sampling percentage, giving insight into auditing efficiency and possible discrepancies.
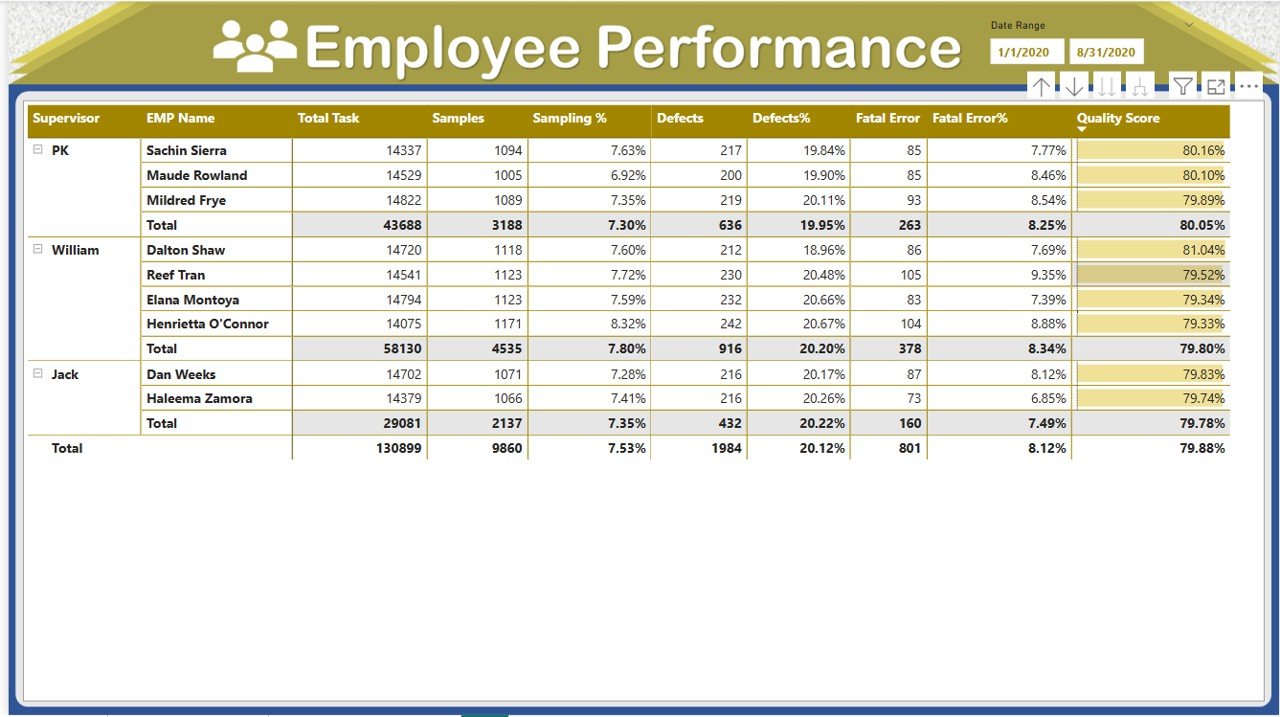
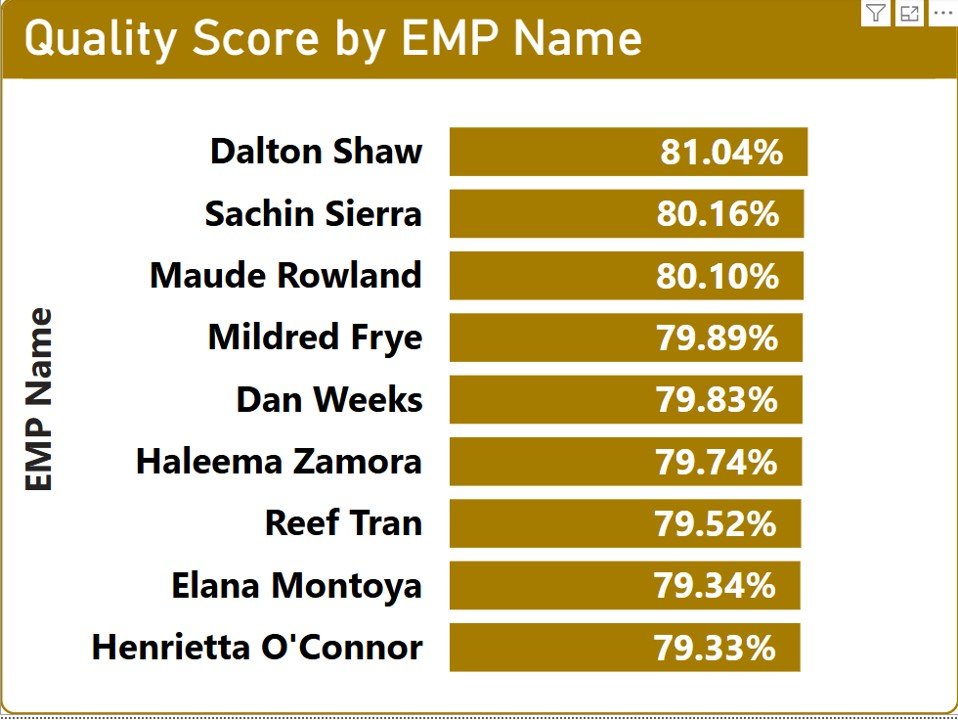
- Employee performance scorecard: A detailed tabular view breaks down performance for each employee, showing total tasks completed, sampling percentages, defect rates and final quality scores.
- Interactive, user-friendly navigation: Interactive filters, slicers and drill-down features let you explore data by time frame, supervisor, work location and employee name.
- Data-driven decision making: The dashboard uses Power BI DAX measures and data modeling to turn raw data into actionable insights for quality control and lower operational risk.
What’s Inside the Dashboard
This Power BI quality dashboard brings all of your quality analysis together in one interactive report. Each visual covers a different part of the quality picture:
| Visual / Section | What It Shows |
|---|---|
| KPI overview | Total Task Count, Defects, Fatal Errors and Quality Scores |
| Bubble chart | Samples tested vs. defects identified |
| Quality score by supervisor | Team-level quality performance |
| Geo-map | Quality performance by work location |
| Trend line | Quality performance over time |
| Fatal errors by month | Monthly tracking of critical defects |
| Bar chart | Sampling percentage by auditor name |
| Employee performance scorecard | Tasks, sampling %, defect rates and final quality scores per employee |
| Filters and slicers | Time frame, supervisor, work location and employee name |
How This Dashboard Benefits Your Business
- Monitor quality performance in real time: See quality metrics and defect rates at a glance.
- Identify process improvement areas: Use trend analysis and defect analysis to improve workflows.
- Enhance employee productivity: Evaluate performance by individual employee and by supervisor.
- Reduce quality defects and errors: Spot recurring issues and take corrective action early.
- Make data-driven quality decisions: Drill down into the key data points in the interactive reports.
Who It’s For
- Quality managers who need a single view of defects, fatal errors and quality scores.
- Supervisors and team leads who want to compare team performance and find training needs.
- Auditors and QA teams who track sampling percentages and auditing efficiency.
- Operations and process improvement teams working across multiple work locations.
- Power BI users who want a ready-made quality reporting template instead of building one from scratch.
How to Use It
- Open the Quality Analysis Dashboard in Power BI.
- Review the overview cards for Total Task Count, Defects, Fatal Errors and Quality Scores.
- Use the slicers to filter by time frame, supervisor, work location or employee name.
- Explore the bubble chart, geo-map, trend line and auditor bar chart to find high-risk areas.
- Check the employee performance scorecard to identify top performers and employees who need more training.
- Watch the step-by-step video tutorial below for setup guidance.
Click here to read the detailed blog post on the Quality Analysis Dashboard in Power BI
Watch the Step-by-Step Video Tutorial
Need help setting up the dashboard? Watch our full Power BI tutorial on YouTube for step-by-step guidance.
Frequently Asked Questions
What does the Quality Analysis Dashboard in Power BI track?
It tracks Total Task Count, Defects, Fatal Errors and Quality Scores. It also shows samples vs. defects, quality scores by supervisor and work location, monthly fatal errors, sampling percentage by auditor and a detailed employee performance scorecard.
Can I filter the dashboard by employee or location?
Yes. Interactive filters, slicers and drill-down features let you explore the data by time frame, supervisor, work location and employee name.
How does it help with process improvement?
Trend analysis, defect analysis and the fatal error tracker help you spot recurring issues and seasonal patterns. You can then take corrective action and improve your workflows.
What is included in the employee performance scorecard?
The tabular scorecard shows each employee’s total tasks completed, sampling percentage, defect rate and final quality score. This makes it easy to find top performers and employees who need further training.
Is there a tutorial for setting it up?
Yes. A step-by-step video tutorial is embedded on this page, and a detailed blog post is linked above.
What powers the calculations in the dashboard?
The dashboard uses Power BI DAX measures and data modeling to turn raw data into actionable quality insights.
Also check our Comparative Analysis Dashboard in Excel.
Last updated: October 2026
Compatibility and Requirements
- Needs Power BI Desktop, which is free from Microsoft. See Get Power BI Desktop to install it.
Related Quality Dashboards
- Quality Assurance Dashboard in Power BI: another quality report in Power BI
- Quality KPI Dashboard in Power BI: tracks quality KPIs against targets
- Quality Assurance Dashboard in Excel: a quality dashboard for Excel users
- Quality Assurance Dashboard in Google Sheets: the Google Sheets option
- Quality and Audit Management Bundle: 8 quality and audit templates in one pack
Browse all Power BI dashboards or the Power BI templates.

















Reviews
There are no reviews yet.