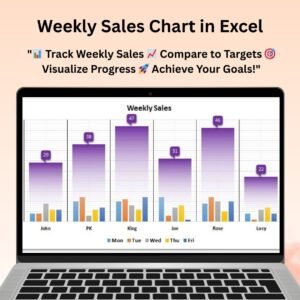
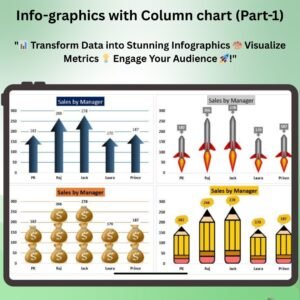
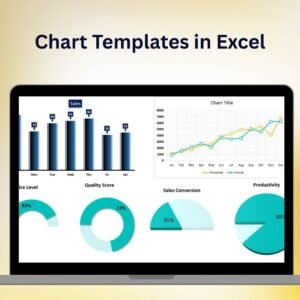
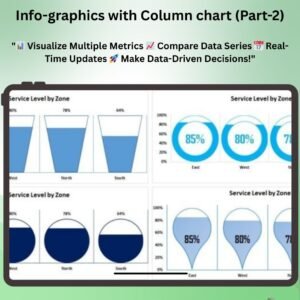
The Stylish Column Chart in Excel is a visually striking and highly customizable chart designed to present your data in a professional and engaging way. Whether you’re tracking sales, performance metrics, or any other data, this stylish column chart makes it easy to visualize your data trends with a touch of style and elegance.
With its modern design and clear, easy-to-understand format, this chart enhances the readability of your data and helps you present key insights effectively. This chart is fully customizable, allowing you to adjust colors, labels, and data points to match your business needs. Perfect for presentations, reports, or dashboards, the Stylish Column Chart helps you communicate data in a more visually appealing way.

Key Features of the Stylish Column Chart in Excel
📌 Sleek and Modern Design
The stylish column chart offers a modern, polished look that makes your data visually appealing. Its clean and professional design makes it ideal for both internal reporting and client presentations.
🛠 Fully Customizable
Customize the chart’s colors, labels, and data points to match your business’s branding or presentation style. Whether you want to highlight specific categories or simply adjust the appearance, you can easily tailor the chart to your needs.
💡 Clear and Engaging Data Presentation
This column chart allows you to present your data in an easy-to-understand format. The sleek columns make it easy to compare different data sets, track trends, and highlight outliers or key performance areas.
🔢 Real-Time Updates
As you update your data, the chart automatically adjusts to reflect the changes. This ensures that you always have the most up-to-date information, making it perfect for dynamic dashboards or real-time reporting.
🚀 Multiple Use Cases
Perfect for a wide variety of applications, this stylish column chart can be used to track sales performance, financial data, project milestones, or any other metrics that need to be displayed in a clear, visual format.
📊 Dynamic Data Visualization
The chart helps you visualize trends and performance at a glance, making it easy to identify areas of strength or improvement. Use it to provide actionable insights into your business’s performance and goals.
⚙ Easy Setup and Customization
With simple setup instructions and user-friendly customization options, this chart is easy to implement, even for those with basic Excel skills.
🚀 Why You’ll Love the Stylish Column Chart in Excel
✅ Sleek and Professional – Present your data with style and sophistication. ✅ Fully Customizable – Tailor the chart to suit your needs with flexible color and label options. ✅ Real-Time Data Updates – The chart adjusts instantly as you input new data. ✅ Clear Data Visualization – Easily compare values, track performance, and spot trends. ✅ Simple Setup – Quick to implement with easy-to-follow setup instructions.
📂 What’s Inside the Stylish Column Chart in Excel?
- Modern Column Chart: A sleek and customizable chart for clear data visualization.
- Customizable Colors and Labels: Adjust the chart to match your branding and presentation style.
- Real-Time Updates: Automatically reflect changes as new data is entered.
- Clear Setup Instructions: Easy steps to get started and customize the chart for your needs.
🔍 How to Use the Stylish Column Chart in Excel
1️⃣ Download the Template – Get instant access to the Excel file upon purchase. 2️⃣ Input Your Data – Enter your sales, performance, or other data points. 3️⃣ Customize the Chart – Modify colors, labels, and categories to match your preferences. 4️⃣ Track Performance – Use the chart to track and compare data trends effectively. 5️⃣ Present and Share – Share the visually appealing chart in meetings, reports, or presentations.
🎯 Who Can Benefit from the Stylish Column Chart in Excel? 🔹 Business Analysts
🔹 Project Managers
🔹 Sales Teams
🔹 Marketing Professionals
🔹 Financial Analysts
🔹 Anyone needing a visually appealing chart for data presentation
Visualize your data with style and clarity using the Stylish Column Chart in Excel. Perfect for tracking performance, visualizing sales, or reporting on any key metrics, this chart will make your data presentations more engaging and insightful.
Click here to read the Detailed blog post
https://www.pk-anexcelexpert.com/stylish-column-chart-in-excel/
Visit our YouTube channel to learn step-by-step video tutorials
Watch the step-by-step video tutorial:














Reviews
There are no reviews yet.