



Keep your quality metrics on point with this powerful, Excel-based dashboard designed for real-time insights and easy data handling. Whether you’re managing inspections, analyzing defects, or optimizing team performance—this tool does it all in one place!
🧩 Key Features of the Quality Assurance Dashboard in Excel
📌 Interactive Page Navigator – Jump between analytical views in just one click with the built-in side panel.
📈 Overview Dashboard – Includes KPI cards for inspections, samples, defect rate, and charts like:
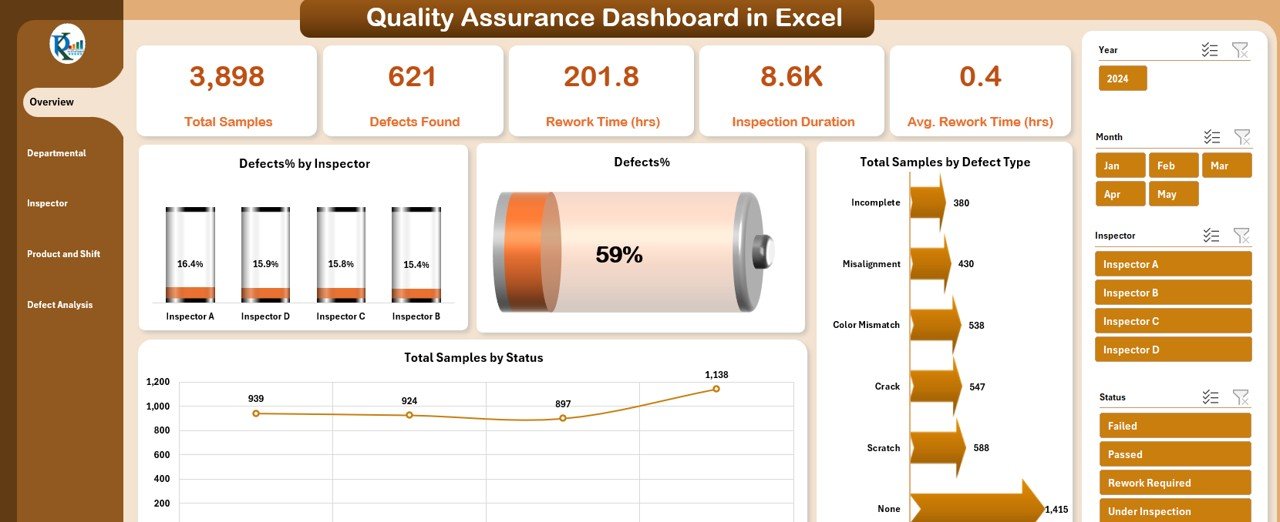
Defects % by Inspector
Total Samples by Status
Defect % Trend
Total Samples by Defect Type
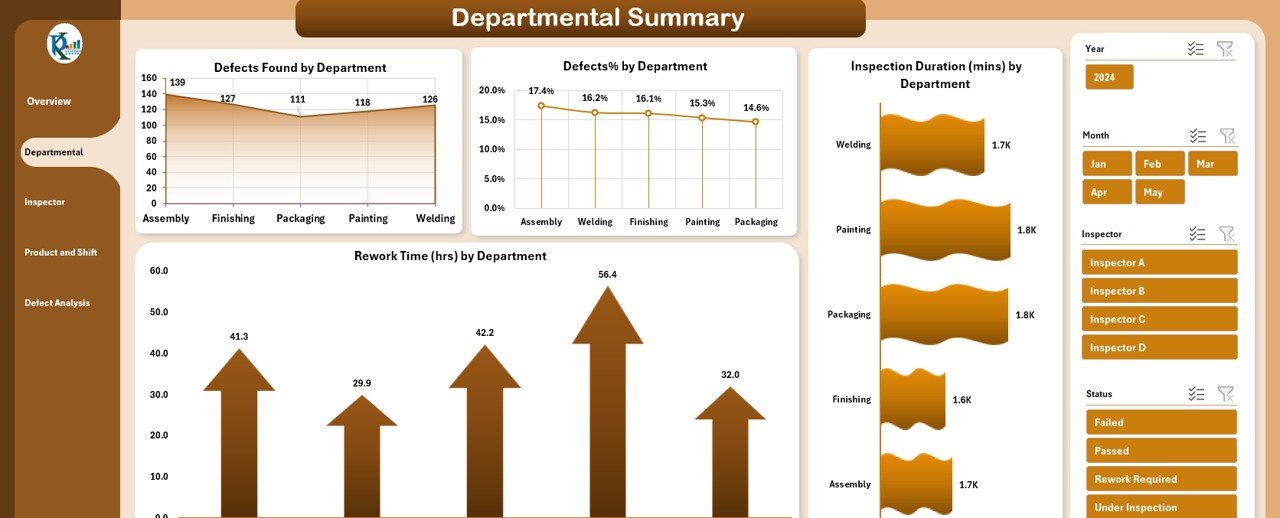
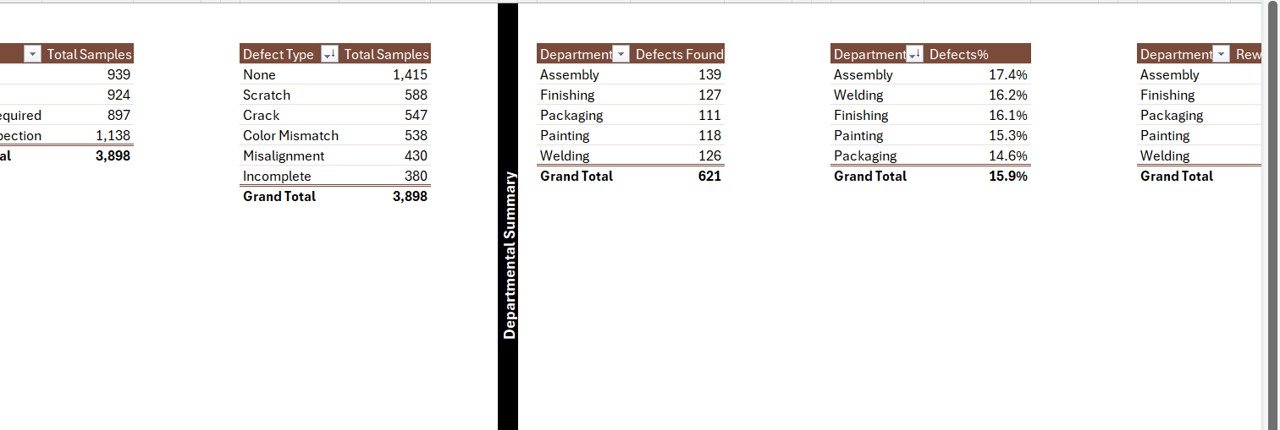
🏭 Departmental Summary – Instantly visualize performance metrics like:
Defects by Department
Rework Time
Inspection Duration
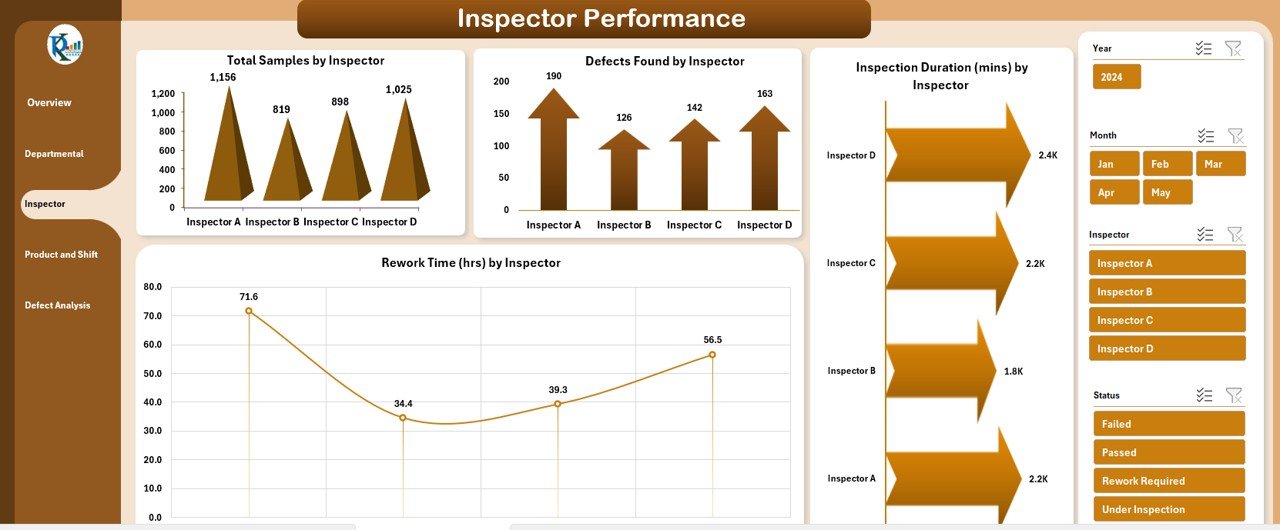
👷 Inspector Performance – Fair, data-backed insights into:
Defects Found
Rework Time
Sample Volume
🕒 Shift & Product Line Breakdown – Analyze QA data by:
Shift Timing
Product Category
Rework Hours
Defects by Shift or Line
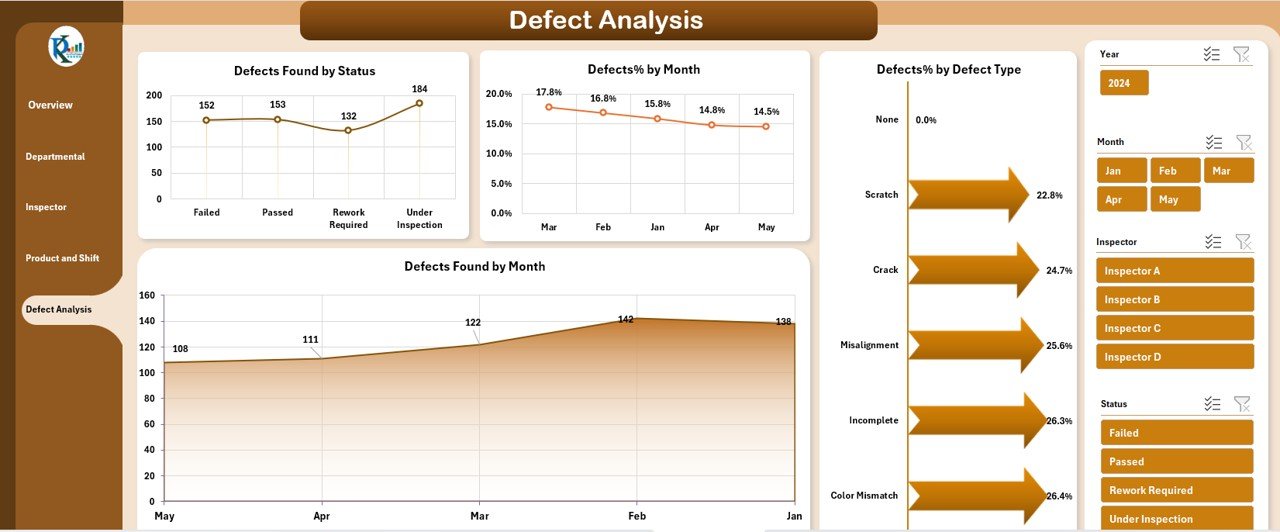
📊 Defect Analysis Page – Get detailed breakdowns by status, type, and monthly trends.
📁 What’s Inside the Quality Assurance Dashboard in Excel
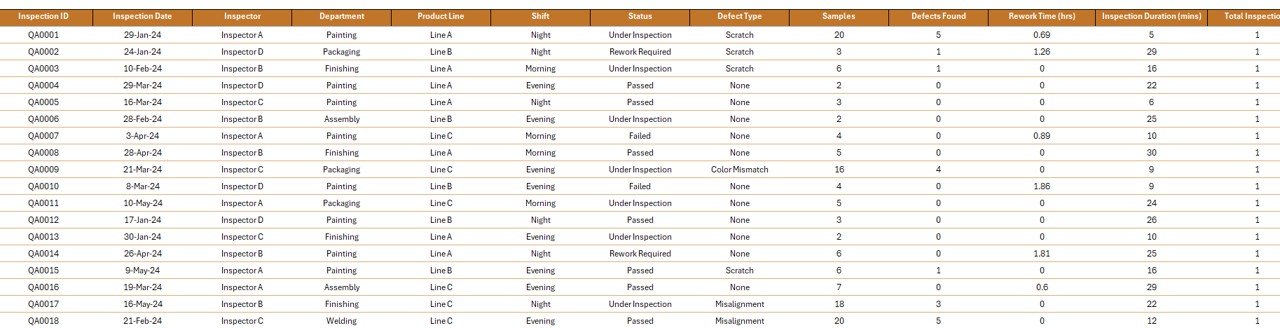
The dashboard is powered by a structured and dynamic Data Sheet that includes:
✅ Inspection ID
✅ Date, Month, Year
✅ Inspector, Department
✅ Product Line, Shift
✅ Status & Defect Type
✅ Rework Time & Duration
✅ Number of Samples & Defects
All charts and summary cards update automatically based on this data.
🧠 How to Use the Quality Assurance Dashboard in Excel
📥 Input inspection data in the Data Sheet
📊 Navigate using the side panel
🔍 Apply filters or slicers for department, inspector, or month
📤 Export PDF or Excel to share reports
🛠️ Customize charts or colors to suit your branding
Even Excel beginners can make the most of this tool with ease!
🎯 Who Can Benefit from This Quality Assurance Dashboard
👷 QA Inspectors & Managers – Track team performance and defect trends
🏭 Manufacturing Units – Optimize shift and department productivity
🚚 Logistics & Service Teams – Ensure compliance and quality control
📊 Analysts & Data Leads – Get real-time visual insights without coding
💼 Small Business Owners – Affordable quality tracking with no extra tools
📌 Why Choose This Excel QA Dashboard?
✅ Works without additional software
✅ 100% customizable
✅ Visually appealing & easy to read
✅ Ideal for both small and large teams
✅ Saves hours of manual reporting
🔁 Click here to read the Detailed blog post




























Reviews
There are no reviews yet.