

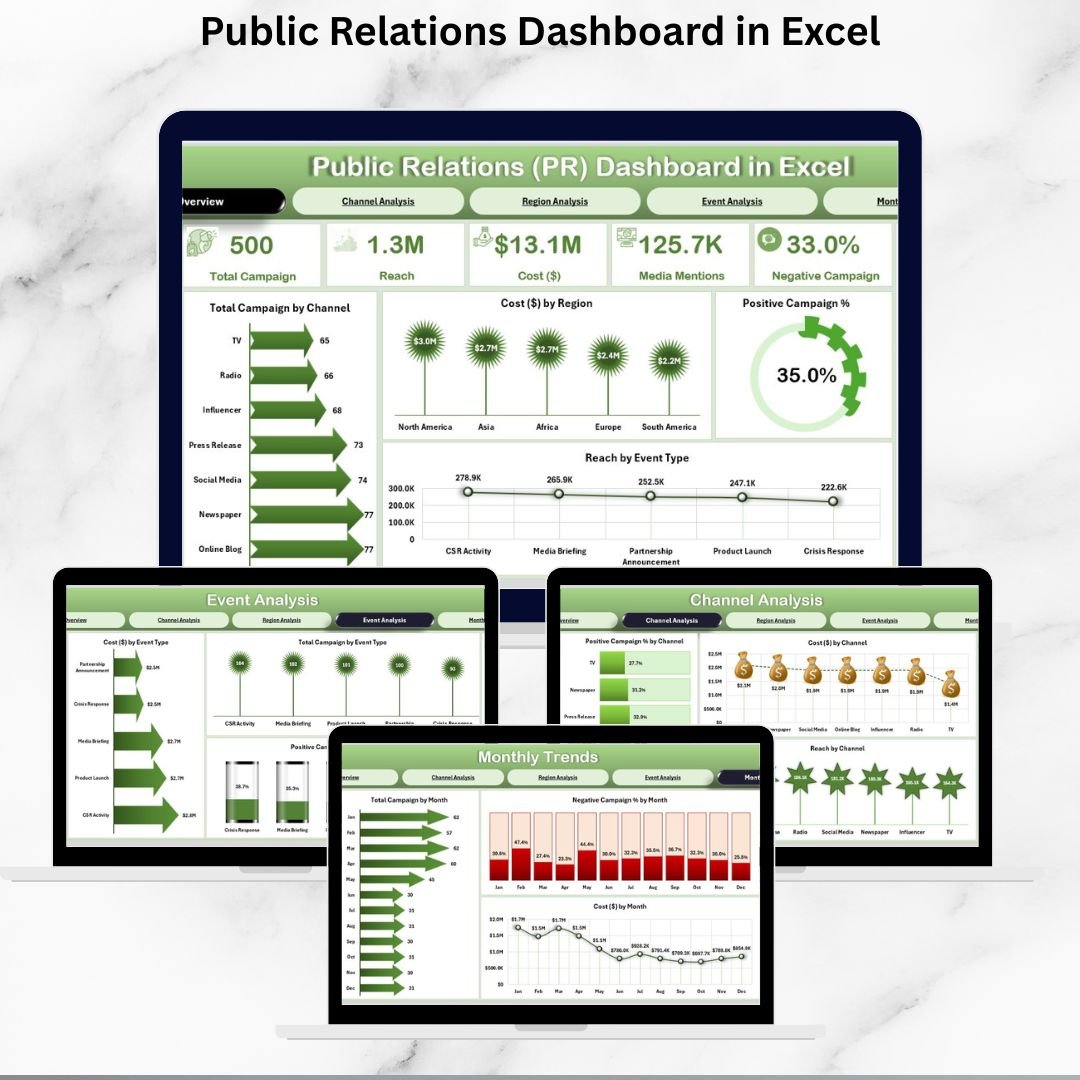

Managing Public Relations (PR) has evolved far beyond press releases and media pitches. In today’s digital-first world, PR professionals must track campaigns, coverage, sentiment, costs, and reach across multiple channels. Without a structured system, analyzing PR success can be overwhelming and inefficient.
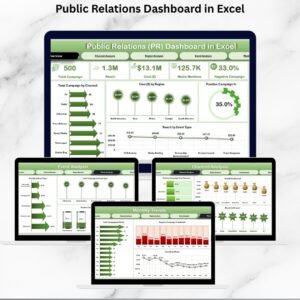
That’s why we created the Public Relations Dashboard in Excel—a ready-to-use, interactive, and visual solution that consolidates PR data into one central view. With built-in slicers, navigation buttons, KPI cards, and charts, this dashboard helps PR teams and executives measure impact, optimize campaigns, and make data-driven communication decisions.
✨ Key Features of PR Dashboard in Excel
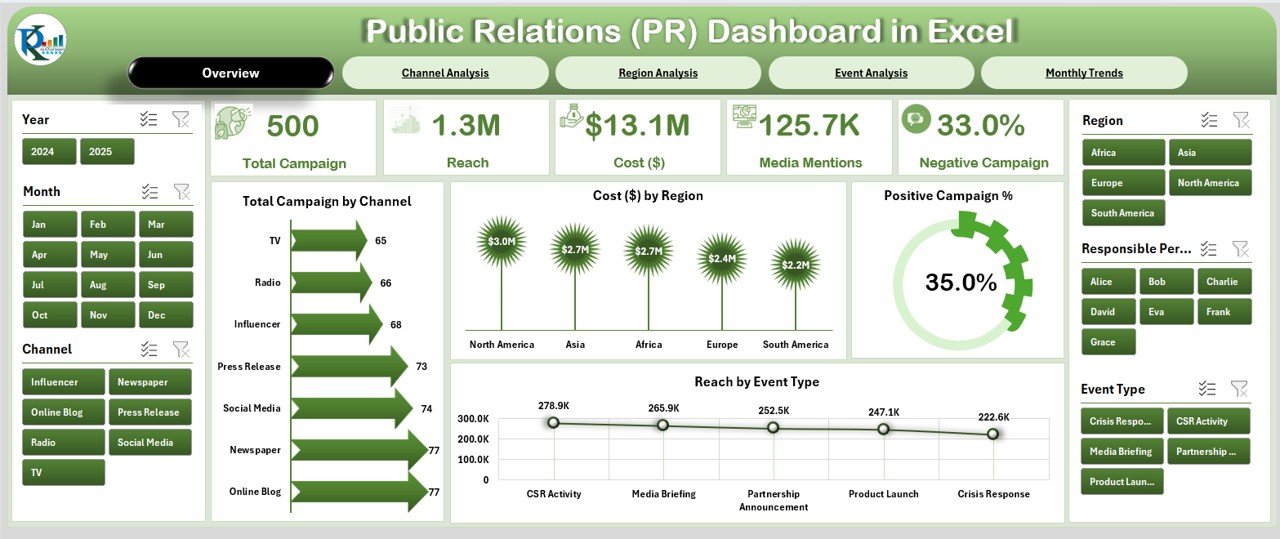
📊 5 Analytical Pages – Overview, Channel, Region, Event, and Monthly Trends.
🎯 KPI Cards – Instantly track campaign count, cost, reach, and sentiment.
⚡ Interactive Slicers – Filter by time, region, channel, or campaign type.
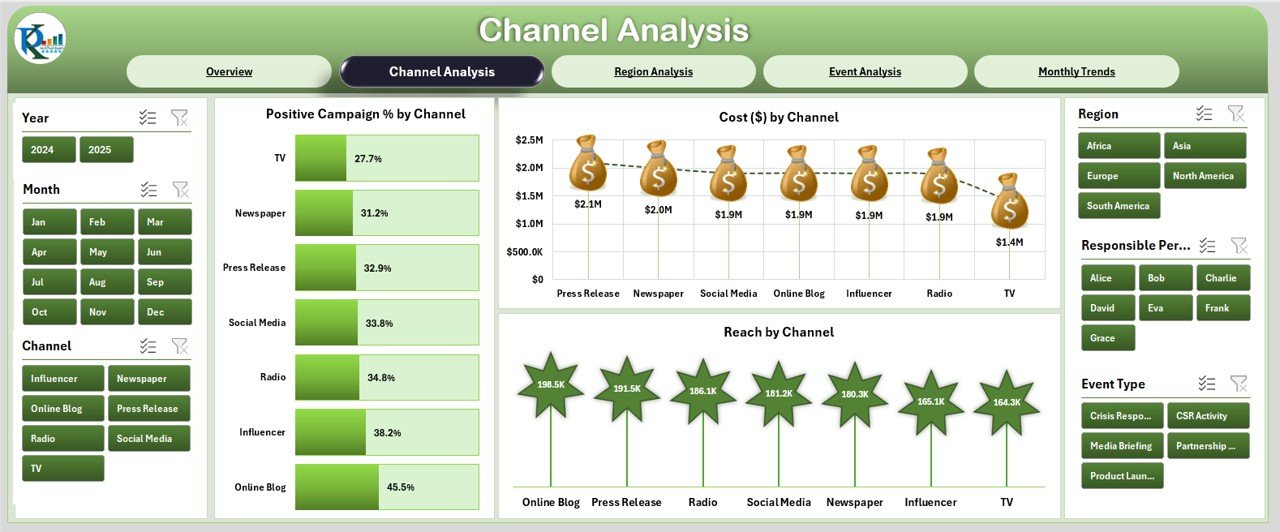
📈 Channel Analysis – Compare positive mentions, costs, and reach across platforms.
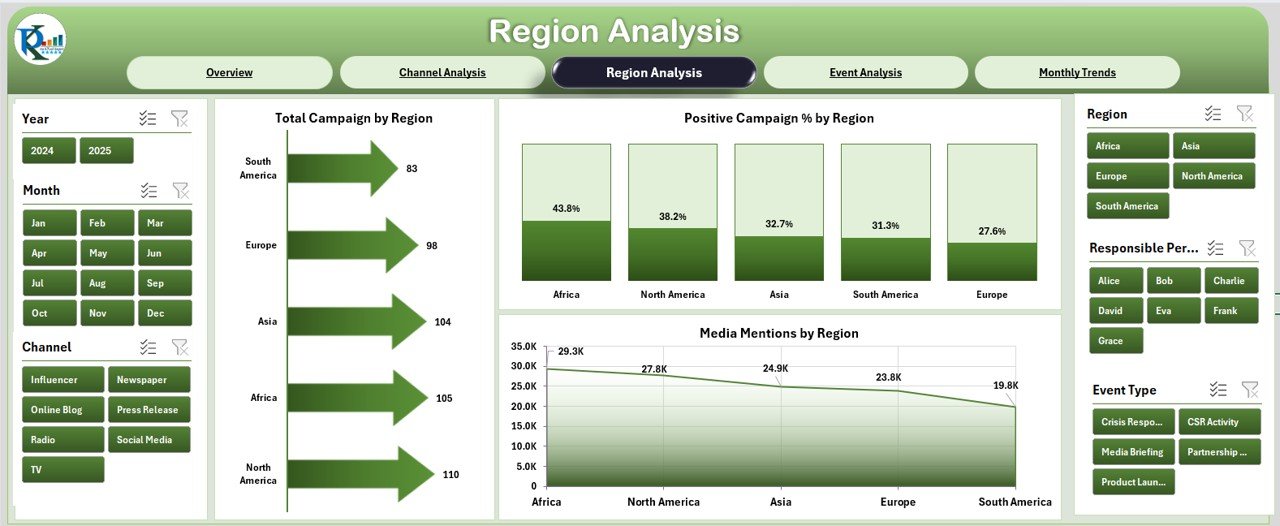
🌍 Regional Insights – Evaluate campaigns and media mentions by geography.
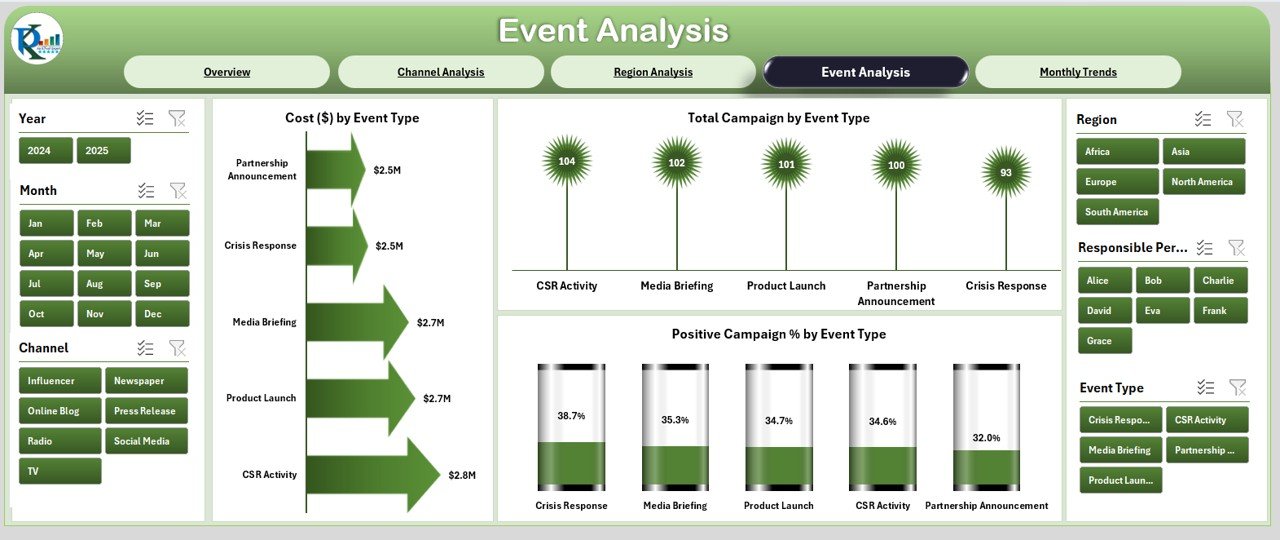
🎪 Event Performance – Analyze ROI of PR events like launches or conferences.
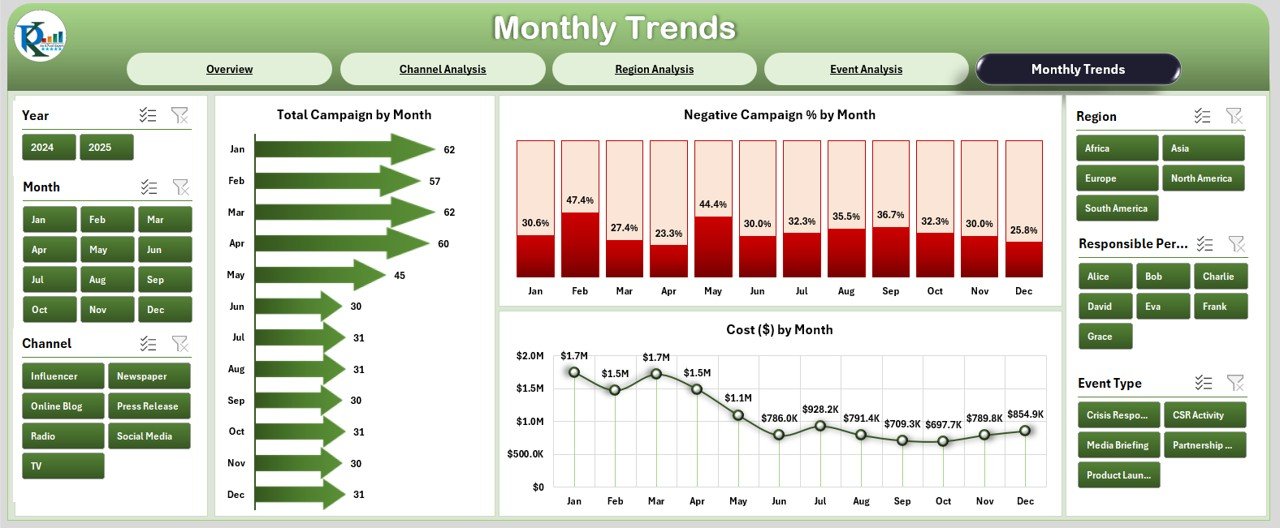
📆 Monthly Trends – Spot seasonal peaks, cost changes, and negative PR trends.
🗂 Support Sheet – Organized backend with structured reference data.
🛠 Customizable – Add new KPIs or adapt visuals to your PR strategy.
💰 Cost-Effective – Excel-based, no expensive PR analytics tools required.
📂 What’s Inside the PR Dashboard
Overview Page – The central hub with KPI cards, slicers, and charts for campaign, cost, sentiment, and reach.
Channel Analysis – Track performance by media type (social, print, TV, digital, events).
Region Analysis – Monitor campaigns, positive % results, and mentions across locations.
Event Analysis – Evaluate cost, reach, and sentiment for PR events.
Monthly Trends – Analyze campaign count, sentiment %, and cost trends month by month.
Support Sheet – The backend powering all visuals with dropdowns, regions, statuses, and channels.
📖 How to Use the PR Dashboard
Enter Campaign Data – Fill in campaign details like channel, region, event type, cost, and reach.
Navigate Pages – Use the page navigator to switch between overview, channels, events, and trends.
Filter with Slicers – Narrow down insights by time, region, or campaign type.
Review Metrics – Use KPI cards and charts to measure performance and sentiment.
Take Action – Identify high-performing regions/channels and optimize campaign budgets.
👥 Who Can Benefit from This Dashboard?
🏢 Corporate PR Teams – Track digital, print, and media campaigns.
🌍 Nonprofits & NGOs – Measure outreach and awareness initiatives.
🏛 Government Agencies – Monitor public perception of policies and programs.
🎪 Event Firms – Evaluate event reach, sentiment, and cost efficiency.
🚀 Startups & SMEs – Optimize PR spending and identify effective channels.
This dashboard provides a single source of truth for campaign analysis and storytelling.
✅ Click here to read the Detailed blog post
Visit our YouTube channel to learn step-by-step video tutorials
Watch the step-by-step video tutorial:
Compatibility and Requirements
- Works in Microsoft Excel desktop (Excel 2016 or later, or Microsoft 365).
- The Overview page uses slicers to filter by time, region, channel and campaign type. Microsoft explains them in Use slicers to filter data.
Frequently Asked Questions
Which pages does the dashboard have?
Five analytical pages: Overview, Channel Analysis, Region Analysis, Event Analysis and Monthly Trends. A Support sheet holds the reference data behind the visuals.
What can I filter with the slicers?
You can filter by time, region, channel or campaign type, and the KPI cards and charts update to match.
Which metrics does it track?
Campaign count, cost, reach and sentiment on the KPI cards. The pages also show positive mentions and positive percentage by channel and region, plus cost, reach and sentiment for PR events.
Can I change the KPIs or visuals?
Yes. You can add new KPIs or adapt the visuals to your PR strategy.
Is there a Power BI or Google Sheets version?
Yes. See the Public Relations (PR) Dashboard in Power BI and the Public Relations (PR) Dashboard in Google Sheets.
Related Public Relations Templates
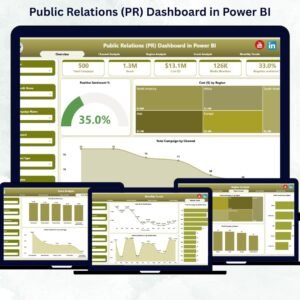
- Public Relations (PR) Dashboard in Power BI: the same topic in Power BI
- Public Relations (PR) Dashboard in Google Sheets: the Google Sheets edition
- Public Relations KPI Dashboard in Excel: a KPI-focused view for PR teams
- Public Relations (PR) Report in Excel: a report format for PR results
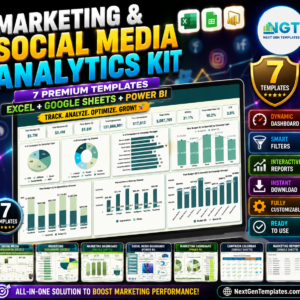
- Marketing and Social Media Analytics Kit: 7 templates for marketing analytics
Browse all Excel dashboards.

















Reviews
There are no reviews yet.