

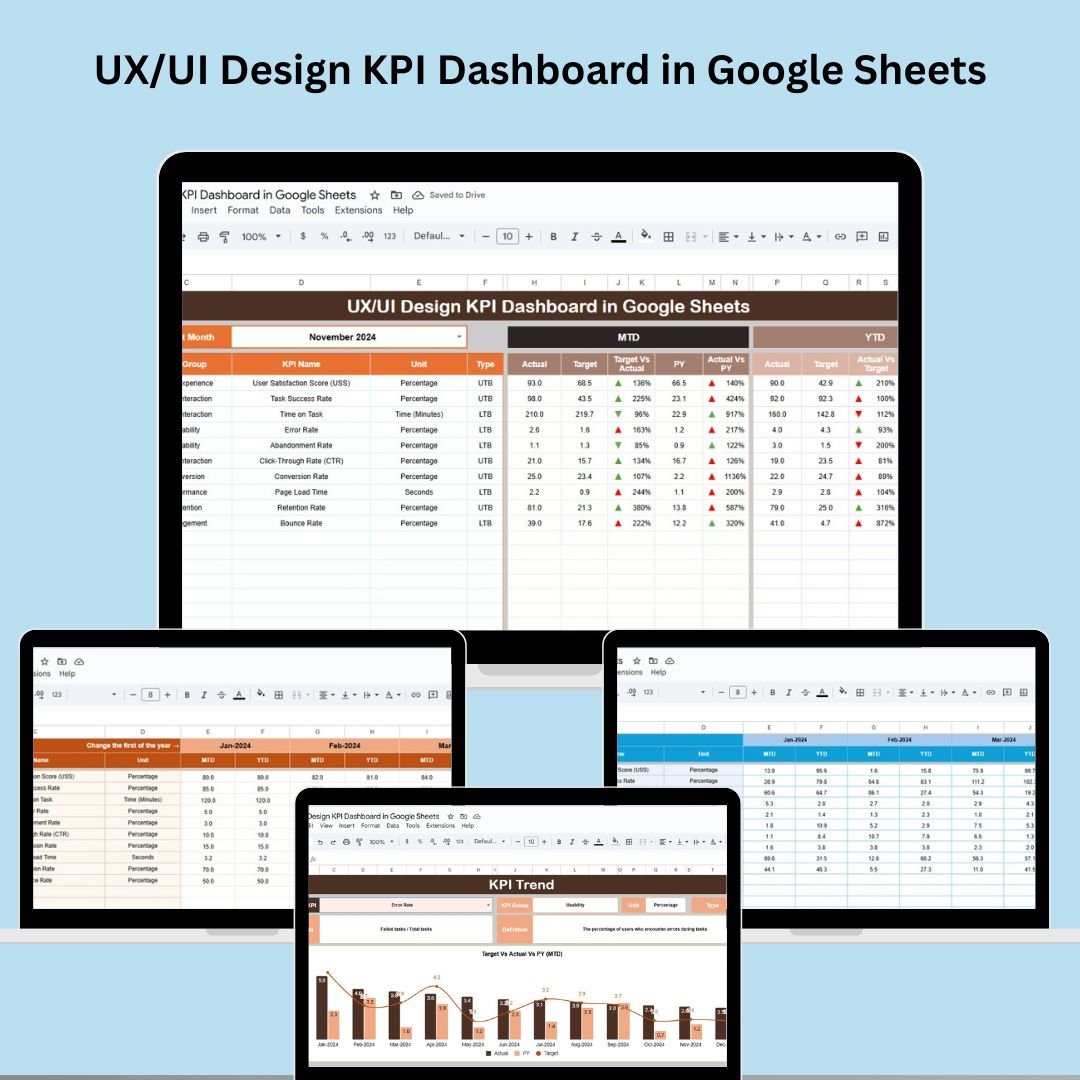

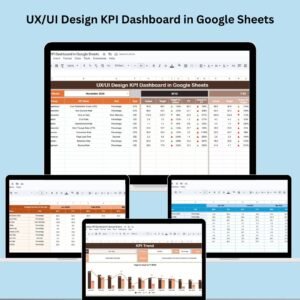
In today’s fast-paced digital world, great design is not just about creativity—it’s about measurable impact. The UX/UI Design KPI Dashboard in Google Sheets is your all-in-one solution to track, evaluate, and improve user experience and interface design using real-time data.
Whether you’re a solo designer, part of an agile product team, or leading a UX department, this ready-to-use dashboard helps you monitor key design KPIs, benchmark performance, and communicate results—all in a visually stunning format right inside Google Sheets.
✨ Key Features of the UX/UI Design KPI Dashboard
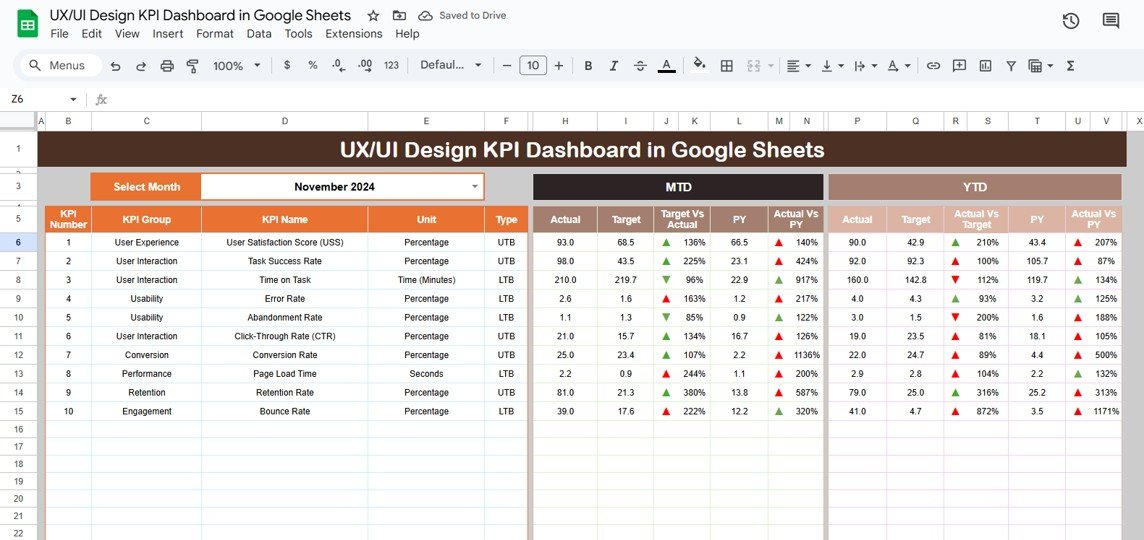
📊 Interactive Dashboard Page
Easily select the month from a dropdown, and the dashboard updates instantly! Compare:
MTD (Month-To-Date) and YTD (Year-To-Date) Actuals
Target vs Actual
Previous Year vs Actual
📈 Arrows with conditional formatting show whether metrics are improving or declining at a glance.
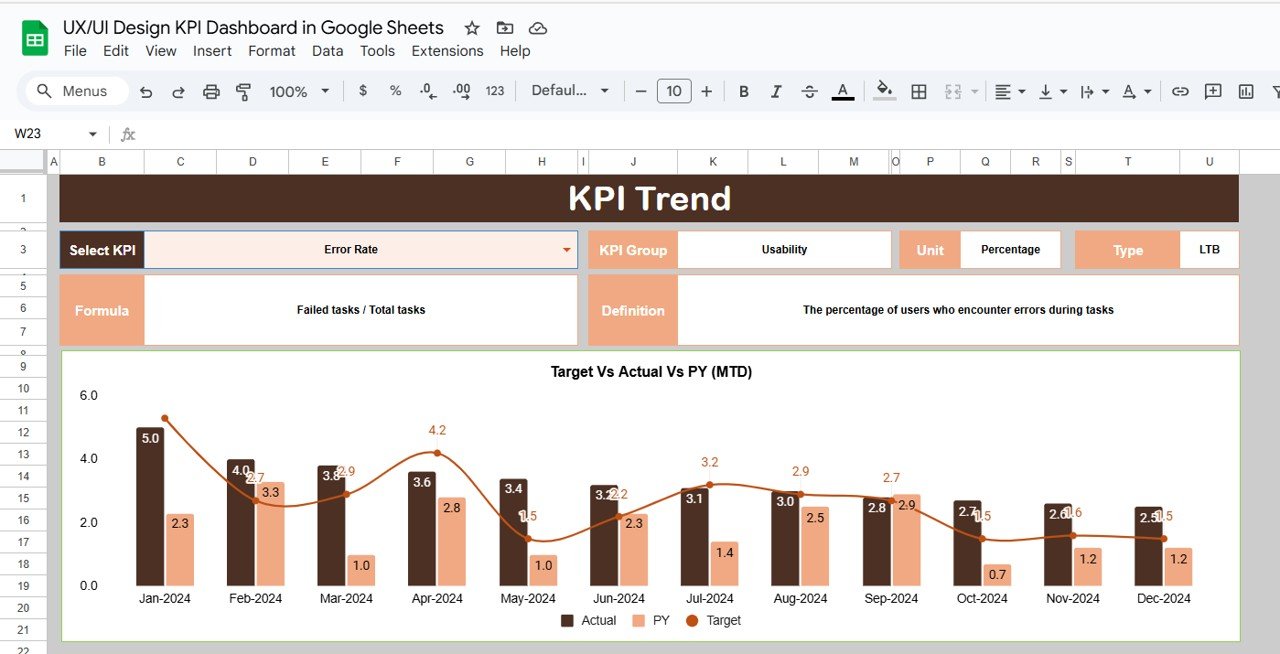
🔍 KPI Trend Sheet
Pick any KPI from the dropdown and instantly get:
KPI Group, Unit, Type (UTB/LTB)
Formula and Definition
Track historical data trends with precision.
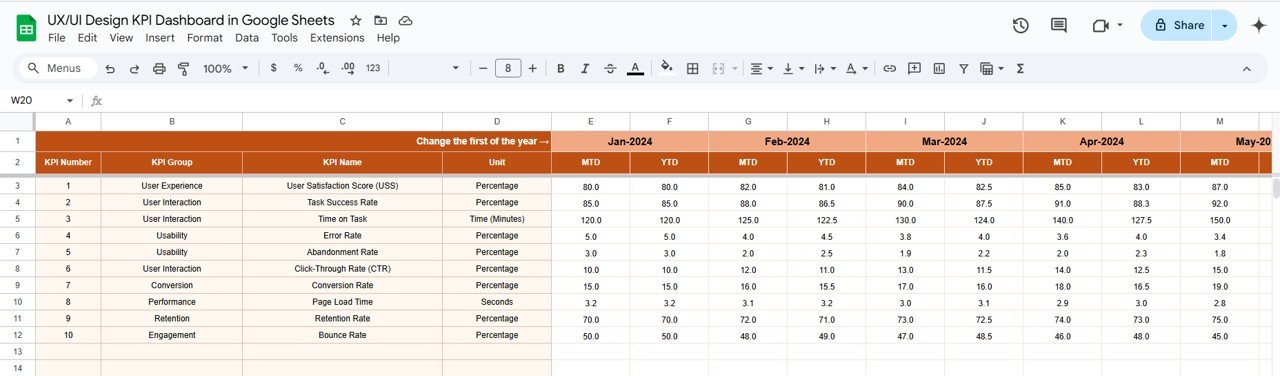
📝 Actual Numbers Input
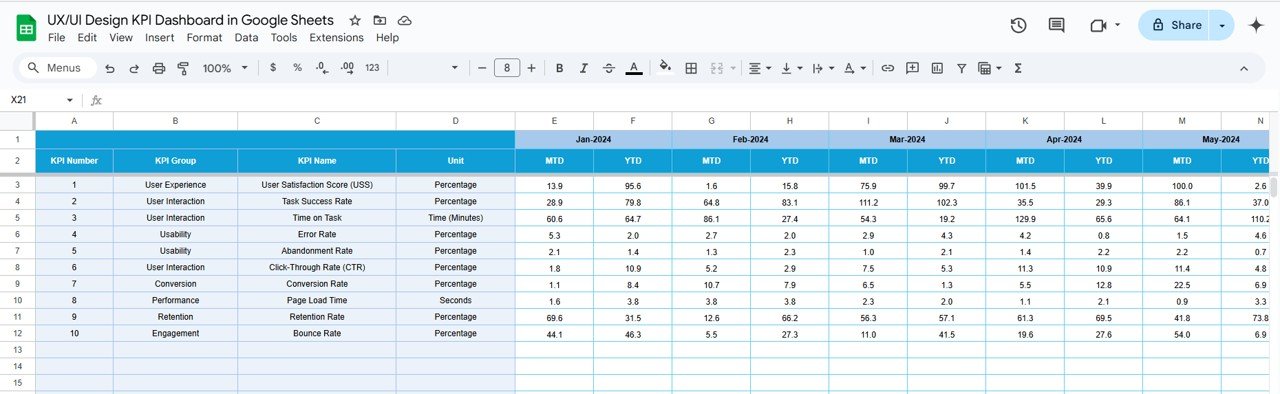
Enter your actual performance metrics for MTD and YTD in a structured layout. The entire dashboard syncs instantly.
🎯 Target Sheet
Input monthly targets for each KPI—helps you benchmark your design goals.
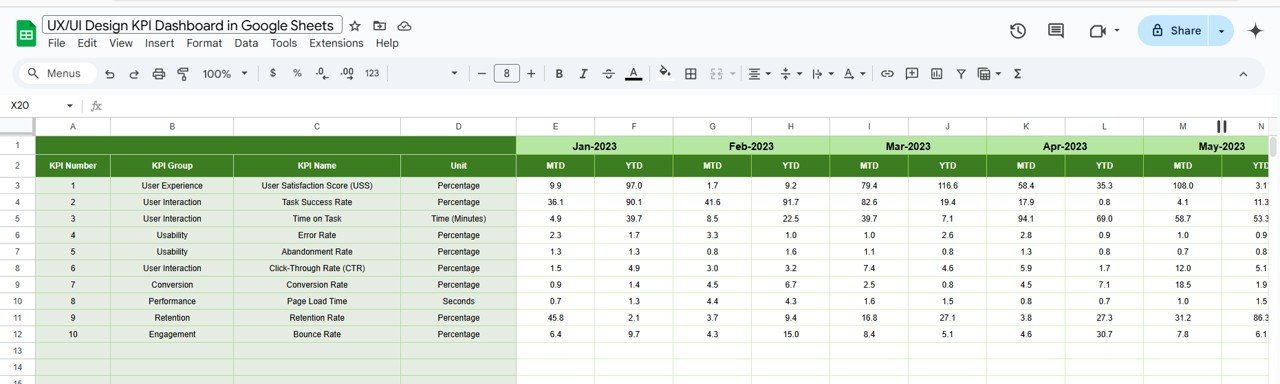
📅 Previous Year Numbers
Compare this year’s metrics against last year’s to evaluate growth, gaps, or regressions.
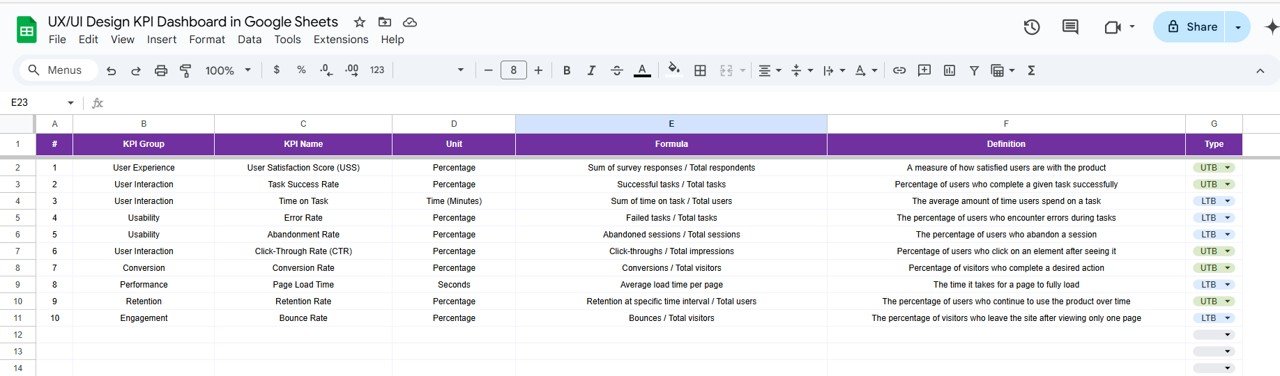
📘 KPI Definition Sheet
Understand each KPI clearly with its:
Name, Unit, Formula
Definition
Type (Lower the Better or Upper the Better)
🧩 What’s Inside the Dashboard?
This dashboard includes 6 smartly designed sheets:
Dashboard Sheet – Interactive visualization with dropdowns and arrows
KPI Trend Sheet – Focus on individual KPIs with formulas & insights
Actual Numbers – Data entry for MTD/YTD
Target Sheet – Monthly design goals
Previous Year Data – Year-over-year performance view
KPI Definition – Clarity on every metric
All connected. All automated. All Google Sheets.
🚀 How to Use the UX/UI Design KPI Dashboard
🧩 Step 1: Open the Google Sheet and go to the “Actual Numbers” tab
📝 Step 2: Enter your design performance data for the selected month
🎯 Step 3: Set your MTD and YTD targets
📅 Step 4: Enter Previous Year’s data (optional)
📊 Step 5: Review dynamic charts, arrows, and trends in the Dashboard & KPI Trend pages
⚙️ Everything auto-updates—no coding required!
👥 Who Can Benefit from This Dashboard?
🎨 UX/UI Designers – Track and showcase your design performance with data
👩💻 Product Managers – Align user experience metrics with product goals
📈 Design Leads – Evaluate team-wide design health
🏢 Startups & Agencies – Report design value to clients and stakeholders
🧪 User Researchers – Monitor satisfaction, load time, errors, and engagement
Whether you work on websites, mobile apps, or software interfaces—this tool delivers!
💡 Why You’ll Love This Template
✔ Google Sheets-Based – No need for complex tools
✔ Real-Time Performance Monitoring
✔ User-Friendly & Editable
✔ Visual Performance Indicators (Arrows, Colors)
✔ Collaborate with Your Team Live
✔ Cost-Effective, No Subscription Needed
Start measuring design success—not just guessing it.
🔗 Click here to read the Detailed blog post
Click here to read the Detailed blog post
Watch the step-by-step video Demo:
🎥 Visit our YouTube channel to learn step-by-step video tutorials
Youtube.com/@NeotechNavigators
Compatibility and Requirements
- Works in Google Sheets. You need a free Google account and a web browser.
- You pick the month from a dropdown on the Dashboard sheet and the KPI from a dropdown on the KPI Trend sheet. Google explains dropdowns in Create an in-cell dropdown list.
Frequently Asked Questions
Which sheets are included?
Six sheets: Dashboard, KPI Trend, Actual Numbers, Target, Previous Year Data and KPI Definition.
How do I update the dashboard?
Enter your MTD and YTD figures in the Actual Numbers sheet and your monthly goals in the Target sheet. Then select a month on the Dashboard sheet and it updates.
Can I compare this year with last year?
Yes. Add last year’s figures to the Previous Year Data sheet. Arrows with conditional formatting show whether each metric is improving or declining.
How do I see the trend for one KPI?
Open the KPI Trend sheet and pick the KPI from the dropdown. It shows the KPI group, unit, type (UTB or LTB), formula and definition.
Is there an Excel or Power BI version?
Yes. See the UX/UI Design KPI Dashboard in Excel and the UXUI Design KPI Dashboard in Power BI.
Related Design Dashboard Templates
- UX/UI Design KPI Dashboard in Excel: the same KPIs in Excel
- UXUI Design KPI Dashboard in Power BI: the Power BI edition
- Architecture and Design Dashboard in Google Sheets: a design dashboard in Google Sheets
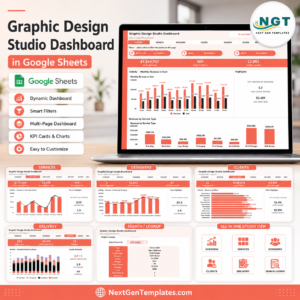
- Graphic Design Studio Dashboard in Google Sheets: a studio view in Google Sheets
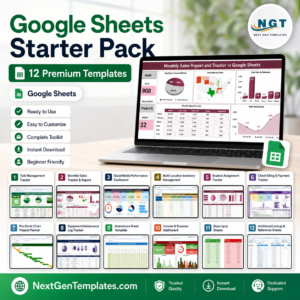
- Google Sheets Starter Pack: 12 Google Sheets templates in one download
Browse all Google Sheets KPI dashboards.




Reviews
There are no reviews yet.