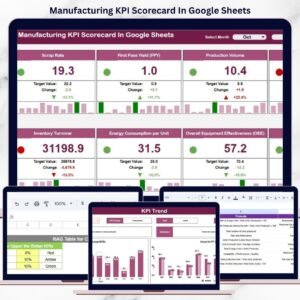
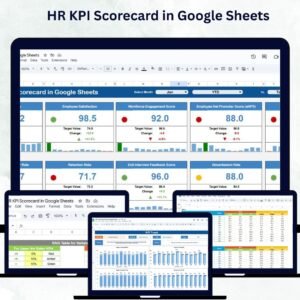
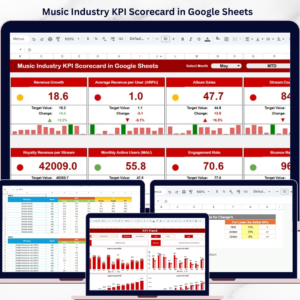
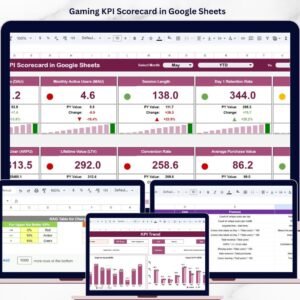
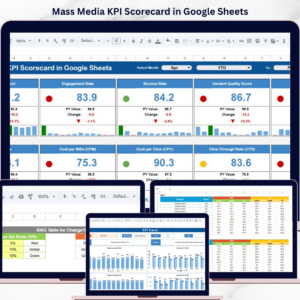
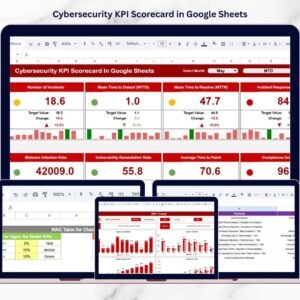
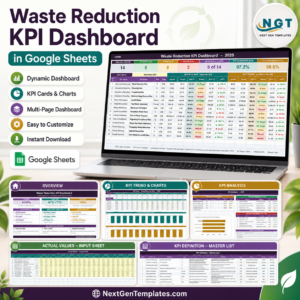
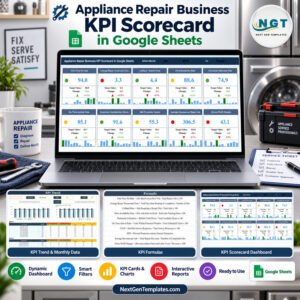
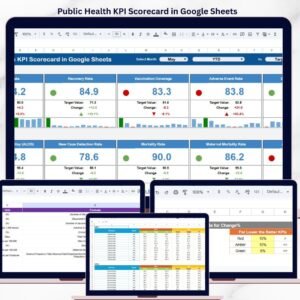
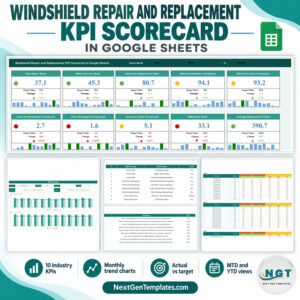
In today’s sustainability-driven world, tracking recycling performance is no longer optional—it’s essential. 🌍 Organizations, municipalities, and recycling centers must monitor waste management efficiency, environmental impact, and operational performance to stay compliant and responsible.
But here’s the challenge… 🤔
Most organizations still rely on manual spreadsheets and disconnected reports, making it difficult to track KPIs, identify gaps, and improve performance.
That’s where the Recycling KPI Scorecard in Google Sheets comes in! 🚀
This powerful, ready-to-use template is designed to help you track, analyze, and improve recycling performance with ease. It transforms complex data into simple, visual insights so you can make faster, smarter, and more sustainable decisions.
Whether you are managing a recycling plant, municipality, or sustainability program, this scorecard gives you complete control over your recycling KPIs.

💡 Key Features of Recycling KPI Scorecard in Google Sheets
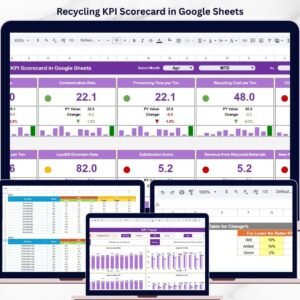
📊 Dynamic KPI Scorecard – Monitor all recycling KPIs in one interactive dashboard.
📅 Month Selection Control – Instantly update data by selecting a specific month.
📈 MTD & YTD Analysis Toggle – Switch between monthly and yearly insights easily.
🚦 Traffic Light Indicators – Identify performance levels with green, yellow, and red signals.
🔺 Up & Down Arrows – Track KPI improvements and declines instantly.
📉 Automated Calculations – No manual formulas required—everything updates automatically.
📊 KPI Trend Analysis Sheet – Visualize KPI performance trends over time.
🧾 Structured Data Input Sheet – Maintain clean and accurate data entry.
🎨 Customizable Color Settings – Adjust thresholds and indicators as per your standards.
📦 What’s Inside the Recycling KPI Scorecard in Google Sheets
This comprehensive template includes multiple sheets designed for complete performance tracking:
📌 KPI Scorecard Sheet
The main dashboard showing KPI performance with traffic light indicators, arrows, and comparisons.
📌 Trend Sheet
Analyze KPI performance trends with dropdown selection and dynamic charts.
📌 Data Input Sheet
Enter raw KPI values such as recycling rate, waste diversion, and processing efficiency.
📌 KPI Definition Sheet
Define KPI names, formulas, units, and descriptions for consistency.
📌 Color Settings Sheet
Customize performance thresholds and indicator colors.
Together, these sheets create a complete recycling performance management system.
⚙️ How to Use the Recycling KPI Scorecard in Google Sheets
You can start using this template in just a few simple steps:
👉 Step 1: Define KPIs
Enter KPI details such as name, group, and formula in the KPI Definition sheet.
👉 Step 2: Input Data
Add monthly recycling data in the Data Input sheet.
👉 Step 3: Set Performance Thresholds
Customize color indicators and KPI limits in the Color Settings sheet.
👉 Step 4: Select Month & View Insights
Choose a month from the dropdown to update the dashboard instantly.
👉 Step 5: Analyze Trends
Use the Trend sheet to identify patterns and improvement areas.
Within minutes, you’ll have a fully functional recycling analytics system ready to drive sustainability success.
👥 Who Can Benefit from This Recycling KPI Scorecard in Google Sheets
🏭 Recycling Plants – Monitor operational efficiency and processing performance.
🏢 Municipal Corporations – Track waste management and environmental KPIs.
🌱 Sustainability Teams – Measure environmental impact and compliance metrics.
📊 Data Analysts – Analyze recycling trends and performance insights.
💼 Environmental Consultants – Improve sustainability strategies.
📈 Business Owners – Optimize recycling processes and reduce costs.
If your goal is to improve recycling efficiency, track sustainability performance, and make better decisions—this scorecard is your perfect solution.
This is not just a spreadsheet—it’s a complete sustainability performance tool. It helps you identify gaps, improve processes, and achieve environmental goals faster.
💥 Stop guessing your recycling performance.
💥 Start tracking it with clarity and confidence.
📖 Click here to read the Detailed blog post
🎥 Visit our YouTube channel to learn step-by-step video tutorials
👉 https://www.youtube.com/@PKAnExcelExpert
Compatibility and Requirements
- Works in Google Sheets. You need a free Google account and a web browser.
- You pick the month from a dropdown, and the Trend sheet uses a dropdown to choose the KPI. Google explains dropdowns in Create an in-cell dropdown list.
Frequently Asked Questions
Which sheets are included?
Five sheets: KPI Scorecard, Trend, Data Input, KPI Definition and Color Settings.
How do I update the scorecard each month?
Enter your monthly recycling values in the Data Input sheet. Then pick the month from the dropdown on the KPI Scorecard sheet and the results update automatically.
Can I switch between monthly and yearly figures?
Yes. The scorecard has an MTD and YTD toggle, so you can view month-to-date or year-to-date results.
Can I change the traffic light colors and limits?
Yes. Use the Color Settings sheet to adjust the performance thresholds and indicator colors to your own standards.
Is there an Excel or Power BI version?
Yes. See the Recycling KPI Scorecard in Excel and the Recycling KPI Dashboard in Power BI.
Related Recycling and Environmental Templates
- Recycling KPI Scorecard in Excel: the same scorecard in Excel
- Recycling KPI Dashboard in Power BI: a Power BI dashboard for recycling KPIs
- Environmental KPI Scorecard in Excel: a wider set of environmental metrics
- Manufacturing KPI Scorecard in Google Sheets: another Google Sheets scorecard for plant operations
- Google Sheets Business Pack (Pro): 14 business templates in one download
Browse all Google Sheets KPI dashboards.