

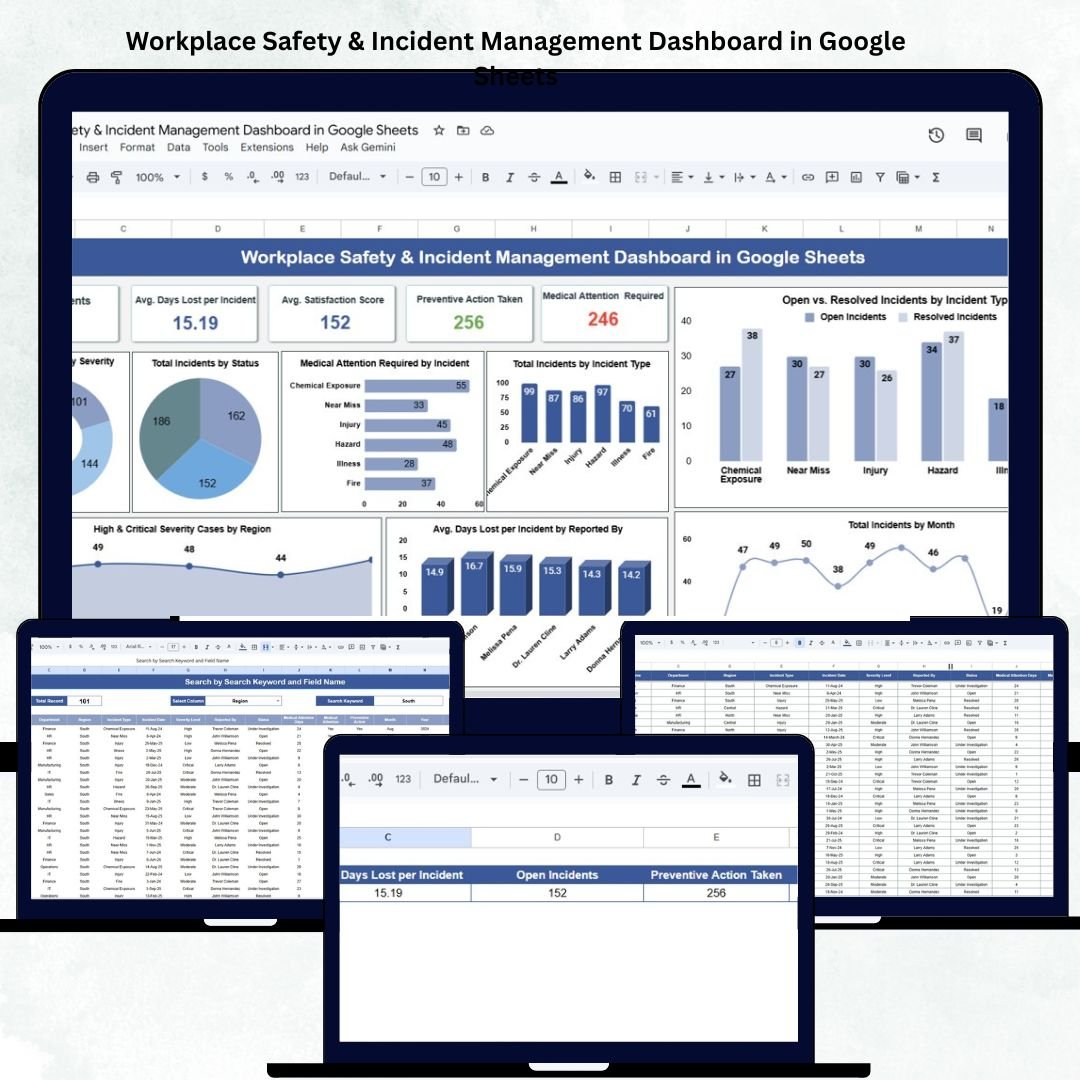

Safety at the workplace is not just a regulatory requirement — it’s a cornerstone of operational excellence. The Workplace Safety & Incident Management Dashboard in Google Sheets is a ready-to-use, cloud-based tool designed to help organizations track, analyze, and manage safety incidents effectively. 🦺📊
Built entirely in Google Sheets, this dashboard centralizes all incident data, visualizes key safety KPIs, and provides department- and category-level insights to improve workplace safety and compliance. With real-time updates, automated charts, and actionable insights, it enables safety managers and HR professionals to make informed, data-driven decisions that keep employees safe and organizations compliant.
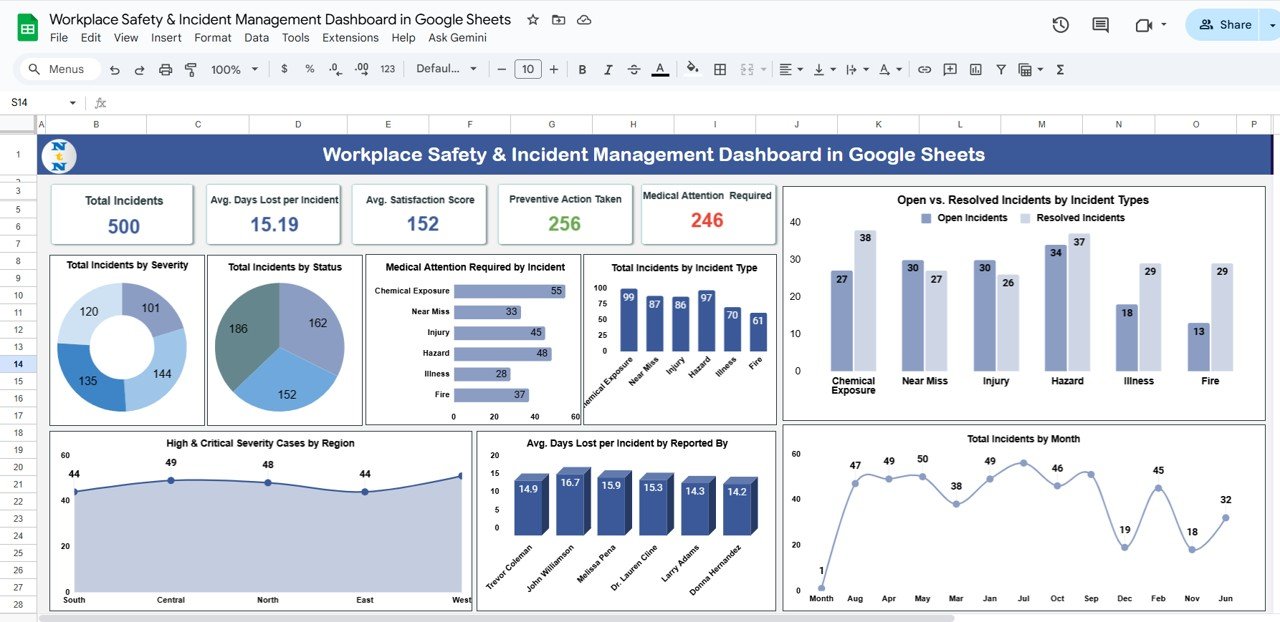
🔑 Key Features of the Workplace Safety & Incident Management Dashboard in Google Sheets
📋 Dashboard Sheet Tab (Main Dashboard)
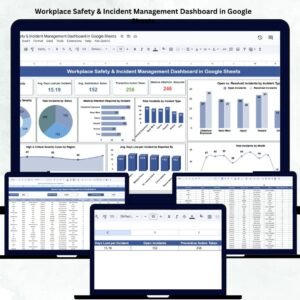
The dashboard sheet provides an interactive and comprehensive overview of workplace safety performance.
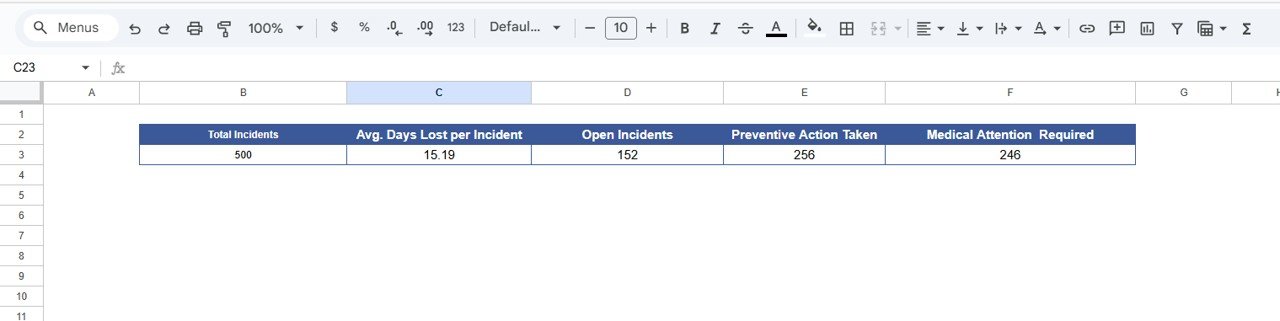
Cards Displayed:
🚨 Total Incidents: Overall count of incidents recorded during the reporting period.
⏱️ Avg. Days Lost per Incident: Measures lost time efficiency.
📂 Open Incidents: Tracks ongoing or unresolved cases.
✅ Preventive Actions Taken: Monitors completed corrective or preventive actions.
🏥 Medical Attention Required: Counts incidents requiring medical assistance.
Charts Included:
📊 Total Incidents by Severity Level – Categorizes incidents into Low, Medium, High, and Critical.
🧭 Total Incidents by Status – Monitors Open, Resolved, and Under Review cases.
🩺 Medical Attention Required by Incident Type – Analyzes incidents needing healthcare intervention.
⚙️ Total Incidents by Type – Breaks down incidents into Injury, Property Damage, Near Miss, etc.
🔍 Open vs Resolved Incidents by Type – Evaluates team responsiveness and resolution rates.
📅 Total Incidents by Month – Identifies spikes or seasonal patterns in incident occurrence.
📍 High & Critical Severity Cases by Region – Highlights high-risk areas for management focus.
These visuals give safety officers a clear understanding of risks, trends, and preventive effectiveness at a glance.
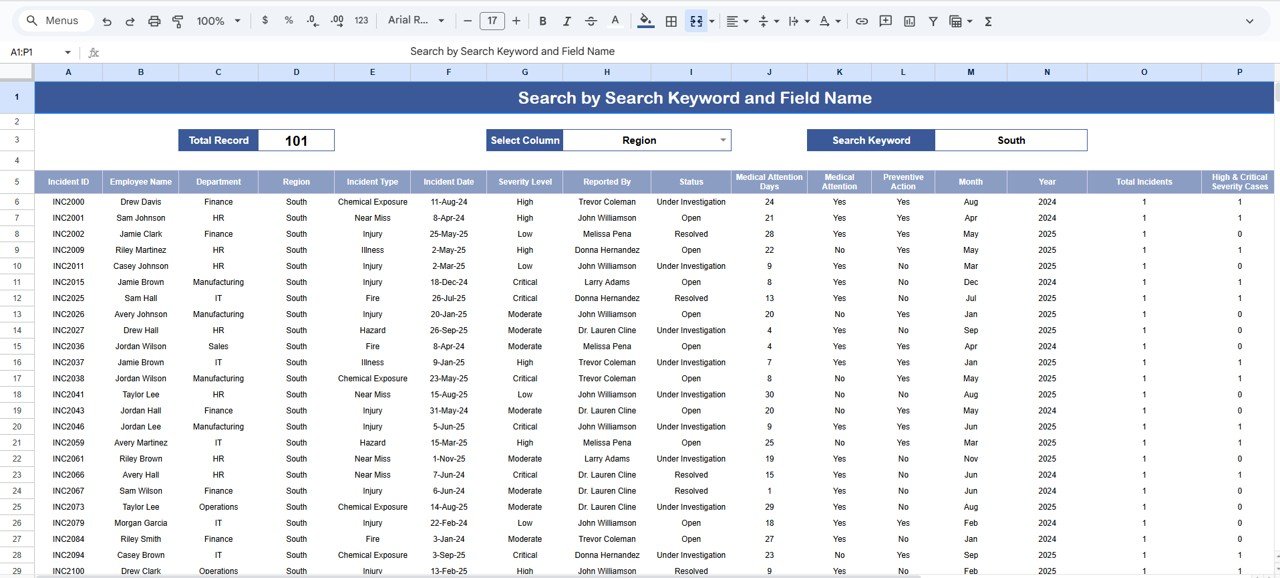
🔍 Search Sheet Tab (Smart Filtering)
Quickly search and filter incident records using keywords or specific fields.
Examples:
“Status = Open” → Shows all unresolved incidents.
“Severity = Critical” → Lists all major incidents requiring urgent action.
“Department = Operations” → Displays department-specific safety data.
This tab streamlines incident review, making it easy for teams to retrieve information without scrolling through large datasets.
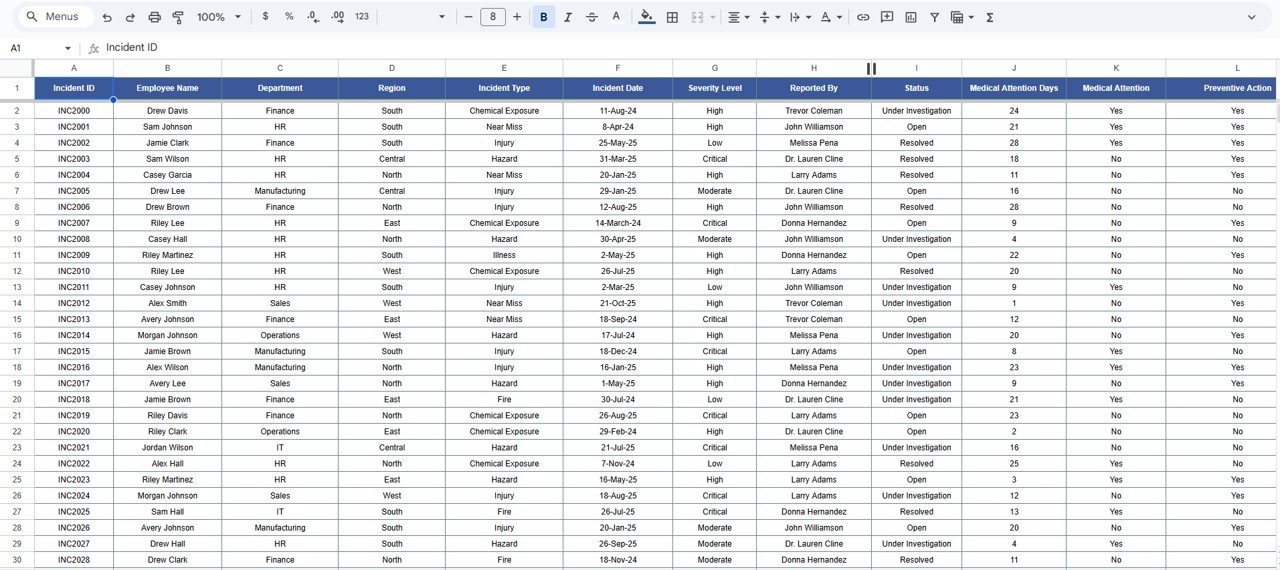
🧾 Data Sheet Tab (Incident Log)
This sheet stores the raw data that powers the dashboard, ensuring every record is traceable and standardized.
Typical Fields Include:
Incident ID
Department
Location/Region
Severity Level
Incident Type
Status
Days Lost
Reported By
Corrective/Preventive Actions
This structure enables automated chart updates and minimizes reporting errors.
⚙️ Support Sheet Tab (Reference Data)
Contains dropdown lists for consistent data entry, such as severity levels, departments, regions, and statuses — ensuring clean and uniform data management across teams.
📦 What’s Inside the Dashboard
✅ Pre-built, interactive Google Sheets dashboard
✅ Real-time KPI visualization
✅ Dynamic charts by severity, type, and department
✅ Smart search functionality
✅ Cloud collaboration support
✅ Customizable data fields and visuals
🧑💼 Who Can Use This Dashboard
🦺 Safety Managers & Officers – Track incidents, response times, and preventive actions.
🏭 Operations Teams – Identify high-risk areas and ensure safety protocol adherence.
👩💼 HR & Compliance Departments – Maintain legal compliance and monitor employee safety.
📊 Executives & Auditors – Gain transparent visibility into organizational safety performance.
Perfect for organizations in manufacturing, construction, logistics, and corporate offices that need centralized safety tracking.
⚙️ Opportunities for Improvement
Enhance the dashboard by adding:
Google Forms Integration: Capture real-time incident reports.
Email Alerts: Notify managers about high-severity incidents using Google Apps Script.
Heat Maps: Visualize incident hotspots by region or facility.
Root Cause Analysis (RCA) Tracking: Link causes to preventive measures.
Cost Analysis: Track financial impact of incidents.
🧠 Best Practices
✅ Log every incident immediately to maintain accuracy.
✅ Use consistent naming for departments and severity levels.
✅ Update status regularly to keep visuals current.
✅ Review data monthly to spot recurring issues.
✅ Use color-coded alerts for critical or overdue incidents.
🌟 Why Choose the Workplace Safety & Incident Management Dashboard
🧭 Centralized safety monitoring system
🧩 Real-time, auto-updating KPIs and charts
☁️ 100% cloud-based, accessible anywhere
🔄 Fully customizable for your organization’s needs
🚀 Easy collaboration between HR, Safety, and Operations teams
The Workplace Safety & Incident Management Dashboard in Google Sheets helps organizations stay proactive in managing safety incidents, reducing risks, and creating safer work environments — all through an intuitive and automated system. 🦺✅
🔗 Click here to read the Detailed blog post
Watch the step-by-step video Demo:
🔗 Visit our YouTube channel for step-by-step video tutorials
Compatibility and Requirements
- Works in Google Sheets with a free Google account and a web browser. Nothing to install.
- The Support sheet holds the dropdown lists for severity, department, region and status. Google explains dropdowns in Create an in-cell dropdown list.
Frequently Asked Questions
Which KPI cards does the dashboard show?
Total incidents, average days lost per incident, open incidents, preventive actions taken and incidents that needed medical attention.
How do I find specific incidents?
Use the Search sheet. Filter by a field such as status, severity or department to list matching records.
What does each incident record hold?
Incident ID, department, location or region, severity level, incident type, status, days lost, reported by and corrective or preventive actions.
Can several people update it?
Yes. It is a cloud-based Google Sheets file, so HR, safety and operations teams can work in it together.
Related Safety and Incident Templates
- Incident Report Tracker in Google Sheets: log individual incidents in detail.
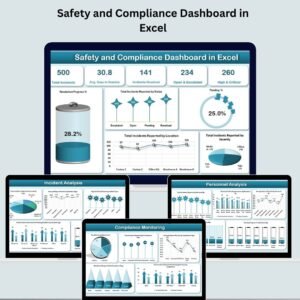
- Safety and Compliance Dashboard in Excel: a safety dashboard for Excel users.
- Incident Report Tracker in Excel: the Excel incident tracker.
- Safety and Compliance Dashboard in Power BI: safety reporting in Power BI.
- Compliance Audit Tracker in Google Sheets: track audits and findings.
Browse all Google Sheets dashboard templates or the Health and Safety templates.








Reviews
There are no reviews yet.