

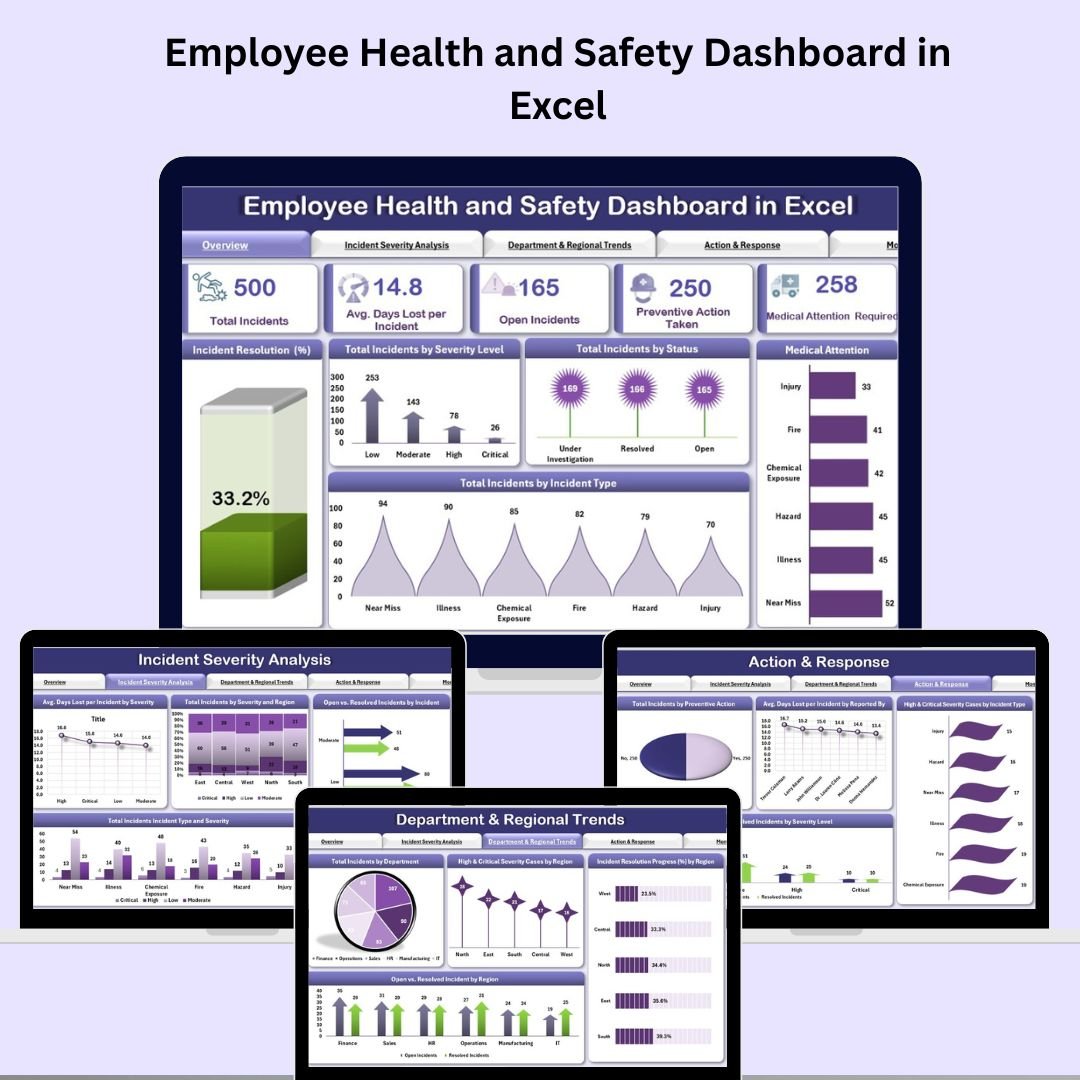



Keeping your workplace safe just got smarter! The Employee Health and Safety Dashboard in Excel is a ready-to-use, data-driven solution that helps HR, compliance officers, and safety teams track incidents, monitor medical cases, analyze resolution trends, and implement preventive actions — all in one centralized dashboard.
This tool transforms incident data into visual insights so you can make informed safety decisions, reduce risks, and foster a culture of proactive health and safety management.
🔍 Key Features of Employee Health and Safety Dashboard
🏠 1. Overview Sheet – High-Level Safety Metrics
📌 Cards: Total Incidents, Avg. Days Lost, Open Incidents, Preventive Actions Taken, Medical Attention Required
📈 Charts: Resolution Progress %, Incidents by Severity, Status, Type, Medical Needs
🚨 2. Incident Severity Analysis Sheet – Risk Impact Visualization
🔥 Avg. Days Lost by Severity
🌐 Incidents by Severity & Region
🧾 Open vs Resolved by Type
🚧 Risk Mapping by Type & Severity
🏢 3. Department & Regional Trends – Locate Risk Hotspots
🏬 Incidents by Department
🌎 High/Critical Cases by Region
🛠️ Resolution Trends by Region
⚖️ Open vs Resolved by Region
🛡️ 4. Action & Response Sheet – Monitor Preventive Efforts
✔️ Preventive Actions Taken
📋 Days Lost by Reporter
🔍 High Severity by Incident Type
⚠️ Open vs Resolved by Severity Level
📅 5. Monthly Trend Sheet – Time-Based Tracking
📆 Incidents by Month
⏱️ Avg. Days Lost by Month
🏥 Medical Cases Monthly
📊 Resolution % Trendline
📋 6. Data Sheet Tab – Master Database
All raw data in one place: ID, Incident Type, Severity, Location, Medical Required, Days Lost, Reporter, Status, Region, Dates, etc.
📦 What’s Inside the Download Package?
✅ 6 Powerful Excel Sheets (Dashboard-Ready)
✅ Pre-Built Cards and Charts
✅ Auto-Updating Trend Visualizations
✅ Searchable, Filterable Data Table
✅ Fully Customizable for Your Organization
🛠️ How to Use the Dashboard
📝 Enter incident data into the Data Sheet
🔄 Dashboard auto-updates all visualizations
📌 Use slicers, charts & cards for instant insights
🧠 Make decisions based on real trends and patterns
📤 Share with HR, Compliance, and Safety Teams
👥 Who Should Use This?
🧑🔧 Health & Safety Officers
🧾 HR & Admin Teams
🏢 Operations Managers
📋 Compliance Auditors
🛠️ Facility & Risk Managers
🧑⚕️ Workplace Medical Coordinators
Whether you’re a small business or a large enterprise, this dashboard gives complete visibility into health and safety KPIs across departments and regions.
Click here read detailed blog post
Watch the step-by-step video Demo:
Check out our step-by-step video tutorial on YouTube:
🎥 youtube.com/@PKAnExcelExpert
Compatibility and Requirements
- Works in Microsoft Excel desktop (Excel 2016 or later, or Microsoft 365).
- For help with the Excel features it uses, see Microsoft’s guide Use slicers to filter data.
Frequently Asked Questions
Which KPI cards are on the Overview sheet?
Total Incidents, Average Days Lost, Open Incidents, Preventive Actions Taken and Medical Attention Required.
Which sheets are included?
Six: Overview, Incident Severity Analysis, Department and Regional Trends, Action and Response, Monthly Trend, and the Data Sheet.
What data do I enter?
Each incident’s ID, type, severity, location, medical requirement, days lost, reporter, status, region and dates go into the Data Sheet.
Can I see safety trends by month?
Yes. The Monthly Trend sheet shows incidents, average days lost, medical cases and resolution % by month.
Related Health and Safety Templates
- Employee Health and Safety Dashboard in Google Sheets: the Google Sheets edition.
- Employee Health and Safety Dashboard in Power BI: the Power BI edition.
- Safety and Compliance Dashboard in Excel: track safety and compliance together.
- Employee Health and Safety Report in Excel: a report-style safety summary in Excel.
- Health and Safety Monitoring Checklist in Excel: a checklist for routine safety checks.
Browse all health and safety templates or the Excel dashboards.












Reviews
There are no reviews yet.